yinlilin / cmplot Goto Github PK
View Code? Open in Web Editor NEW📊 Circular and Rectangular Manhattan Plot
📊 Circular and Rectangular Manhattan Plot


Thank you for the very useful function.
I was wondering if it would be possible to add different cut-offs lines for each trait in a circular Manhattan plot. I am actually using the CMplot function to plot different Manhattan plot based on a selection scan, and each trait (in this case population) has a different genome-wide significant value.
Hi Yin,
Thank you for offering a very comprehensive and useful package CMplot , I noticed that I can't define the title when I make a manhattan plot (main option in plot), by default, it's "Manhattan plot of ...", I wonder how can I remove the title? Thanks.
Dong
Hi Lilin,
Hope you are doing good.
I made nice plots, thanks for the package. But when I want to edit them in illustrator, so I want to save them in pdf format. I have problems with opening the pdf format generated in this package. This may be because the pdf is interactive?? If I use either jpg or tiff, I see a pixel break in the images.
So do you have any other means to save them in vector format for easy editing?
Could you please help me out.
Kind regards,
Manjusst
Hi @YinLiLin !
Is there a way to change output file name and not use the default Rectangular-Manhattan.P_memo?
I want it just to print memo
Also, can I just annotate with text only the top result per chromosome, as in qqman?
Dear Sir,
I am having trouble in highlighting selected snps in to the data. I am able to plot manhattan plot without highlighting the data but I need to mention the interested peaks.
My data look like this:
id,chrom,start,stop,pos_start,pos_stop,modelL,nullL,sel_coef,nSNPs,nSNPs_avail,xpclr,xpclr_norm
1_00000001_00010000,1,1,10000,370,9391,-21.57511232,-21.57511232,0,25,25,0,-0.288632752
1_00010001_00020000,1,10001,20000,10204,19529,-28.5999139,-28.5999139,0,28,28,0,-0.288632752
1_00020001_00030000,1,20001,30000,20802,29869,-49.15397259,-49.15397259,0,43,43,0,-0.288632752
1_00030001_00040000,1,30001,40000,30199,39497,-23.50799212,-23.50799212,0,28,28,0,-0.288632752
Want to highlight xpclr peaks (58.0014, 64.837) and their gene ids.
I am running
CMplot(bp, type="h",plot.type="m", band=0.5, LOG10=FALSE, ylab="SNP effect",ylim=c(), highlight.gene=c("Gene1", "Gene2")
threshold.lty=2, threshold.lwd=1, threshold.col="red", amplify=FALSE,cex=0.6,
chr.den.col=NULL, file="jpg",memo="",dpi=300,file.output=TRUE,verbose=TRUE)
Please suggest what to fix?
Thanks
Dear LiLin-Yin,
Thanks so much for your R package "CMplot". But when I use this package to draw an SNP density map, I found that the color of this map can not be changed, the color is always "darkgreen , yellow and red". (this code: col=c("darkgreen", "yellow", "red")) The map change nothing when i change these colors. I thought that maybe the code"col" have some problem. So I tell you this problem at here and hope you can modify this problem. Thanks again!
                                                                                                                                    Yours,
                                                                                                                                    Jiazi Zhang
Following the example on the website I'm trying to generate a multitrack manhattan plot of 3 traits this is however taking well over 2 hours and seems to simply be stuck.. The stacked circular plot only takes a minute or two so I am wondering whether I am missing something or if there is a bug in the code. This is was I used:
A dataframe with columns: SNP, chr, pos and 3 traits T1, T2 and T3 with that hold p-values for around 10m SNP's
SNPs <- list(
data$SNP[data$T1<1e-8],
data$SNP[data$T2<1e-8],
data$SNP[data$T3<1e-8]
)
CMplot(data, plot.type="m",multracks=TRUE,threshold=c(1e-8,1e-6),threshold.lty=c(1,2),
threshold.lwd=c(1,1), threshold.col=c("black","grey"), amplify=TRUE,bin.size=1e6,
chr.den.col=c("darkgreen", "yellow", "red"), signal.col=c("red","green","blue"),
signal.cex=1, file="jpg",memo="",dpi=300,file.output=TRUE,verbose=TRUE,
highlight=SNPs, highlight.text=SNPs, highlight.text.cex=1.4)
It print to the command window that its plotting T1 and generates an empty jpeg, but then it just seems to stall...
Thanks for creating wonder package for plotting GWAS data.
I have a quick question: How can we define the order of trait plot in the multitrack plot?
Any idea to this error?
Error in Pmap[, 1] : subscript out of bounds
> CMplot(pval, plot.type="m", LOG10=FALSE, ylim=NULL, threshold=thr,threshold.lty=c(1,2),
+        threshold.lwd=c(1,1), threshold.col=c("black","grey"), amplify=TRUE,bin.size=1e6,
+        chr.den.col=c("darkgreen", "yellow", "red"), signal.pch=c(19,19),file="jpg",
+        memo=phecode,dpi=100,file.output=TRUE,verbose=TRUE,width=14,height=6, cex=.3,
+        signal.cex = .3, main=phecode)
Error in Pmap[, 1] : subscript out of bounds
Hello! I want to change current default unit (Mb) to Kb, but I don't know which parameter I should change?Hope your reply~Thanks!
Hello, I ran into an issue plotting two manhattans and labeling the SNPs. If you feed it a list of SNPs for highlight.text, it will always label the first one it finds. Is there a format of the highlight vector that will highlight the upper or lower SNPs independently?
library(CMplot)
data(cattle50K)
cat2 = cattle50K
cat2[,4:ncol(cattle50K)] <- apply(cattle50K[,4:ncol(cattle50K)], 2, function(x) -x )
combined = rbind(cattle50K, cat2)

SNPs <- list(
	combined$SNP[abs(combined[[4]]) >0.01],
	combined$SNP[abs(combined[[5]]) >0.01],
	combined$SNP[abs(combined[[6]]) >0.01]
)

# plot
CMplot(combined, type="h",plot.type="m", band=0.5, LOG10=FALSE, ylab="SNP effect",ylim=c(-0.02,0.02),
        threshold.lty=2, threshold.lwd=1, threshold.col="red", amplify=FALSE,cex=0.6,
        chr.den.col=NULL, file="jpg",memo="",dpi=300,file.output=TRUE,verbose=TRUE, highlight=SNPs,
        highlight.text=SNPs, highlight.col=NULL)

combined[combined$SNP %in% SNPs[[2]],]
#            SNP chr     pos Somatic cell score  Milk yield Fat percentage
# 25086 SNP25086  14 1366897        0.002724654  0.01134473     0.01725977
# 25088 SNP25088  14 1464533       -0.002148450 -0.01407219    -0.02303989
# 25089 SNP25089  14 1513351       -0.001374140  0.01087308     0.01652615
# 25090 SNP25090  14 1562168       -0.001105026  0.01048968    -0.01615920
# 25091 SNP25091  14 1610986       -0.001838383 -0.01435086     0.02367300
# 25093 SNP25093  14 1708622        0.000844426  0.01322645     0.01960535
# 25102 SNP25102  14 2147982        0.003561931  0.01003882    -0.01529792
# 67637 SNP25086  14 1366897       -0.002724654 -0.01134473    -0.01725977
# 67639 SNP25088  14 1464533        0.002148450  0.01407219     0.02303989
# 67640 SNP25089  14 1513351        0.001374140 -0.01087308    -0.01652615
# 67641 SNP25090  14 1562168        0.001105026 -0.01048968     0.01615920
# 67642 SNP25091  14 1610986        0.001838383  0.01435086    -0.02367300
# 67644 SNP25093  14 1708622       -0.000844426 -0.01322645    -0.01960535
# 67653 SNP25102  14 2147982       -0.003561931 -0.01003882     0.01529792

I have a subset of variants I want to plot. Only about 3,000 on 1 chromosome. And I have 7 traits. So I would like to make a CMplot, of course that works nicely.
CMplot(dt.temp, plot.type = "c",
         bin.size = binsize,
         r = 0.25,
         outward = TRUE,
         cir.chr = TRUE,
         cir.chr.h = 1.25,
         cir.legend = TRUE,
         cir.legend.cex = 0.5,
         box = TRUE,
         cex.lab = 0.5,
         multracks = TRUE,
         main = var.temp,
         height = 20, width = 20,
         file.output = TRUE,
         verbose = TRUE)
But it looks like the graph below.

How can I change this? Obviously I only want to plot the actual range of this particular dataset.
Hi @YinLiLin ,
I'd like to compare two data sets via line chart and draw them in one graph. While I tried the parameter multitrack = TRUE, it seems that the package connect all possilbe node through a line. So how could I implement such a feature to my program, or any other functions that is useful for me? Here is a example graph.

Thanks in advances.
Best,
Yung-Chien
Hi,
It appears that the specifications for highlight.tex.col and highlight.col are incorrect.
highlight.text.col
a vector or list, the color for added text.
These actually cannot accept a list.
Error in text.default(lay[indd, 1] + 0.5 * lay[indd, 3], lay[indd, 2] +  :
  invalid color specification
In addition: Warning messages:
1: In plot.xy(xy.coords(x, y), type = type, ...) :
  supplied color is neither numeric nor character
2: In plot.xy(xy.coords(x, y), type = type, ...) :
  supplied color is neither numeric nor character
3: In plot.xy(xy.coords(x, y), type = type, ...) :
  supplied color is neither numeric nor character
4: In plot.xy(xy.coords(x, y), type = type, ...) :
  supplied color is neither numeric nor character
5: In text.default(lay[indd, 1] + 0.5 * lay[indd, 3], lay[indd, 2] +  :
  supplied color is neither numeric nor character
6: In text.default(lay[indd, 1] + 0.5 * lay[indd, 3], lay[indd, 2] +  :
  supplied color is neither numeric nor character
7: In text.default(lay[indd, 1] + 0.5 * lay[indd, 3], lay[indd, 2] +  :
  supplied color is neither numeric nor character
8: In text.default(lay[indd, 1] + 0.5 * lay[indd, 3], lay[indd, 2] +  :
Thus, the color by dot can't be specified with multracks=T, only one vector of color can be specified and this is the same for all subplots. Could you please correct this issue or point me towards the part of your code to change?
Hi Lilin,
Hope you are doing good.
I made nice plots, thanks for the package. But I am confused about how to provide the space to label each circle. I have attached an example file where each circle is labeled as a b c d..

Could you please help me out.
Kind regards,
Manjusst
Hello,
Much apprecitated for excellent software.
I met a error warning about chromosome number. I used scaffolds as chromosomes to draw manhaton plot, total of 3000 scaffolds. I get this warning as following:
Warning message:
In max(numeric.chr, na.rm = TRUE) :
no non-missing arguments to max; returning -Inf
Could you help me check how I can figure out this error?
Thanks,
Fuyou
Hi,
I am having trouble adding gene names with this tool.
This works great: CMplot(GWASresults, plot.type="m", type = "p", LOG10=TRUE, threshold=NULL, highlight = SIG)
But the addition of the highlight.text parameter gives an error:
CMplot(GWASresults, plot.type="m", type = "p", LOG10=TRUE, threshold=NULL, highlight = SIG, highlight.text = SIG)
Error in last <<- i : cannot change value of locked binding for 'last'
SIG is a vector of character gene ID's. I have also tried sourcing CMplot from both CRAN and directly from github, but I get the same issue with both versions.
Any help with this issue would be greatly appreciated!
Thanks!
Hi,
Thank you for providing this excellent tool!
I got an error in repeating adding gene name, can you please give me a favor?
###########################
SNPs <- pig60K[pig60K[,5] < (0.05 / nrow(pig60K)), 1]
genes <- paste("GENE", 1:length(SNPs), sep="_")
set.seed(666666)
CMplot(pig60K[,c(1:3,5)], plot.type="m",LOG10=TRUE,col=c("grey30","grey60"),highlight=SNPs,
highlight.col=c("red","blue","green"),highlight.cex=1,highlight.pch=c(15:17), highlight.text=genes,
highlight.text.col=c("red","blue","green"),threshold=0.05/nrow(pig60K),threshold.lty=2,
amplify=FALSE,file="jpg",memo="",dpi=300,file.output=TRUE,verbose=TRUE,width=14,height=6)
Error in CMplot(pig60K[, c(1:3, 5)], plot.type = "m", LOG10 = TRUE, col = c("grey30", :
unused arguments (highlight.text = genes, highlight.text.col = c("red", "blue", "green"))
###########################
Thank you very much!
Best,
Yiming
Hi,
It would be great if you could add in a function to make stratified QQ plots. For instance stratified by bins of info-score (e.g. https://github.com/swvanderlaan/MetaGWASToolKit/blob/master/SCRIPTS/plotter.qq_by_info.R) and minor allele frequency (e.g. https://github.com/swvanderlaan/MetaGWASToolKit/blob/master/SCRIPTS/plotter.qq_by_caf.R). These are great diagnostic tools to review which the best filtering settings are for the data.
Best,
Sander
Hi @YinLiLin ,
I would like to draw a Manhattan Plot to illustrate the distribution of Fst for each chromosome, so the range of y-axis should be set from 0 to 1. when I set the ylim as (0,1), I got this :

However, I wanted to add some scales in this axis, so I added some codes behind the plotting code as below :
And I got this

How can I fix this issue, thanks in advance.
Best Regards,
Yong Jian
In function highlight_text(), I found you use last <<- i rather than last <- i, this may cause unwantted side effect.
during my running, I encounter this error message:
Error in last <<- i : cannot change value of locked binding for 'last'
could you please fix this issue? Thanks
Hi, it seems that the main parameter is not working. Could you please fix it when you get a chance?
Hello,
Much apprecitated for excelltent software.
I get this error when I want to draw a SNP-density plot.
Error in seq.default(0, chorm.maxlen/bp, round(xticks[2])) :
  invalid '(to - from)/by'
My data is
>head(mydata)
   SNP Chromosome Position
1 SNP1          1     4623
2 SNP2          1     4626
3 SNP3          1     4635
4 SNP4          1     4675
5 SNP5          1     4772
6 SNP6          1     4869
And I am using the following code to draw a SNP-density plot.
CMplot(mydata,type="p",plot.type="d",bin.size=1e6,chr.den.col=c("darkgreen", "yellow","red"),file="jpg",memo="",dpi=300, file.output=TRUE,verbose=TRUE,width=9,height=6)
Could you please tell me what goes wrong?
Thanks a lot.
Hi,
Is there an option to make the background of the resultant image transparent?
Best,
A
Hi YinLi
I am wondering why cmplot have such error response. Thanks
   SNP Chromosome Position UKB_BLOOD_BIOMARKER
1    1          1    30600                   1
2    2          1    30610                   1
3    3          1    30620                   1
4    4          1    30630                   1
5    5          1    30640                   1
6    6          1    30650                   1
7    7          1    30660                   1
8    8          1    30670                   1
9    9          1    30680                   1
10  10          1    30690                   1
11  11          1    30700                   1
12  12          1    30710                   1
13  13          1    30720                   1
14  14          1    30730                   1
15  15          1    30740                   1
16  16          1    30750                   1
17  17          1    30760                   1
18  18          1    30770                   1
19  19          1    30780                   1
20  20          1    30790                   1
21  21          1    30800                   1
22  22          1    30810                   1
23  23          1    30820                   1
24  24          1    30830                   1
25  25          1    30840                   1
26  26          1    30850                   1
27  27          1    30860                   1
28  28          1    30870                   1
29  29          1    30880                   1
30  30          1    30890                   1
>   CMplot(input,plot.type="q",box=FALSE,file="jpg",memo=output,dpi=300,conf.int=TRUE,conf.int.col=NULL,threshold.col="red",threshold.lty=3,file.output=TRUE,verbose=TRUE,width=5,height=5)
 QQ Plotting UKB_BLOOD_BIOMARKER.
Error in plot.window(...) : need finite 'xlim' values
In addition: Warning message:
In max(x, na.rm = TRUE) : no non-missing arguments to max; returning -Inf
My raw data's pvalue is range 0.6 to 52, when i set LOG10 =T, the -log10(Pvalue) was range 0 to 30+, i am confused how this package calculated the -log10(Pvalue)...
Hi @YinLiLin,
I found your package very useful, thanks! In my case I'm plotting allele frequency not the p-value but I guess it's also possible... but I'm having an issue I cannot understand (and fix): y-axis repeats its values along it.

This is the code I'm using:
CMplot(df2,plot.type = "c", cir.legend=TRUE, outward=FALSE,cir.legend.col="black",cir.chr.h=0.5,
       chr.den.col="black", cex = 0.3, file.output = F, LOG10 = F)
With the following data:
      GENE X.CHR COORDINATE MM62_MO.VARIANT.FREQUENCY X_P_VARIANT_FREQUENCY PB_VARIANT_FREQUENCY
1    SEPN1     1   26140634                0.41304348             0.5581400            0.2500000
2    SEPN1     1   26142474                0.00000000             0.0839695            0.0680473
3    EXTL1     1   26362852                0.00000000             0.1578950            0.1428570
4    HMGN2     1   26801731                0.06666667             0.0000000            0.0000000
5   ARID1A     1   27107950                0.10638298             0.0597015            0.0517241
6 C1orf172     1   27278045                0.00000000             0.0000000            0.0588235
Any suggestion, please? Thanks in advance!
Hello Lilin,
I performed a density plot using genetic distances, but window size is expressed in Mb, it is possible to change windows units?
Thanks in advance
Maximiliano
First of all, thanks for this nice package
I'm trying to output a stacked Manhattan plot with 3 GWAS summary statistics that have very few SNPs in common (CMplot function). It looks like only the SNPs that are common to the 3 dataset are plotted.
I am missing something? Or is it possible to improve the code to show all SNPs?
Thank you !
Thanks for the great package!
Are there any tricks to exponentially scale the Y axis of Manhaton plot? I have some points with real high y values. With the default settings, points with relatively low y values can hardly seen in the plot. Thanks.
Hi,
Thanks for your excellent package.
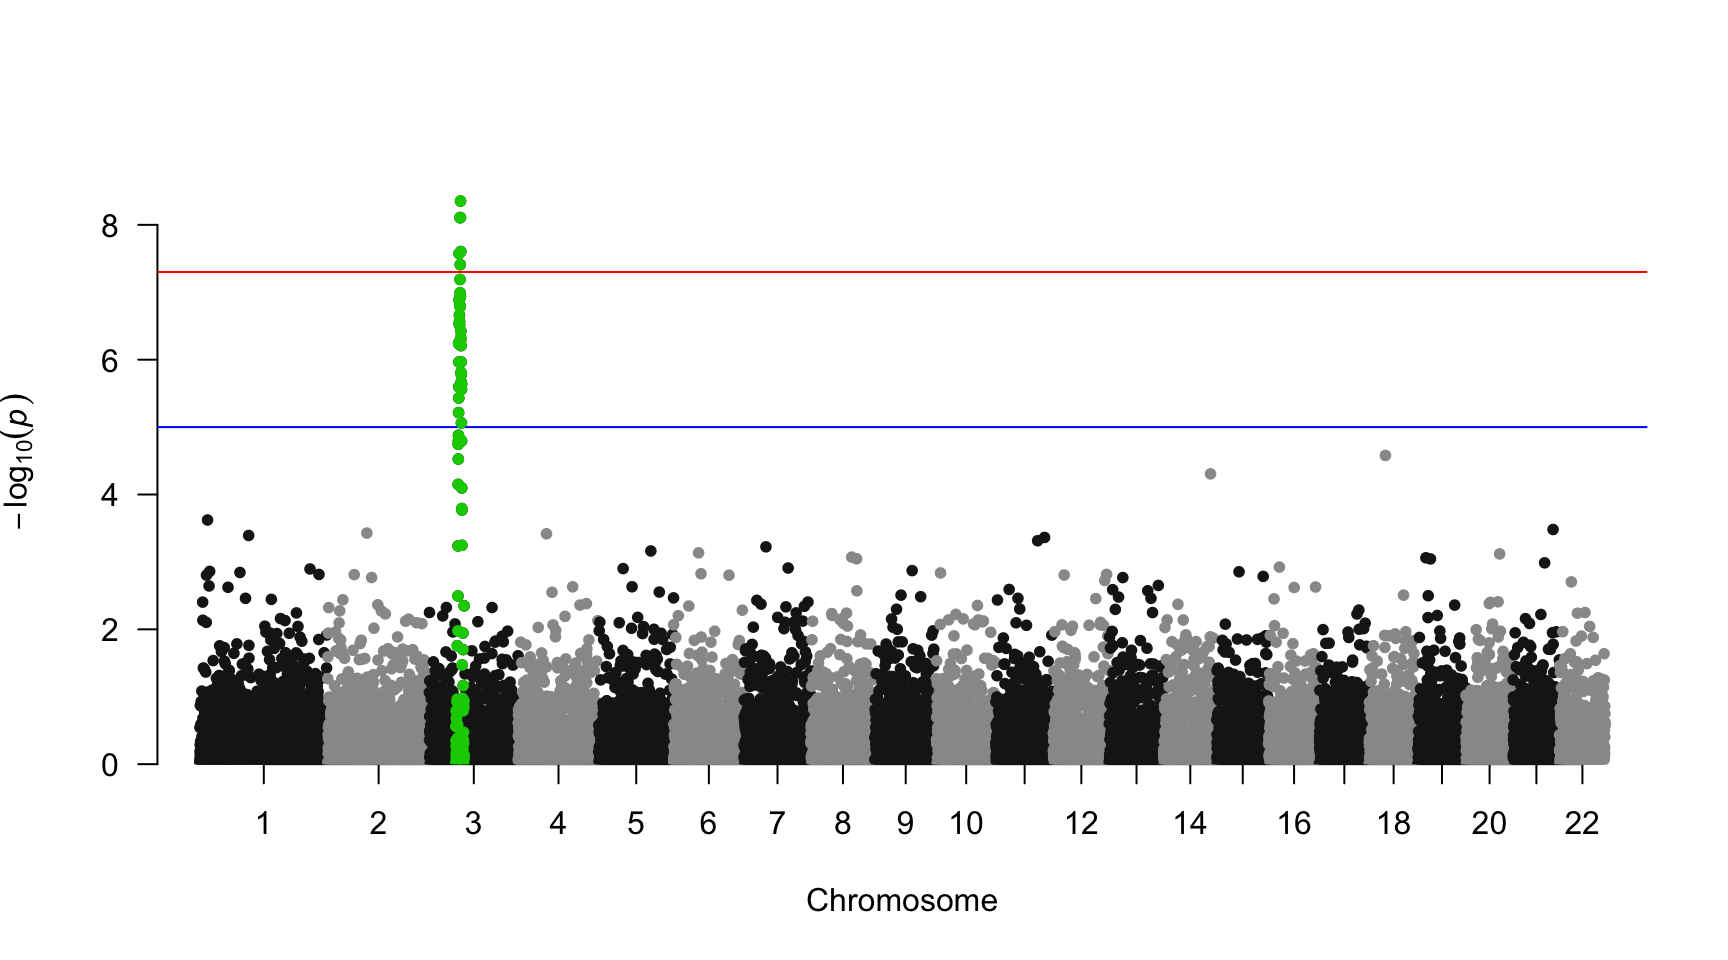
When using the CRAN version I can plot a Manhattan plot for individual chromosomes using:
CMplot(dose[df$CHR==3,],plot.type="m",LOG10=TRUE, highlight.pch=19, file="jpg",memo="CHR3", threshold=c(1.27e-07, 2.18e-5),threshold.lty=c(1,2),threshold.lwd=c(1,2), threshold.col=c("red","blue"),amplify=FALSE,dpi=300,file.output=TRUE,verbose=TRUE)
however when I source the online code I run into the following error:
length of 'chr.labels' should equal to the number of chromosomes.
I would like to use the online code as I would like to use the highlight function to highlight a vector of SNP names, which does not seem to be available in the CRAN version.
Kind Regards,
Alex
May I please know the default unit of width and height in the CMplot function?
CMplot(df_plots_filtered,type="p",plot.type="m",LOG10=TRUE,threshold=5E-08,file="jpg",memo="",dpi=300,
    file.output=TRUE,verbose=TRUE,width=17,height=12,chr.labels.angle=45, cex.axis=2)
I would like to make width as 170mm
Is it possible to add annotation to a multitraits plot? I get the annotations of significant genes in the multi-tracks, but is there a way to also include them in a single figure (and maybe even have the text color of the annotation match the color of the trait)?
This is my current code for 3 traits:
SNPs <- list(
all$SNP[all$T1<1e-6],
all$SNP[all$T2<1e-6],
all$SNP[all$T3<1e-6]
)
CMplot(all, plot.type="m",multracks=TRUE,threshold=c(1e-6,1e-4),threshold.lty=c(1,2),
threshold.lwd=c(1,1), threshold.col=c("black","grey"), amplify=TRUE,bin.size=1e6,
chr.den.col=c("darkgreen", "yellow", "red"), signal.col=NULL, highlight.col=NULL,
signal.cex=1, file="jpg",memo="",dpi=300,file.output=TRUE,verbose=TRUE,
highlight=SNPs, highlight.text=SNPs, highlight.text.cex=1.4)
First thank you for this wonderful tool!
Would it be possible to avoid that the text overlap datapoint of the manhattan plots?
Thanks,
Yann
Hello!
I'm trying to use CMplot and R 3.6.2 to generate SNP density plots, and have noticed that the default colour when SNP density is 0 is light grey.
My tutor feels this colour is not conspicuous or showy enough. Is there a way that I could specify and adjust this default colour? I've failed to find out an arguement to specify this in ?CMplot.
Thank you!
Hello Lilin,
I recently started to use CMplot. It's a great package
I'm trying to make a circular manhattan plot. I can't add legend name (traits) for each circle.
If I write cir.legend=TRUE nothing happens
My entire code is:
`colnames(cmplot3)` <- c("SNP name", "Chr", "Position", "Z49_17A", "Z49_17B", "Z49_17C")
CMplot(cmplot3, plot.type = "c",col=c("grey30","grey60"), dpi = 300,
       threshold=c(1e-3), cir.legend = T,chr.den.col=c("darkgreen","yellow","red"),
       signal.col=c("red"), cir.legend= ,chr.labels=paste("Chr",c(1:7)))
best,
Maximiliano
Hi!
I recently started to use CMplot and it is a great package.
I have some troubles trying to color the different "layers" or circles with separate colors: for exemple I have 3 different association results, so 3 different circles in a same plot. I understand how we can color differently the chromosomes within a same circle but I'd rather color differently the different layer, e.g. alternate grey30 grey60 for the inner circle (one phenotype), blue30 blue60 for the second phenotype, and green30 green60 for a last phenotype.
Would that be possible using CMplot?
Thanks so much!
Jonathan
Hi,
I get this error, when I try to highlight my SNPs:
Error in highlight_text(x = pvalue.posN[highlight_index[[i]]], y = logpvalue[highlight_index[[i]]], :
highlighted genes not equal to the highlighted SNPs.
I have try to do it in some different ways, but I always end up with this error.
head(gwasny)
SNP CHR BP P
1 rs367896724 1 10177 0.3010
2 rs201106462 1 10352 0.1123
3 rs575272151 1 11008 0.3141
4 rs544419019 1 11012 0.3141
5 rs540538026 1 13110 0.8830
6 rs62635286 1 13116 0.5363
SNPss
[1] rs12122629 rs962993 rs12722547 rs10905467 rs7936070 rs970924
[7] rs3001427 rs1689510 rs373277279 rs2180769 rs72743477 rs778984966
[13] rs4787951 rs62026377 rs35311840 rs201389301 rs2412099 rs11406702
[19] rs1106639 rs72836344 rs7567352 rs73203086 rs7618005 rs45613035
[25] rs1837253 rs17622656 rs6865932 rs7705653 rs9270911 rs2428494
[31] rs9272226 rs905671 rs34567668 rs4739737 rs7848215 rs1758599
[37] rs10815279
37 Levels: rs10815279 rs10905467 rs1106639 rs11406702 rs12122629 ... rs970924
enes
[1] "GENE_1" "GENE_2" "GENE_3" "GENE_4" "GENE_5" "GENE_6" "GENE_7"
[8] "GENE_8" "GENE_9" "GENE_10" "GENE_11" "GENE_12" "GENE_13" "GENE_14"
[15] "GENE_15" "GENE_16" "GENE_17" "GENE_18" "GENE_19" "GENE_20" "GENE_21"
[22] "GENE_22" "GENE_23" "GENE_24" "GENE_25" "GENE_26" "GENE_27" "GENE_28"
[29] "GENE_29" "GENE_30" "GENE_31" "GENE_32" "GENE_33" "GENE_34" "GENE_35"
[36] "GENE_36" "GENE_37"
CMplot(gwasny, plot.type="m",LOG10=TRUE,col=c("grey30","grey60"),highlight=SNPss,
Error in highlight_text(x = pvalue.posN[highlight_index[[i]]], y = logpvalue[highlight_index[[i]]], :
highlighted genes not equal to the highlighted SNPs
Best Line
Hi,
Regarding the highlight script given in the manual:
SNPs <- pig60K$SNP[pig60K$Chromosome==13 &
pig60K$Position<(signal+1000000)&pig60K$Position>(signal-1000000)]
Can it be more than 1 chromosome? I have SNPs to be highlighted on 3 different chromosomes. How should I write the command?
Also, what does signal+/-1000000 mean?
Hi!
I'm trying to make a circular manhattan plot with all the SNPs denoted in black while I want to highlight only few SNPs in another color. Something like this (https://user-images.githubusercontent.com/8700495/53948750-300cd280-40d1-11e9-9363-8eb15b7f91e7.png) but circular. Is that possible using CMplot?
Thanks for the awesome tool!
Hello YinLiLin,
Thank you very much for this function.
I have two questions concerning the highlighting of SNPs.
Is it possible to add names to certain SNPs without changing their colour? Of course, I could manually write the chromosome colour to the highlight.col vector but is their a way to do this automatically without having to look up the chromosome colour of each SNP first?
I'd like to plot 3 traits with multracks in separate axes and label/highlight the lead SNPs of each trait, i.e. I need separate highlight vectors for each trait. Is that possible?
Thank you :)
Thanks for the great package!! Is there a way to increase the size of the title font? Thanks a lot!
I had the issue with
Error in last <<- i : cannot change value of locked binding for 'last'
And, then as suggested to use the github version, I got another issue
Error in [.data.table(Pmap, Pmap[, 2] != "0", ) :
i is invalid type (matrix). Perhaps in future a 2 column matrix could return a list of elements of DT (in the spirit of A[B] in FAQ 2.14). Please report to data.table issue tracker if you'd like this, or add your comments to FR #657.
The main function, highlight.type are all borken.
Thank you for the great tool. I apologize if I missed it, but can the location of the legend be changed? My SNPs of interest fall in the same location as the legend. Thanks.
hi dr yin,
Thank you very much for this amazing plot. it is fantastic. I'd like to improve on what I'm creating plot. I'm running into two issues at the moment while creating Circular plot.
I'd like to improve on following things:
I believe both these either increase and/or increase together
I'm creating plot as:
 CMplot(df,type="p",plot.type="c",chr.labels=paste("Chr",c(1:22),sep=""),
 r=0.4, ##radius
 cir.legend=TRUE,
        outward=FALSE,
        cir.legend.col="black",
        cir.chr.h=1.3,
        chr.den.col="black",
        file="jpg",
        memo="",
        dpi=300,
        file.output=TRUE,
        verbose=TRUE,
        width=20,
        LOG10=TRUE,
        threshold=(0.05/400),
        amplify=FALSE, ## don't amplify significant SNP
        signal.line=1.2,
        box=TRUE,
	 	H=6,
	 	 threshold.col="red",
        height=15,
        cex.axis=1,
        threshold.lwd=1.8,
        chr.labels.angle=45,
        main="Model 1",
         main.cex=1.5, main.font=2 )
Session info are below:
R version 3.6.3 (2020-02-29)
Platform: x86_64-apple-darwin18.2.0 (64-bit)
Running under: macOS Mojave 10.14.1

locale:
[1] en_US.UTF-8/en_US.UTF-8/en_US.UTF-8/C/en_US.UTF-8/en_US.UTF-8

attached base packages:
[1] stats     graphics  grDevices utils     datasets  methods   base

other attached packages:
[1] CMplot_3.6.0  Cairo_1.5-11  ggplot2_3.3.0

loaded via a namespace (and not attached):
 [1] Rcpp_1.0.3       digest_0.6.25    withr_2.1.2      crayon_1.3.4
 [5] dplyr_0.8.5      assertthat_0.2.1 MASS_7.3-51.5    grid_3.6.3
 [9] R6_2.4.1         lifecycle_0.2.0  gtable_0.3.0     magrittr_1.5
[13] scales_1.1.0     pillar_1.4.3     rlang_0.4.5      farver_2.0.3
[17] labeling_0.3     tools_3.6.3      glue_1.3.1       purrr_0.3.3
[21] munsell_0.5.0    compiler_3.6.3   pkgconfig_2.0.3  colorspace_1.4-1
[25] tcltk_3.6.3      tidyselect_1.0.0 tibble_2.1.3
thanks
Hi!
Thanks for your great work, making circular manhattan plotting both easy and efficient (also enabling miami-like manhattan plots).
A great feature to consider including to the next release would be (for both multi/single track circular manhattan) a possibility to add gene labels AROUND the cm-plot like is done in the FUJI-plot. I have not figured out a way to do this in the present version.
Best,
Tuomo Kiiskinen, MD
Hi,
First, I would like to thank you for this nice package.
I am wondering that can I give a genomic interval coordinate like chr5:565622-565650 instead of an exact genomic coordinate like chr5:565622 to draw the SNP-density plot?
Thanks.
Best wishes.
Is there a way to change the diagonal color from red in the QQ plot?
Thanks, Brad
A declarative, efficient, and flexible JavaScript library for building user interfaces.
🖖 Vue.js is a progressive, incrementally-adoptable JavaScript framework for building UI on the web.
TypeScript is a superset of JavaScript that compiles to clean JavaScript output.
An Open Source Machine Learning Framework for Everyone
The Web framework for perfectionists with deadlines.
A PHP framework for web artisans
Bring data to life with SVG, Canvas and HTML. 📊📈🎉
JavaScript (JS) is a lightweight interpreted programming language with first-class functions.
Some thing interesting about web. New door for the world.
A server is a program made to process requests and deliver data to clients.
Machine learning is a way of modeling and interpreting data that allows a piece of software to respond intelligently.
Some thing interesting about visualization, use data art
Some thing interesting about game, make everyone happy.
We are working to build community through open source technology. NB: members must have two-factor auth.
Open source projects and samples from Microsoft.
Google ❤️ Open Source for everyone.
Alibaba Open Source for everyone
Data-Driven Documents codes.
China tencent open source team.