Code Monkey home page Code Monkey logo

sartools's Introduction

SARTools

SARTools is a R package dedicated to the differential analysis of RNA-seq data. It provides tools to generate descriptive and diagnostic graphs, to run the differential analysis with one of the well known DESeq2 or edgeR packages and to export the results into easily readable tab-delimited files. It also facilitates the generation of a HTML report which displays all the figures produced, explains the statistical methods and gives the results of the differential analysis. Note that SARTools does not intend to replace DESeq2 or edgeR: it simply provides an environment to go with them. For more details about the methodology behind DESeq2 or edgeR, the user should read their documentations and papers.

SARTools is distributed with two R script templates (template_script_DESeq2.r and template_script_edgeR.r) which use functions of the package. For a more fluid analysis and to avoid possible bugs when creating the final HTML report, the user is encouraged to use them rather than writing a new script. Two other scripts are available (template_script_DESeq2_CL.r and template_script_edgeR_CL.r) to run SARTools in a shell with the Rscript command. In that case, the optparse R package must be available to interpret the command line parameters.

How to install SARTools?

Within R

In addition to the SARTools package itself, the workflow requires the installation of several packages: DESeq2, edgeR, genefilter, xtable and knitr (all available online, see the dedicated webpages). SARTools needs R version 3.3.0 or higher, DESeq2 1.12.0 or higher and edgeR 3.12.0 or higher: old versions of DESeq2 or edgeR may be incompatible with SARTools.

To install the SARTools package from GitHub, open a R session and:

  • Install devtools with install.packages("devtools") (if not installed yet)

  • Notes:

    • Ubuntu users may have to install some libraries (libxml2-dev, libcurl4-openssl-dev and libssl-dev) to be able to install DESeq2 and devtools
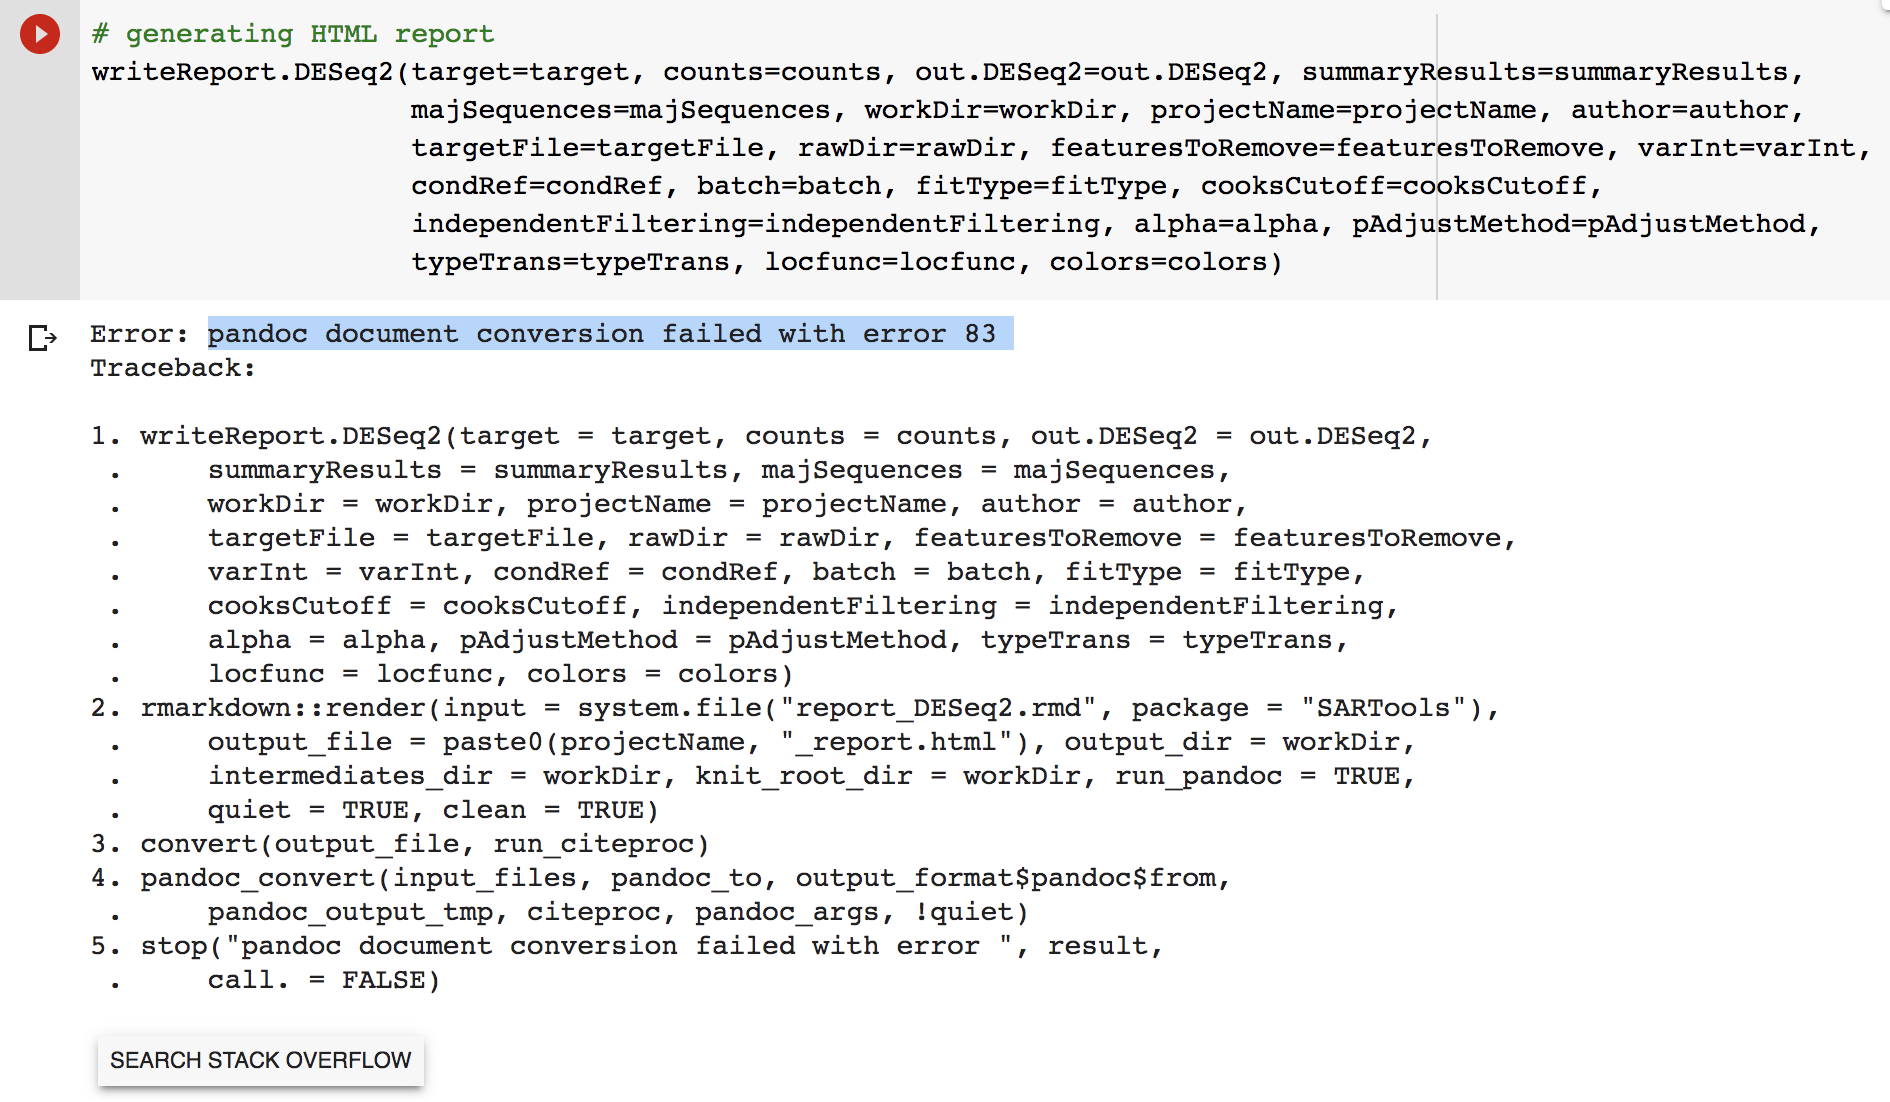
    • Some users may have to install the pandoc and pandoc-citeproc libraries to be able to generate the final HTML reports
  • For Windows users only, install Rtools or check that it is already installed (needed to build the package)

  • Run devtools::install_github("PF2-pasteur-fr/SARTools", build_opts="--no-resave-data")

Using Conda

install with bioconda

  1. Install miniconda
  2. Install the SARTools R library and its dependencies using conda conda install r-sartools

Note: if you want to set a dedicated conda environment for SARTools, use conda create -n sartools r-sartools and follow the instructions to activate it.

How to use SARTools?

A HTML vignette is available within the vignettes folder on GitHub and provides extensive information on the use of SARTools. The user can also open it with vignette("SARTools") if it has been generated during the installation of the package. Note that it is not available when SARTools has been installed using conda.

An online version of SARTools is available in this Google Colaboratory notebook: https://colab.research.google.com/drive/1hoPcImQkct0yPz5nnYcJFOOX9O0EHjtB?usp=sharing

Be careful to use the R script associated with the version of SARTools installed on your system.

Please read the NEWS file to see the latest improvements!

About SARTools

The SARTools package has been developped at PF2 - Institut Pasteur by M.-A. Dillies and H. Varet ([email protected]). Thanks to cite H. Varet, L. Brillet-Guéguen, J.-Y. Coppee and M.-A. Dillies, SARTools: A DESeq2- and EdgeR-Based R Pipeline for Comprehensive Differential Analysis of RNA-Seq Data, PLoS One, 2016, doi: http://dx.doi.org/10.1371/journal.pone.0157022 when using this tool for any analysis published.

sartools's People

Contributors

hvaret avatar lecorguille avatar loraine-gueguen avatar makethebrainhappy avatar scottdaniel avatar

Stargazers

 avatar  avatar  avatar  avatar  avatar  avatar  avatar  avatar  avatar  avatar  avatar  avatar  avatar  avatar  avatar  avatar  avatar  avatar  avatar  avatar  avatar  avatar  avatar  avatar  avatar  avatar  avatar  avatar  avatar  avatar  avatar  avatar  avatar  avatar  avatar  avatar  avatar  avatar  avatar  avatar  avatar  avatar  avatar  avatar  avatar  avatar  avatar  avatar  avatar  avatar  avatar  avatar  avatar  avatar  avatar  avatar  avatar  avatar  avatar  avatar  avatar  avatar  avatar  avatar  avatar  avatar  avatar  avatar  avatar  avatar  avatar  avatar  avatar  avatar  avatar  avatar  avatar  avatar  avatar  avatar  avatar  avatar  avatar  avatar  avatar  avatar  avatar  avatar  avatar  avatar  avatar  avatar  avatar  avatar  avatar  avatar  avatar  avatar  avatar  avatar

Watchers

 avatar  avatar  avatar  avatar  avatar  avatar  avatar

sartools's Issues

How could I obtain homoscedastic normalized counts from SARtools ?

Hello,
I would like to export the homoscedastic normalized counts obtained from SARtools to perform other multidimensional analysis. Could you please indicate to me how I can obtain them ?
I thank you a lot for this information.
Kind regards
Stéphanie (from Roscoff)

error in statistics tables

Hello !

I have a problem with my statistics tables obtained after running SARTools with DESeq2 package.
The calculations made in FoldChange and log2FoldChange fields seem incorrect.

Here an entry for example :

Id : YAL002W
s1-condA : 17
s2-condA : 23
s3-condB : 35
s4-condB : 45
norm.s1-condA : 26
norm.s2-condA : 28
norm.s3-condB : 28
norm.s4-condB : 29
baseMean : 27.91
condA : 27
condB : 28
FoldChange : 1.01
log2FoldChange : 0.015

pvalue : 0.885040513937845
padj : 0.999879379281527
dispGeneEst : 0
dispFit : 0.099
dispMAP : 0.083
dispersion : 0.083
betaConv : TRUE
maxCooks : NA

My condition of reference is condA.

If I'm correct, FoldChange = 28/27= 1,037037037 --> around to 1.04. Here we have 1.01 instead.
And log2FoldChange = log2(1,037037037) = 0,052467 --> around to 0.052. Here we have 0.015 instead.

I want to know if there's an explanation for this inconsistency. Because if there's an error, so pvalue and padj could be questioned too...

Thanks,
Alexandra

descriptionPlots error due to tabSERE/SERE code

Hi there,

I experience an issue "Error in [.data.frame(fullObserved, fullKeep) : undefined columns selected" when running desriptionPlots. I traced it down to tabSERE and then SERE code at the perason chisq test:

oeFull <- (fullObserved[fullKeep] - fullExpected[fullKeep])^2/ fullExpected[fullKeep] # pearson chisq test

I have fullKeep like 24 thousand entries and fullObserved has only 12 thousand rows and 2 columns. fullObserved[fullKeep] looks for 24 thousand columns that fullObserved does not have. Can you please comment on that? Do you think have a different issue, not the SERE problem?

Thanks,
Seda

ERROR: dependency ‘SummarizedExperiment’ is not available for package ‘SARTools’

Hello,

I tried to follow this page to install SARTools : https://github.com/PF2-pasteur-fr/SARTools
Unfortunately when I use the command
install_github("PF2-pasteur-fr/SARTools", build_vignettes=TRUE)
I have this error :

> install_github("PF2-pasteur-fr/SARTools", build_vignettes=TRUE)
Downloading GitHub repo PF2-pasteur-fr/SARTools@master
from URL https://api.github.com/repos/PF2-pasteur-fr/SARTools/zipball/master
Installing SARTools
Skipping 6 unavailable packages: DESeq2, edgeR, genefilter, limma, S4Vectors, SummarizedExperiment
'/usr/local/lib/R/bin/R' --no-site-file --no-environ --no-save --no-restore  \
  --quiet CMD build  \
  '/tmp/RtmpJ7wBu4/devtools88df2ee25c/PF2-pasteur-fr-SARTools-94bd77b'  \
  --no-resave-data --no-manual 

* checking for file ‘/tmp/RtmpJ7wBu4/devtools88df2ee25c/PF2-pasteur-fr-SARTools-94bd77b/DESCRIPTION’ ... OK
* preparing ‘SARTools’:
* checking DESCRIPTION meta-information ... OK
* installing the package to build vignettes
      -----------------------------------
ERROR: dependency ‘SummarizedExperiment’ is not available for package ‘SARTools’
* removing ‘/tmp/RtmpQsrp0H/Rinst93a8774d3f7b/SARTools’
      -----------------------------------
ERROR: package installation failed
Error: Command failed (1)

It looks like it does not find the previously installed DESeq2, edgeR and genefilter package, but also other packages such as SummarizedExperiment. So it makes the installation fail.

Could you please help me to install Sartools ? I am trying to install it under debian 8.

Thank you.

add limma and voom into SARTools

Hi hvaret,

SARTools is very useful.
But how to add limma and voom into SARTools ?

template_script_DESeq2.r and template_script_edgeR.r are available,
if template_script_limmaVoom.r is also available, SARTools will be perfect.

Thank you.

RSEM file format

Hi.

I did wanted to use the executable template for DESeq2 "template_script_DESeq2_CL.r" on RNA-seq data from a TGCA cohort. The files are in RSEM count, and I get the following :

Error in loadCountData(target = target, rawDir = rawDir, featuresToRemove = featuresToRemove) :
Input counts are not integer values as required by DESeq2 and edgeR.

Or the maintenor of the package DESeq2 tell himself that this format is supported by the DESeq2 library here https://support.bioconductor.org/p/91054/ , and there is a pipeline to pass RSEM file to DESeq2 as shown here : https://bioconductor.org/packages/devel/bioc/vignettes/tximport/inst/doc/tximport.html

Is there a way to override this warning ? (which stop the script)

figure format and size

Figure format should be costumizable and size also

The images are too small at 400x400

also format of the image output could be pdf or other vector based format.

Error edgeR : exploreCounts, SARTools release 1.7.4

Hi Hugo,

I have an issue using edgeR via sartools. I get that error message when running the following command:
exploreCounts(object=out.edgeR$dge, group=target[,varInt], gene.selection=gene.selection, col=colors)

The error message is:

Don't know how to automatically pick scale for object of type function. Defaulting to continuous.
Error: Aesthetics must be valid data columns. Problematic aesthetic(s): label = sample.
Did you mistype the name of a data column or forget to add after_stat()?
Backtrace:
     █
  1. └─SARTools::exploreCounts(...)
  2.   └─SARTools::MDSPlot(...)
  3.     ├─base::print(...)
  4.     └─ggplot2:::print.ggplot(...)
  5.       ├─ggplot2::ggplot_build(x)
  6.       └─ggplot2:::ggplot_build.ggplot(x)
  7.         └─ggplot2:::by_layer(function(l, d) l$compute_aesthetics(d, plot))
  8.           └─ggplot2:::f(l = layers[[i]], d = data[[i]])
  9.             └─l$compute_aesthetics(d, plot)
 10.               └─ggplot2:::f(..., self = self)
Execution halted

The column names I use in target.txt are 'label', 'files' and 'group'. I don't have any error when running DESeq2 with the same parameters.

Do you know where could that error come from?

Thank you in advance,

Marie-Joe

levels that contain "/"

If a level of the varInt factor contains the character "/" SARTools fail while writing the html results.

2 time points and no other condition

I have 9 biological replicates where RNA was sequenced at 2 times points (Day 8 and 20). There are no other conditions.
My samples look like this:

D8Bird1
D8Bird2
...
D8Bird9
D20Bird1
....
Day20Bird9

I want to look at differential expression between the two time points. Do I simply treat each time point as a condition?

"The factor of interest group has a level without replicates"

Hi,

Is it possible to compare 2 conditions without having replicates?

My target.txt:

label    files    group
sample1_cond1    s1_c1_target.txt    CONDITION1
sample1_cond2    s1_c2_target.txt    CONDITION2

When running SARTools I get:

[1] "All the parameters are correct"
Error in loadTargetFile(targetFile = targetFile, varInt = varInt, condRef = condRef,  : 
  The factor of interest group has a level without replicates
Execution halted

What am I doing wrong?

Thanks !

New normalization methods

Hi,

I wondered whether it is possible to add the new normalization methods described Li et al., 2017 to SARTools? This paper describes two new normalization methods to be used in combination with edgeR, that might perform better for RNA-seq data skewed towards lowly expressed read counts with high variation.

Complete reference: Li, X., Brock, G. N., Rouchka, E. C., Cooper, N. G., Wu, D., O’Toole, T. E., ... & Rai, S. N. (2017). A comparison of per sample global scaling and per gene normalization methods for differential expression analysis of RNA-seq data. PloS one, 12(5), e0176185.

Error in loadCountData - release 1.7.3

Hi Hugo,

A user has the following error (within galaxy).
It seems that there is a problem in the if condition here : https://github.com/PF2-pasteur-fr/SARTools/blob/master/R/loadCountData.R#L64
Do you know how to solve that ?
Cheers,
Loraine

    ----------------------------------------------
    Welcome to SARTools version 1.7.3.
    R template scripts are available on GitHub.
    ----------------------------------------------
There were 13 warnings (use warnings() to see them)
[1] "All the parameters are correct"
Target file:
          label              files group
Mock_M2 Mock_M2 dataset_928292.dat  Mock
Mock_M3 Mock_M3 dataset_928293.dat  Mock
Mock_M4 Mock_M4 dataset_928294.dat  Mock
CaMV_C1 CaMV_C1 dataset_928295.dat  CaMV
CaMV_C2 CaMV_C2 dataset_928296.dat  CaMV
CaMV_C3 CaMV_C3 dataset_928297.dat  CaMV
TuYV_T1 TuYV_T1 dataset_928298.dat  TuYV
TuYV_T2 TuYV_T2 dataset_928299.dat  TuYV
TuYV_T3 TuYV_T3 dataset_928300.dat  TuYV
Loading files:
dataset_928292.dat: 27656 rows and 5660 null count(s)
dataset_928293.dat: 27656 rows and 5715 null count(s)
dataset_928294.dat: 27656 rows and 6050 null count(s)
dataset_928295.dat: 27656 rows and 5440 null count(s)
dataset_928296.dat: 27656 rows and 5581 null count(s)
dataset_928297.dat: 27656 rows and 5539 null count(s)
dataset_928298.dat: 27656 rows and 5818 null count(s)
dataset_928299.dat: 27656 rows and 5614 null count(s)
dataset_928300.dat: 27656 rows and 5810 null count(s)
Error in counts%%1 : non-numeric argument to binary operator
Calls: loadCountData
Execution halted

update the conda repo?

Hi,

Could you update the bioconda repository so that the latest changes can be gotten from there? In my environment its much easier to do conda install -y -c bioconda r-sartools

SamSeq, Limma and NoiSeq

This is quite a handy package. Do you plan to add other packages such as SamSeq, Limma and NoiSeq?

Error in checkSlotAssignment (DESeq2)

Hi,
I have an error when I'm in this step in the DESeq2 template:

out.DESeq2 <- run.DESeq2(counts=counts, target=target, varInt=varInt, batch=batch,

  •                      locfunc=locfunc, fitType=fitType, pAdjustMethod=pAdjustMethod,
    
  •                      cooksCutoff=cooksCutoff, independentFiltering=independentFiltering, alpha=alpha)
    

Error in checkSlotAssignment(object, name, value) :
assignment of an object of class “GRangesList” is not valid for slot ‘rowRanges’ in an object of class “DESeqDataSet”; is(value, "GenomicRangesORGRangesList") is not TRUE

Can you have an idea why ?

PS: I download SARTools with Conda

report generated

In the report you write: "Reads that map on multiple locations on the transcriptome are counted more than once".

How do you know this?
Can you only work with alignments that have been mapped to the transcriptome?

LFC shrinkage

--Hi,

why you don't use the new function lfcShrink() released in DESeq2 ?
sequencing datasets show better performance using this function such as: res <- lfcShrink(dds, coef=2, type="apeglm")

thank you --

Plot size figures

Hello,

I would like to change the plot size made by SARTools, is it possible to set font size and size of plot before saving the figures ?

Thank you

getopt error: redundant short names

in file template_script_edgeR_CL.r, short name "-g" is used twice: once on line 69, and again on line 84.

Rscript template_script_edgeR_CL.r --targetFile target.tsv --rawDir ../. --condRef "CT"

fails with ...

Error in getopt(spec = spec, opt = args) : 
  redundant short names for flags (column 2 of spec matrix).
Calls: parse_args -> getopt
Execution halted

editing "-g" on line 84 to "-g2" resolves the conflict and error.

warnings

Hi There,
Thank you for this amazing tool you have created for RNAseq data analysis. I just want to bring to your attention a few warnings I noticed. I don't believe this might have resulted in any issues with the data analysis:
After the step:
exploreCounts(object=out.DESeq2$dds, group=target[,varInt], typeTrans=typeTrans, col=colors)

I get this:

Scale for 'y' is already present. Adding another scale for 'y', which will
replace the existing scale.
null device
1
Warning message:
expand_scale() is deprecated; use expansion() instead.

When I use the code:

warnings()
Warning messages:
1: expand_scale() is deprecated; use expansion() instead.
2: expand_scale() is deprecated; use expansion() instead.
3: expand_scale() is deprecated; use expansion() instead.
4: expand_scale() is deprecated; use expansion() instead.
5: expand_scale() is deprecated; use expansion() instead.
6: expand_scale() is deprecated; use expansion() instead.
7: expand_scale() is deprecated; use expansion() instead.
8: expand_scale() is deprecated; use expansion() instead.
9: expand_scale() is deprecated; use expansion() instead.
10: expand_scale() is deprecated; use expansion() instead.
11: expand_scale() is deprecated; use expansion() instead.
12: expand_scale() is deprecated; use expansion() instead.
13: expand_scale() is deprecated; use expansion() instead.
14: expand_scale() is deprecated; use expansion() instead.
15: expand_scale() is deprecated; use expansion() instead.
16: expand_scale() is deprecated; use expansion() instead.
17: expand_scale() is deprecated; use expansion() instead.
18: expand_scale() is deprecated; use expansion() instead.
19: expand_scale() is deprecated; use expansion() instead.
20: expand_scale() is deprecated; use expansion() instead.
21: expand_scale() is deprecated; use expansion() instead.
22: expand_scale() is deprecated; use expansion() instead.
23: expand_scale() is deprecated; use expansion() instead.
24: expand_scale() is deprecated; use expansion() instead.
25: expand_scale() is deprecated; use expansion() instead.
26: expand_scale() is deprecated; use expansion() instead.
27: expand_scale() is deprecated; use expansion() instead.
28: expand_scale() is deprecated; use expansion() instead.
29: expand_scale() is deprecated; use expansion() instead.
30: expand_scale() is deprecated; use expansion() instead.
31: expand_scale() is deprecated; use expansion() instead.
32: expand_scale() is deprecated; use expansion() instead.
33: expand_scale() is deprecated; use expansion() instead.
34: expand_scale() is deprecated; use expansion() instead.
35: expand_scale() is deprecated; use expansion() instead.

Below is my session info:

sessionInfo()
**R version 3.6.3 (2020-02-29)
Platform: x86_64-w64-mingw32/x64 (64-bit)
Running under: Windows 10 x64 (build 17763)

Matrix products: default

locale:
[1] LC_COLLATE=English_United States.1252 LC_CTYPE=English_United States.1252
[3] LC_MONETARY=English_United States.1252 LC_NUMERIC=C
[5] LC_TIME=English_United States.1252

attached base packages:
[1] parallel stats4 stats graphics grDevices utils datasets methods
[9] base

other attached packages:
[1] SARTools_1.7.2 kableExtra_1.1.0
[3] ggplot2_3.3.0 edgeR_3.28.1
[5] limma_3.42.2 DESeq2_1.26.0
[7] SummarizedExperiment_1.16.1 DelayedArray_0.12.3
[9] BiocParallel_1.20.1 matrixStats_0.56.0
[11] Biobase_2.46.0 GenomicRanges_1.38.0
[13] GenomeInfoDb_1.22.1 IRanges_2.20.2
[15] S4Vectors_0.24.4 BiocGenerics_0.32.0

loaded via a namespace (and not attached):
[1] bitops_1.0-6 bit64_0.9-7 webshot_0.5.2
[4] RColorBrewer_1.1-2 httr_1.4.1 tools_3.6.3
[7] backports_1.1.6 R6_2.4.1 rpart_4.1-15
[10] Hmisc_4.4-0 DBI_1.1.0 colorspace_1.4-1
[13] nnet_7.3-13 withr_2.1.2 GGally_1.5.0
[16] gridExtra_2.3 bit_1.1-15.2 compiler_3.6.3
[19] cli_2.0.2 rvest_0.3.5 htmlTable_1.13.3
[22] xml2_1.3.1 ggdendro_0.1-20 labeling_0.3
[25] scales_1.1.0 checkmate_2.0.0 readr_1.3.1
[28] genefilter_1.68.0 stringr_1.4.0 digest_0.6.25
[31] foreign_0.8-76 rmarkdown_2.1 XVector_0.26.0
[34] base64enc_0.1-3 jpeg_0.1-8.1 pkgconfig_2.0.3
[37] htmltools_0.4.0 highr_0.8 htmlwidgets_1.5.1
[40] rlang_0.4.5 rstudioapi_0.11 RSQLite_2.2.0
[43] farver_2.0.3 acepack_1.4.1 RCurl_1.98-1.1
[46] magrittr_1.5 GenomeInfoDbData_1.2.2 Formula_1.2-3
[49] Matrix_1.2-18 Rcpp_1.0.4.6 munsell_0.5.0
[52] fansi_0.4.1 lifecycle_0.2.0 yaml_2.2.1
[55] stringi_1.4.6 MASS_7.3-51.5 zlibbioc_1.32.0
[58] plyr_1.8.6 grid_3.6.3 blob_1.2.1
[61] ggrepel_0.8.2 crayon_1.3.4 lattice_0.20-41
[64] splines_3.6.3 annotate_1.64.0 hms_0.5.3
[67] locfit_1.5-9.4 knitr_1.28 pillar_1.4.3
[70] geneplotter_1.64.0 XML_3.99-0.3 glue_1.4.0
[73] evaluate_0.14 latticeExtra_0.6-29 data.table_1.12.8
[76] png_0.1-7 vctrs_0.2.4 gtable_0.3.0
[79] reshape_0.8.8 assertthat_0.2.1 xfun_0.13
[82] xtable_1.8-4 survival_3.1-12 viridisLite_0.3.0
[85] tibble_3.0.0 AnnotationDbi_1.48.0 memoise_1.1.0
[88] cluster_2.1.0 ellipsis_0.3.0**

Gene lenght corrected value

Hi, I love using SARTools. I wonder if it is possible to use it with the GeTMM (Gene leght corrected trimmed mean of M-values) function, that allows both intersample and intrasample comparison (see: https://bmcbioinformatics.biomedcentral.com/articles/10.1186/s12859-018-2246-7). If yes, could you tell me the code I should use in my script to choose this option. What do you think about the possibility of dividing the counts normalized by DEseq2 by the gene size to make intrasample gene expression comparisons. I thank you by advance for your help. All the best.

Manual limits on MA plot and Volcano plot

In my branch of SARTools I have also added an optional feature to both summarizeResults.DESeq2.r and summarizeResults.edgeR.r. This feature allows the manual setting of the ylim for the MA plot and the Volcano plot using the parameters FClimit and adjPlimit. If these parameters are not used, the behavior is identical to the current functions.

This feature is designed to solve two problems. (1) When you want to compare MA plots between similar analyses. (2) The volcano plot looks very ugly when the p-values are high for a given analysis.

Sartools normalization vs DESeq2 normalization with multiple groups

Hi Hugo, I have performed the comparison for six groups (at the same time) both with Sartools and DESeq2 manually. When I obtain the normalized counts (the table) I observe counts are different in both programs. However, if I took only two groups (G1 vs G2) and I perform with both programs (Sartools and DESeq2) normalized counts are exactly the same. My question is: is Sartools normalizing raw counts with additional factors than DESeq does when are several groups? I would appreciate your help.

maría

testing multiple factors

In the example template, the code is designed for one factor with 2 to 4 levels.
~group (control, treatment)
but if I have more factors, say tissue or family, how do I do it?
~group+tissue+family
(control, treatment)
(a,b)
(1,2,3)

Error in loadTargetFile

Hello,
I have an error when I'm in this step in the template of DESeq2:
target <- loadTargetFile(targetFile=targetFile, varInt=varInt, condRef=condRef, batch=batch)
Error in loadTargetFile(targetFile = targetFile, varInt = varInt, condRef = condRef, : The factor of interest NPC is not in the target file

And my target file (separated by tab) is:

labels file group
iPSC1 ae_HIPSC_ipscbam1.txt iPSC
iPSC2 ae_HIPSC_ipscbam2.txt iPSC
NPC1 ae_HIPSC_npcbam1.txt NPC
NPC2 ae_HIPSC_npcbam2.txt NPC

I don't know what's wrong, can you help me please?

Issue with pairwiseScatterPlots

majSequences <- descriptionPlots(counts=counts, group=target[,varInt], col=colors)
Error in png(filename = "figures/pairwiseScatter.png", width = 800 * ncol,  : 
  unable to start png() device
In addition: Warning messages:
1: In png(filename = "figures/pairwiseScatter.png", width = 800 * ncol,  :
  unable to allocate bitmap
2: In png(filename = "figures/pairwiseScatter.png", width = 800 * ncol,  :
  opening device failed

The figure is not plotted but everything else works. png() works normally for me. When sourcing the whole template file, the code breaks at this point due to this error. But if I manually run blocks of code, the whole analysis reaches completion.

edgeR error “arguments imply differing number of rows: 2, 15, 1” after explorecounts

Hello,
I’m fairly new with R and RNA-seq analysis in general. I apologize in advance if this is an inappropriate place to post my issue.

I am currently running a differential expression analysis using both DESeq2 and edgeR, I really like the reports generated by SARTools. I have managed to successfully run DESeq2, however, I encountered an error when running edgeR on the same input files. It happens after the explorecounts function and gives the message “arguments imply differing number of rows: 2, 15, 1”.

To give a bit of context about my input files, I’m doing differential expression analysis across 5 groups, each with a total of three replicates. The input data consists of fifteen samples of raw counts as a tabular file.
I appreciate any guidance on this matter. Thanks.

Adjust font size

Hi there!
Is it possible to adjust the font size in the plots? Specifically I would like to change the font size in the Pairewise scatter plot. As you can see, the labels are too large for the boxes. How do I access the source code for the image?
pairwisefontproblem

More flexible input formats

I have forked the repo to add a feature that I have long desired in SARTools. My plan is to provide flexibility in input formats without changing the default behavior for beginner users.

I have added two new parameters for loadCountData: idColumn and countColumn. The defaults will be 1 and 2 (assuming data like htseq-count). If users want to provide other input, like featurecounts or the output from Kallisto or Salmon, they they will have to tell SARTools where to find the count column.

I have also added a step in loadCountData to round off the counts to integers (instead of just stopping with an error). This is very helpful for anyone providing RSEM, Kallisto, or Salmon counts files.

I hope that you find this helpful and will consider incorporating it into the next version.

unable to install SARTools via conda with optparse

Hi, since I'm incorporating your scripts into a command-line pipeline, I need the r-optparse library as part of my environment. Both of these commands fail:
conda install -c bioconda r-optparse r-sartools=1.6.3
and
conda install -c conda-forge r-optparse; conda install -c bioconda r-sartools=1.6.3

They both give the error:

UnsatisfiableError: The following specifications were found to be in conflict:
  - r-sartools=1.6.3

Any ideas? p.s. I'm building this as part of a singularity container for future-compatibility so I attached my full [Build spec] in case you want to take a look at my full setup
image.txt

Also tried installing into a completely new environment:
conda create -n sartools r-sartools=1.6.3

possibility of using other inputs

It would be nice to have other options of supplying the data. I.e. the IonTorrent technologies provide one file with all the counts for all experiments per chip. I now have to separate them into individual files, which boils down to a lot of code around formatting of data that is unnecessary, also the problem of the factors being a number could be avoided if I could use data frames as input (just like DESeq2)...

plot labels by batch, not sample name, then rely on colour to determine specific sample (condition)

Hi there
My samples are named by condition+batch, but even though the names are quite short, only 4 or 5 letters, the plots get quite messy.
I'd also like to have simpler, cleaner axis labels without repeating condition info, which I can represent with an annotation.

As an example, I have two conditions, Day 1 and Day 2, and 10 bio-replicates, 1-10. So my samples are named D1B1, D2B1, ........... D1B5, D2B5... etc.
So if I could label the samples in the PCA plot, for example B1 and B2 only, then rely on colour to distinguish condition, the plot will be much cleaner. And same for the x-axis sample labels in the "Total read count per sample" plot.

Would this be difficult to do?

P.S.
I found that I can't simply edit the plot afterwards, even if it an EPS file, as removing characters makes changes to the placement of the text.

input files format

dear SARTools team,

as describe in your paper, as input files, count data files are sample-specific and are
composed of two columns (a unique feature identifier and a raw feature count) with no header. using this format I have :

" Error in loadCountData(target = target, rawDir = rawDir, featuresToRemove = featuresToRemove) : Can't determine if count files come from HTSeq-count or featureCounts "

thanks for your help

best

Charles

SarTools Cloud Version

Dear SarTools Developers,

In my previous correspondence I mentioned having implemented SarTools on Google Colaboratory, a free version of Juypter notebook which runs in the Cloud (more information). Would you be interested in a contribution to the "How to use SARTools?" section containing a link to this cloud-based version which syncs to users google drive accounts?

Thank you for your consideration.

Sincerely,
MTBH

Segment fault

Hello,
I moved this post from comment to "issue" to seek for some help as I met problem when I ran SARTools.

*** caught segfault ***
address 0x68, cause 'memory not mapped'

Traceback:
 1: dev.off()
 2: pairwiseScatterPlots(counts = counts, group = group)
 3: descriptionPlots(counts = counts, group = target[, varInt], col = colors)
An irrecoverable exception occurred. R is aborting now ...
Segmentation fault

I can see the part of the results (figures subfolder), which are:
barplotNull.png barplotTotal.png densplot.png majSeq.png pairwiseScatter.png

And here is my R environment:

> sessionInfo()
R version 3.3.0 (2016-05-03)
Platform: x86_64-pc-linux-gnu (64-bit)
Running under: Debian GNU/Linux stretch/sid
locale:
 [1] LC_CTYPE=en_US.UTF-8       LC_NUMERIC=C              
 [3] LC_TIME=en_US.UTF-8        LC_COLLATE=en_US.UTF-8    
 [5] LC_MONETARY=en_US.UTF-8    LC_MESSAGES=en_US.UTF-8   
 [7] LC_PAPER=en_US.UTF-8       LC_NAME=C                 
 [9] LC_ADDRESS=C               LC_TELEPHONE=C            
[11] LC_MEASUREMENT=en_US.UTF-8 LC_IDENTIFICATION=C       

attached base packages:
[1] stats     graphics  grDevices utils     datasets  methods   base 
> packageVersion("DESeq2")
[1] ‘1.12.3’
> packageVersion("SARTools")
[1] ‘1.3.1’

And some of my computer info are:

$ uname -a
Linux Cherry 4.3.0-1-amd64 #1 SMP Debian 4.3.3-5 (2016-01-04) x86_64 GNU/Linux
$ free -h
              total        used        free      shared  buff/cache   available
Mem:           1.5T         10G        360G        250G        1.1T        1.2T
Swap:          499M        496M        3.5M

I just realized my experiment design is different from the demo target.txt, which contains three groups for comparisons of every two:

label       files   Treatment   group
sample01 file01    E    X
sample02 file02    E    X
......
sample13 file13    M    Y
sample14 file14    M    Y
......
sample25 file25    L    Z
sample26 file26    L    Z

Do you have any clue what possibly caused the segfault problem? Thanks a lot!

P.S. At first It seems to me the problem is related to the pairwiseScatterPlots() function for 3-group of samples. However, when I use the same sets of data but only use 2-group "fake" treatment for testing purpose, same problem.
I have 42 samples in total, each with ~177Million geneID. I did not see any RAM issues from my RAM consumption track (one test was carried out with 1.5TB RAM).

Also I tried fresh installation with two different computers, same problem. As Hugo mentioned the update all the packages of the computer, and I assumed the pkgs are "R pkgs" and some related ones like libcurl4, xml2, openssl etc, which are updated.

Hope to get some more ideas. Thanks again!

Yifang

install SARTools in RSTUDIO

Hi,
I would like to install SARTools but I get the error below ;
> install_github("PF2-pasteur-fr/SARTools", build_vignettes=TRUE)
Downloading GitHub repo PF2-pasteur-fr/SARTools@master
sh: 1: /bin/gtar: not found

gzip: stdout: Broken pipe
sh: 1: /bin/gtar: not found

gzip: stdout: Broken pipe
Error in system(cmd, intern = TRUE) : error in running command
In addition: Warning message:
In utils::untar(tarfile, ...) :
‘/bin/gzip -dc '/tmp/RtmpaKnPjj/file5af435bec50b.tar.gz' | /bin/gtar -xf '-' -C '/tmp/RtmpaKnPjj/remotes5af44c43b3a6'’ returned error code 127
>

Would you have you a solution ?

Thanks in advance.
SM

Figure image too large error

I am running into a certain trouble of pixel-size limit of cairo/png.
I had to add the option

options(bitmapType='cairo')

as we had really issues with png file generations in general under R

The problem which I now have for a certain experiment is that I am running into a hight limit

cairo error 'invalid value (typically too big) for the size of the input (surface, pattern, etc.)'

From the source code you already capping the width when a certain level is reached 4 , could you as well include this for the hight?

Kind regards

SARTools DESeq2 and EdgeR output tables have non consistent columns

Hi,
I've been running RNAseq DE analysis comparing the results from DESeq2 and EdgeR. One of my last step consist in extracting from the output table "*.complete.txt" the DE genes using filters on the log2(FC) and the ajusted pvalue.
I just realized by chance that there is a pb of consistency in the column numbers of this file between DESeq2 and EdgeR SARTools outputs.

I based my scripts on the EdgeR columns where the log2(FC) is in column 18, and the adjusted pvalue is column 20. However, in the DESeq2 file the first 18 column are consistent with the EdgeR file but the "stat" column is inserted between the log2(FC) and pvalue column.
What that means is that if you go over it a bit fast like I did, you end-up filtering on the pvalue column instead of the adjusted pvalue.

Maybe so that the 2 files are more consistent it would be a good idea to have the same first 20 columns the same in both file format. And so that inattentive users like me don't do this kind of mistake.

Thanks.

Option to save figures as eps files that can be edited in programs like Inkscape and Illustrator

ggplot has the the ability to save plots as eps files, which are scalar vector graphics, so you have high (infinite) resolution images (not bitmaps).

In addition, objects like text in the image can be edited in drawing programs like Inkscape and Adobe Illustrator.

Here's a simple example of the ggsave function:

plot <- ggplot(df, aes(y=y1, x=x1)) +geom_point()
ggsave('test.eps', plot)

Those are the pros, but there are cons, for example Microsoft Office does not support eps files. But perhaps perhaps both the old png and new eps figures can be generated?

targetFile must be a character vector of length 1 specifying an accessible file?

When I execute this segment:

checking parameters
checkParameters.edgeR(projectName=projectName,author=author,targetFile=targetFile,
rawDir=rawDir,featuresToRemove=featuresToRemove,varInt=varInt,
condRef=condRef,batch=batch,alpha=alpha,pAdjustMethod=pAdjustMethod,
cpmCutoff=cpmCutoff,gene.selection=gene.selection,
normalizationMethod=normalizationMethod,colors=colors)

I get the error : "targetFile must be a character vector of length 1 specifying an accessible file
"
I'm quite certain that I have a correct 'target.txt' file defined with correct formatting (tab delimited)
image

Could someone please help me troubleshoot this? Thanks!

Option to set ggplot themes

After a recent update, all of the plots use the default ggplot theme, with the grey background. I would like to use alternative themes, like the light theme. Is this possible?

writeReport.DESeq2 Command Error: pandoc document conversion failed with error 83

Dear SARTools Developers,

When implementing SARTools within the R Google Colaboratory I found everything working quite well except for the final command where I encountered the following error: https://u.cubeupload.com/MakeTheBrainHappy/ScreenShot20210410at.png

Searching through public forums it seems to be related to an update to rmarkdown and the specific command utilized for citations. This also seems to have been addressed in the Galaxy version of SARTools: PF2-pasteur-fr/SARTools-Galaxy#10

I confirmed that the issue was with pandocs by setting it to false in a forked version: https://github.com/MakeTheBrainHappy/SARTools

This fixed the problem well enough for the teaching session I was doing (we could kind of navigate through unparsed RTML); however, it would be great if there was a more permanent fix for when I release the notebook publicly.

Thank you for your support!

Sincerely,
MakeTheBrainHappy

Overlapping labels in PCAplot

Not an issue, but a favour needed.
How to avoid the overlapping labels in my PCAplot while I'm trying some other tools like ggrepel, which seems not as easy as other examples as PCAplot is embedded within the package?
Thanks a lot!
Yifang

Factor variables

In R it is possible to define a factor with numerical levels:

levels (df$col1) = c(1:4)

After saving such a file as a text file and reading it using SARTools it is not converted into a factor and thus cannot be used as a batch effect for example....

p-value change with multiple condition

Hello,

First of all, thank you for your very practical tool.
I want to do an analysis with Deseq2 with 12 samples distributed in 4 groups.
For the example, group A containing 3 samples is the control, I want to look at the inducibility of genes between group A Vs B, A Vs C and A Vs D.
So I used your script by putting group A as control, and everything works correctly.
I get a table with the desired comparisons.
But later to save time I did a new analysis (with the same parameters, same version of the script and R) only between group A and B.
I get the table A Vs B.
The problem is that the first table A vs B obtained when I put the 4 groups is not the same as the table A Vs B when I put only the 2 groups A and B.
The Fold, Log2fold change is very small but the p-value and adjusted p-value change for some genes enormously.
I wonder why adding conditions C and D interferes with the calculation of the p-value between A and B

I use the following parameters

targetFile <- "target2.txt" # path to the design/target file
rawDir <- "data" # path to the directory containing raw counts files
featuresToRemove <- c("alignment_not_unique", # names of the features to be removed
"ambiguous", "no_feature", # (specific HTSeq-count information and rRNA for example)
"not_aligned", "too_low_aQual")# NULL if no feature to remove

varInt <- "group" # factor of interest
condRef <- "w" # reference biological condition
batch <- NULL # blocking factor: NULL (default) or "batch" for example

fitType <- "parametric" # mean-variance relationship: "parametric" (default), "local" or "mean"
cooksCutoff <- TRUE # TRUE/FALSE to perform the outliers detection (default is TRUE)
independentFiltering <- TRUE # TRUE/FALSE to perform independent filtering (default is TRUE)
alpha <- 0.05 # threshold of statistical significance
pAdjustMethod <- "BH" # p-value adjustment method: "BH" (default) or "BY"

typeTrans <- "VST" # transformation for PCA/clustering: "VST" or "rlog"
locfunc <- "median" # "median" (default) or "shorth" to estimate the size factors

colors <- c("dodgerblue","firebrick1", # vector of colors of each biological condition on the plots
"MediumVioletRed","SpringGreen")

forceCairoGraph <- FALSE

Thank you

Florent

error when generating HTML files

Hi! I have a problem when running sartools. I have run sartools before and it did not happened! At the last part (generating HTML report) I obtain this error:

> > # generating HTML report
> > writeReport.DESeq2(target=target, counts=counts, out.DESeq2=out.DESeq2, summaryResults=summaryResults,
> +                    majSequences=majSequences, workDir=workDir, projectName=projectName, author=author,
> +                    targetFile=targetFile, rawDir=rawDir, featuresToRemove=featuresToRemove, varInt=varInt,
> +                    condRef=condRef, batch=batch, fitType=fitType, cooksCutoff=cooksCutoff,
> +                    independentFiltering=independentFiltering, alpha=alpha, pAdjustMethod=pAdjustMethod,
> +                    typeTrans=typeTrans, locfunc=locfunc, colors=colors)
> Quitting from lines 63-100 (/home/azken/R/x86_64-pc-linux-gnu-library/3.3/SARTools/report_DESeq2.rmd) 
> Error in eval(expr, envir, enclos) : objeto 'nbNull' no encontrado

I would appreciate your help. Best regards,

Maria

SARtools useable for experimental setup with both time and concentration

Thank you for developing SARtools!

As far as I can read SARtools can not be used on my data due to the experiemtal setup. But I want to be absolutely sure before excluding SARtools as a way to smoothly analyze my data.

I have RNA-seq data (gene counts) from an experiment where we look into changes in gene counts after addition of different concentration of a compound and over time.
So we have Concentrations: 0, 3, 12, 90 and Times: 0, 3, 30 and 100 days.

So we need to now which (if) gene counts significantly change ( in comparison to concentration 0, time 0 = control) with the different concentrations added and with time.

Maybe this can be tested looking at times seperately and then look at changes in genes with different wood ash concentrations? And the same for time: Looking at concentrations seperately and then look at changes in genes with different times

Any advice on this? Do you advice to use SARtools for this?

Hope the descriptions makes sense.

Thank you very much in advance!

Extract DESeq2 normalized count table after SARTools run

Hi Hugo,

I would like to extract the normalized count table after I succesfully have runned SARTools.

I might have found the solution, but could you please confirm this or guide me in the right direction.

The command I used to extract the DESeq2 normalized counttable after SARTool run:

foo <- counts(out.DESeq2$dds, normalized = TRUE)
write.csv(foo, file="norm_counts.csv")

Thank you very much in advance.

Recommend Projects

  • React photo React

    A declarative, efficient, and flexible JavaScript library for building user interfaces.

  • Vue.js photo Vue.js

    🖖 Vue.js is a progressive, incrementally-adoptable JavaScript framework for building UI on the web.

  • Typescript photo Typescript

    TypeScript is a superset of JavaScript that compiles to clean JavaScript output.

  • TensorFlow photo TensorFlow

    An Open Source Machine Learning Framework for Everyone

  • Django photo Django

    The Web framework for perfectionists with deadlines.

  • D3 photo D3

    Bring data to life with SVG, Canvas and HTML. 📊📈🎉

Recommend Topics

  • javascript

    JavaScript (JS) is a lightweight interpreted programming language with first-class functions.

  • web

    Some thing interesting about web. New door for the world.

  • server

    A server is a program made to process requests and deliver data to clients.

  • Machine learning

    Machine learning is a way of modeling and interpreting data that allows a piece of software to respond intelligently.

  • Game

    Some thing interesting about game, make everyone happy.

Recommend Org

  • Facebook photo Facebook

    We are working to build community through open source technology. NB: members must have two-factor auth.

  • Microsoft photo Microsoft

    Open source projects and samples from Microsoft.

  • Google photo Google

    Google ❤️ Open Source for everyone.

  • D3 photo D3

    Data-Driven Documents codes.