whitakerlab / scona Goto Github PK
View Code? Open in Web Editor NEWCode to analyse structural covariance brain networks using python.
Home Page: https://whitakerlab.github.io/scona/
License: MIT License
Code to analyse structural covariance brain networks using python.
Home Page: https://whitakerlab.github.io/scona/
License: MIT License


The function view_corr_mat in visualisation_commands needs to be redesigned to plot matrices that are not saved as files.
We would like to turn this video into a GIF and add it to the top right hand corner of the readme, in line with the first sentence.
The CONTRIBUTING guidelines for this project use shield.io badges to make the labels look pretty. (Scroll down on http://shields.io to the My Badge section to see how they're made).
Some are broken though!
There are two errors as it stands in the CONTRIBUTING file:
The badge has a - in the name which is not working any more. The name of the link to the badge needs to be replaced with -- where - is supposed to be rendered in the text of the badge.
For example at the moment https://img.shields.io/badge/-no-code-207de5.svg does not render but https://img.shields.io/badge/-no--code-207de5.svg does show up as .
Some of the links are mis-typed.
For example [link_bugs] doesn't actually exist, but there is a [link_bug] in the list at the end of the CONTRIBUTING file. Same with [link_requests] which should be [link_request].
It would be great to have these fixed! Ping me if you have any questions @jlee124! 🌮 ✨
There seems missing an argument in this line: https://github.com/WhitakerLab/BrainNetworksInPython/blob/master/scripts/make_graphs.py#L293
It should be R_list, R_nodal_partition_list = make_random_list(G, n_rand)
The method BrainNetwork.report_nodal_measures returns a dataframe with columns in alphabetical order. We would like to adjust this so that "name" and "centroids" appear first.
This is a catch-all list for things that we're interested in integrating with BNIP. Go forth and add your suggestions.
If you want to start work on one of these integrations go ahead and start a new issue
I think we need to add something about pip install -r requirements.txt and python setup.py install to the README file.
(Thank you @Islast for answering my questions on gitter!!) 💖 👾
I believ this is just a matter of putting list(...) around certain expressions which now return iterators rather than lists.
Progress on this issue is taking place at PR #55
Hi @Islast
I came across these two repositories that I thought might be useful for speeding up the processing:
https://github.com/vtraag/python-igraph
https://github.com/vtraag/louvain-igraph
No action particularly required here, I just wanted to let you know that these two exist!
I want to introduce some code examples to the readme. I also want to CI test these examples so that we are alerted if they break at any point.
My first thought was to autogenerate the readme from a jupyter notebook, but then if someone wants to edit the readme they need to edit the jupyter notebook instead.
Does anyone know how to have the readme pull in some examples from a .py file? Or to scrape the readme for code and test that?
This is for @KirstieJane to remind her to look at the new testing branch. There's a lot of junk in there right now, firsttest.py and write_fixtures.py are the ones to check out!
This is a great place to start if you're looking to dip your toe into contributing via GitHub.
If you see a typo or a broken link anywhere in our documentation you can fix by making a pull request.
This is one of our "good first bugs" and therefore you don't have to have any experience with GitHub to complete it. Just comment below with the mistake that you've found, and @KirstieJane will be sure to help you all the way along to merging in your the new - correct - version of the text.
You can contact Kirstie via twitter, email (kw401 AT cam DOT ac DOT uk) or by typing @KirstieJane in your comment below.
Go for it! And thank you!
At the moment we ask contributors to build the sphinx documentation locally before submitting their pull request. What if travis could do that so we didn't need that requirement!? ✨
Here's a gist I found to maybe help out whomever has time (or the expertise) to work on it! https://gist.github.com/brenns10/f48e1021e8befd2221a2
I've been making a lot of changes to the make_figure.py script so that it can run from the files output by network analysis. Would it be more organisationally proper to copy everything I need from make_figures over to visualisation commands and start clean in there? 🌼
I see these three warnings for the following command in the demo notebook:
mfg.network_summary_fig(corrmat_file, NodalMeasures, GlobalMeasures, RichClub, figures_dir)
/srv/conda/lib/python3.6/site-packages/BrainNetworksInPython/wrappers/../scripts/make_figures.py:3363: FutureWarning: Method .as_matrix will be removed in a future version. Use .values instead.
  return deg, rc, df.as_matrix()
/srv/conda/lib/python3.6/site-packages/matplotlib/axes/_axes.py:6462: UserWarning: The 'normed' kwarg is deprecated, and has been replaced by the 'density' kwarg.
  warnings.warn("The 'normed' kwarg is deprecated, and has been "
/srv/conda/lib/python3.6/site-packages/seaborn/timeseries.py:183: UserWarning: The tsplot function is deprecated and will be removed or replaced (in a substantially altered version) in a future release.
  warnings.warn(msg, UserWarning)
There are 3 warnings here:
.as_matrix to .values -- seems pretty easy'normed' to 'density' -- seems pretty easytsplot function is depreciated. This one seems less easy because the warning message doesn't tell us what to do instead so I think this warning might need a bit more digging through the seaborn code/updates etc.@Islast - if you think my description looks ok, then just let me know and I'll ping out the issue to see if anyone wants to help to fix it ✨
In calculate_nodal_measures we return a value for the hemisphere of each region based on the x coordinate of the region's centroid values.
At the moment these are -1 and 1 but it would be great to map them to L and R according to the MNI conventions: left is negative 👾
I noticed yesterday when going through some of the code in BrainNetworksInPython that it could potentially use some linting to align with Python's PEP8 standards. Thankfully, tools like Atom have add-on packages that make this process much easier to do!
I was wondering if you would be amenable to my opening a PR aimed at linting the codebase a bit? I actually use the aforementioned package (linter-flake8) myself, and really like / recommend it. Indeed, while I may be a bit biased, I personally find that linted code is generally much nicer to read and easier to interpret—which will hopefully mean that new contributors find it easier to get involved.
Let me know if you think this would be of interest! 🙂
In our PNAS paper Petra and I include a summary figure for the network analyses in the supplementary material:
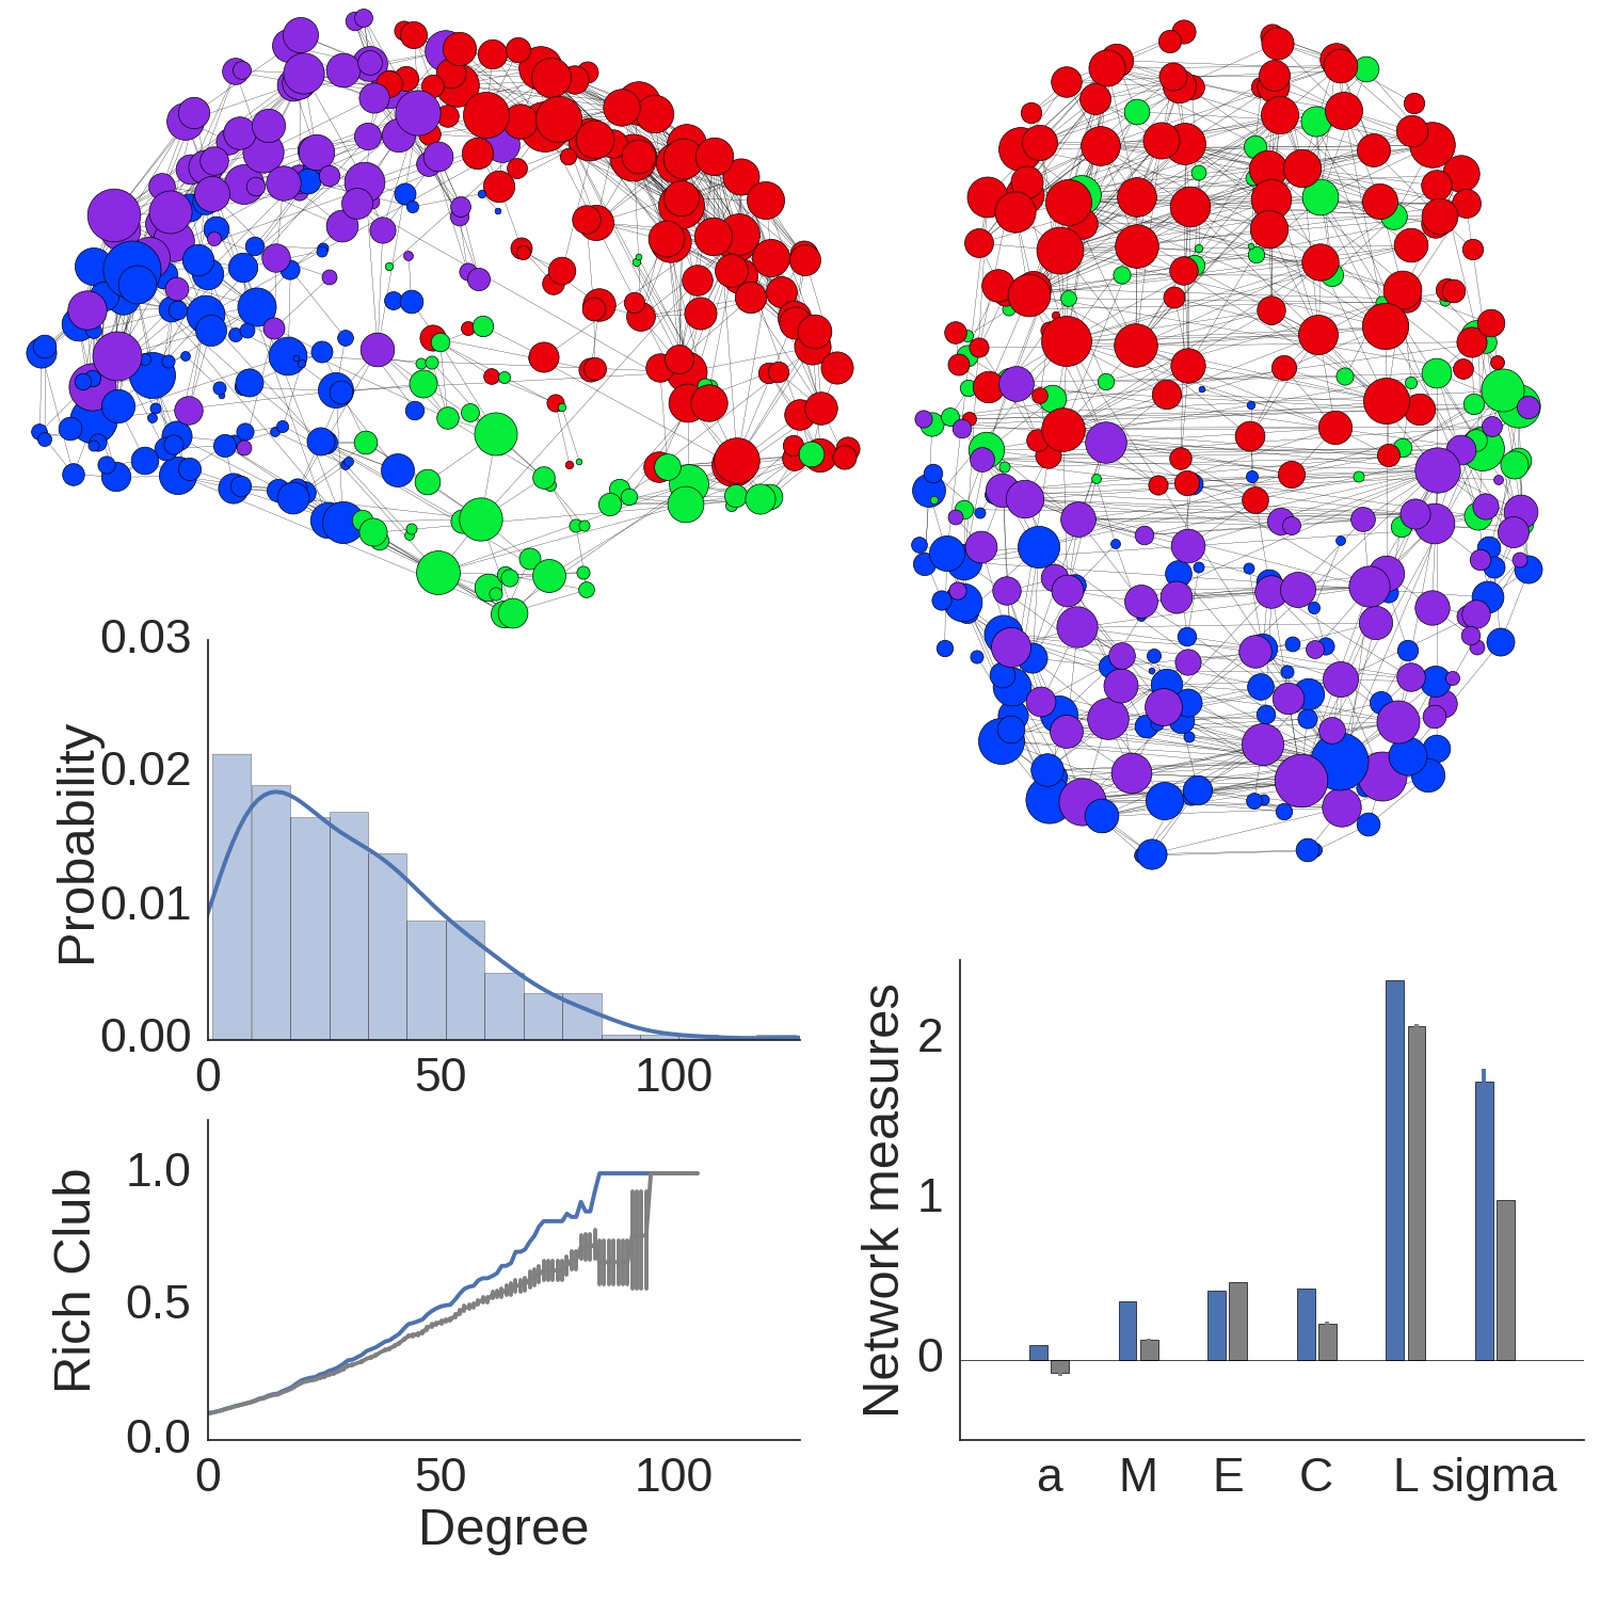
I'd like to write a little wrapper command to do the same thing for any network that's been processed through the code provided in this repository.
Follow up with David Bryant after conversation at MozFest
We've implemented Travis continuous integration (wooo 🙌) and added some regression tests in #21 but we need to actually document what these tests are doing.
Imagine you're explaining them to me....who has never done any testing before 😬
THANK YOU!
To calculate global measures, we generate a cohort of random graphs via edge-swapping. This is very slow ~ 2 minutes for 100 random graphs, where we need about 10,000. For situations where we have to create a cohort of random graphs each for a group of graphs, this is too slow.
This is a very long issue to discuss how to change the network_analysis_from_corrmat wrapper, for more modularity and easier adjustment.
One major consideration is how much of the data that accompanies the correlation matrix (names, centroids) and how much of the data produced afterwards (partitions, random graphs and measures) can or should be stored as attributes of the graph, graph nodes or edges.
Furthermore should some of these functions (nodal partition, calculate measures, the smaller functions wrapped in the 'calculate_nodal_measures' function, write_out_x) be Class methods? Adding class methods to the networkx Graph class seems cavalier. We could define a new class, but if we do it should support all the same methods as a networkx Graph.
# Read in the data
M, names, centroids = read_in_data(corr_mat_file,
                                    names_file,
                                    centroids_file,
                                    names_308_style)

# Make your graph at cost
G = mkg.graph_at_cost(M, cost)# Calculate the modules
nodal_partition = mkg.calc_nodal_partition(G)# Get the nodal measures
# (note that this takes a bit of time because the participation coefficient
# takes a while)
G, nodal_dict = mkg.calculate_nodal_measures(G,
centroids,
names,
nodal_partition=nodal_partition,
names_308_style=names_308_style) # Save your nodal measures
write_out_nodal_measures(nodal_dict, centroids, output_dir, corr_mat_file, cost)R_list, R_nodal_partition_list = mkg.make_random_list(G, n_rand=n_rand)global_dict = mkg.calculate_global_measures(G,
R_list=R_list,
nodal_partition=nodal_partition,
R_nodal_partition_list=R_nodal_partition_list)# Write out the global measures
write_out_global_measures(global_dict, output_dir, corr_mat_file, cost)# Get the rich club coefficients
deg, rc, rc_rand = mkg.rich_club(G, R_list=R_list, n=n_rand)# Write out the rich club coefficients
write_out_rich_club(deg, rc, rc_rand, output_dir, corr_mat_file, cost)As of Latest commit 81713d6
def network_analysis_from_corrmat(corr_mat_file,
names_file,
centroids_file,
output_dir,
cost=10,
n_rand=1000,
names_308_style=False):
'''
This is the big function!
It reads in the correlation matrix, thresholds it at the given cost
(incorporating a minimum spanning tree), creates a networkx graph,
calculates global and nodal measures (including random comparisons
for the global measures) and writes them out to csv files.
'''
# Read in the data
M, names, centroids = read_in_data(corr_mat_file,
names_file,
centroids_file,
names_308_style)
# Make your graph at cost
G = mkg.graph_at_cost(M, cost)
# Calculate the modules
nodal_partition = mkg.calc_nodal_partition(G)
# Get the nodal measures
# (note that this takes a bit of time because the participation coefficient
# takes a while)
G, nodal_dict = mkg.calculate_nodal_measures(G,
                                             centroids,
                                             names,
                                             nodal_partition=nodal_partition,
                                             names_308_style=names_308_style)
# Save your nodal measures
write_out_nodal_measures(nodal_dict, centroids, output_dir, corr_mat_file, cost)
# Get the global measures
# (note that this takes a bit of time because you're generating random
# graphs)
R_list, R_nodal_partition_list = mkg.make_random_list(G, n_rand=n_rand)
global_dict = mkg.calculate_global_measures(G,
                                            R_list=R_list,
                                            nodal_partition=nodal_partition,
                                            R_nodal_partition_list=R_nodal_partition_list)
# Write out the global measures
write_out_global_measures(global_dict, output_dir, corr_mat_file, cost)
# Get the rich club coefficients
deg, rc, rc_rand = mkg.rich_club(G, R_list=R_list, n=n_rand)
# Write out the rich club coefficients
write_out_rich_club(deg, rc, rc_rand, output_dir, corr_mat_file, cost)Update:
Please help us choose a package name by voting and suggesting in this poll 🎉 ✨ 🌸
You can find a little background information on what we're doing and why we need to choose a new name in our blog
A naming convention for python packages and modules is reccomended in PEP 8
Modules should have short, all-lowercase names. Underscores can be used in the module name if it improves readability. Python packages should also have short, all-lowercase names, although the use of underscores is discouraged.
What do you think gang? Should we stick to our guns and go BrainNetworksInPython, compromise on brainnetworksinpython, bnip, pythonbrainnetworks, brainnetworks, networkbrains, or abandon propriety and go networknoggins
Check out the Brain Connectivity Toolbox which is written in matlab.
Here's a paper associated with it: https://doi.org/10.1016/j.neuroimage.2009.10.003
Here's a list of the measures they implement: https://sites.google.com/site/bctnet/measures/list
Interesting new paper that describes a “diverse club” built from the participation coefficients for each node.
https://www.nature.com/articles/s41467-017-01189-w
Might be an interesting measure to include? Also, I haven’t checked to see if the code is available but it could be useful for other aspects?
Here's the paper's github page: https://github.com/mb3152/diverse_club
See the Travis CI guide to getting started for help.
A first step would be adding a .travis.yml file
We need to update our readme with the following:
more explanation of what brain networks in python does, where to start etc.
Link to travis CI build a la the WhitakerLab website repo
add mozfest session to other
add something to the effect of
k published a paper looking at teenage brain development last year. what we are doing is taking the code she used for that paper and making it useful for everybody else. at the moment most of our efforts are in refactoring it, introducing testing, providing documentation and tutorials.
crediting Kirstie and linking nspn paper
replace gif with 
Readme should contain some examples of what the code can do, these examples should be tested in the travis yml
Prepare files that are relevant to apply new parcellation:
BrainNetworksInPython/datasets/NSPN_WhitakerVertes_PNAS2016/500.centroids.txt)BrainNetworksInPython/datasets/NSPN_WhitakerVertes_PNAS2016/500.names.txt). The order of centroid and name should match up in above two files.regionalmeasures_file should be sorted same as centroids_fileFor example, at the moment, I intend to merger Buckner2011_17Networks_MNI152 parcellation (only cerebellar regions) with 500aparc parcellation (default cerebral regions used BrainNetworksInPython as demo).
Centroids in the cerebellar regions extracted by the following commands:
source_img_fname=${FREESURFER_HOME}"/average/Buckner_JNeurophysiol11_MNI152/Buckner2011_17Networks_MNI152_FreeSurferConformed1mm_LooseMask.nii.gz"

color_lut=${FREESURFER_HOME}"/average/Buckner_JNeurophysiol11_MNI152/Buckner2011_17Networks_ColorLUT.txt"

mri_segcentroids --i ${source_img_fname} --o ./Buckner2011_17Networks_centroid.txt --ctab ${color_lut}
Then, append the extracted the 17 coordinates of the cerebellar centroid (Buckner2011_17Networks_centroid.txt) into the original 500aparc centroids file (500.centroids.txt). Also, append the 17 names of cerebellar region (can be found in Buckner2011_17Networks_ColorLUT.txt) into 500.names.txt. Finally, make sure that regions in regionalmeasures_file match with the new parcellation.
--
ref. mri_segcentroids
The current Travis build (29) is failing
Brain Networks In Python needs to be refactored to break down the conceptual steps for a network analysis to allow the user to re-combine them as they see fit and, as we are fond of repeating, "The second best time to add in tests for software is when refactoring. (The optimum time would have been when the code was written in the first place)".
When refactoring the codebase there are four things to keep in mind
Hi
I have a question regrading the code in this line https://github.com/WhitakerLab/BrainNetworksInPython/blob/master/scripts/make_graphs.py#L90, which I got:

This template seems really useful for packaging the code into a python package echosystem.
This is a beautiful interactive network and I'd love for us to figure out how to build it from outputs created by Brain Networks in Python.
It comes from this talk: http://mbostock.github.io/d3/talk/20111116/
I can't find the example code for the network though - can anyone help on that?
Once we've got the example code, we need to figure out how to format our networkx graphs into the input format required by dj3 😄
All help happily recieved!
I see this future warning for the following command in the demo notebook:
cfrm.corrmat_from_regionalmeasures(regionalmeasures_file, names_file, corrmat_file, names_308_style=True)
/srv/conda/lib/python3.6/site-packages/BrainNetworksInPython/scripts/stats_functions.py:16:
FutureWarning: `rcond` parameter will change to the default of machine precision times ``max(M, N)`` where M and N are the input matrix dimensions.
To use the future default and silence this warning we advise to pass `rcond=None`, to keep using the old, explicitly pass `rcond=-1`.
  B = np.linalg.lstsq(A, y)[0]
Seems like the fix is in the error message - need to pass either None or -1.....I'm not sure which is the right answer....
@Islast - maybe you can recommend which setting to choose - I'm guessing the old default will keep our regression tests right? And then I'm happy to tweet this out as a good first bug for new contributors ✨
One of our aims in our mozfest session is to have attendees run BrainNetworksInPython code on their own computers. We need a way to provide this code that ideally:
Broken link in README to Tutorial notebook
Also it would be good to upload it to nbviewer and share the link directly - I think that would work on mobile also (which is where I tried to see this)..
Let's say we have two cohorts of subjects, for example people with a diagnosis of depression and healthy controls. Our networks are aligned, so it is straightforward to compare the cohort A network to the cohort B network. It's less straightforward to interpret this comparison.
We plan to add a module that permutes the original data and builds up a null distribution so that differences between the two real groups can be statistically tested
Back in the day I wrote a little function called plot_circular_network.py and now @lzdh would like to use it to visualise her data.
A correlation matrix and a directory with brain images named in ascending numerical order (starting with 0000.png).
We'll also need to pass a threshold as we can't visualise ALL of these.
A pretty picture of top X edges in a network with brain images around the outside representing the different nodes in the network.
get_circular_layout takes a graph (G) and a data frame (df) and returns pos_dict, theta_dict.
theta_dict: a list of polar angles from 0 that nodes should be plotted at (in degrees)pos_dict: the x and y coordinates on a unit circle corresponding to the different anglesdf can be removed from this function as it only needs the number of nodes and we could get that from the graph easily.plot_circular_network.py plots the network and returns a figure.
A circle with brains around the outside and some edges connecting these different nodes representing the network.
Only visualise nodes that have significant edges. If a node doesn't have a single edge then to remove it from the visualisation.
Cluster these nodes first and then visualise them in a circle.
Hi BrainNetworksInPython team! I saw Kirstie's call for help on Twitter about your Travis build failing for Python 3.6 and thought I would take a look into it to see if there was anything I could do.
After a bit of digging it looks like you're running into a version issue. The pandas module just updated to version 0.23.0 yesterday, right when your builds started to fail. If you force install the previous version (pip install -q pandas==0.22.0) instead, your builds should pass (at least, they do locally)! It looks like the pandas team must have changed something mission critical in their codebase, though determining exactly what would take a bit more digging.
For now, you should be able to fix this by changing your requirements.txt file to say pandas<=0.22.0. If you'd like me to submit a PR, just let me know and I'd be more than happy!
consider adding dependency continuous integration
to deal with new releases of our dependencies
https://dependencyci.com/
Specifically I'd like to add the CC-BY licence to the CONTRIBUTING and CODE_OF_CONDUCT files because @erindcole is about to use them in her project and it's not super clear how to credit them as the repo itself has an MIT licence.
When we create a network for a cohort of participants we can't meaningfully interpret graph measures if they change dramatically when the selection of participants is slightly altered. 🎱
We want to use bootstrap resampling to measure how much our graph measures change under perturbations to the group of participants.
When we implement this it should be done at the point of creation of correlation matrices. We will then perform the same analyses on the bootstrapped matrices as we would on the original.
✨
I'm not sure what resources there are for bootstrap resampling in python- Please comment if you do! 🌟
Add documentation to markdown file that explains the flow of testing. The use case is that contributors may come along and want to see what tests are done and where they can help, and an overview of the way tests are implemented would be a useful place to start.
Just a note:
In the script scripts/make_corr_matrices.py, I have to modify the function def create_corrmat(df, names, covars_list): this line M = df_res.loc[:, names].corr().values into M = df_res.loc[:, names].astype(float).corr().values. In order to avoid object dtype error.
Python 3.5.2 :: Anaconda 4.2.0 (64-bit)
numpy (1.11.1)
pandas (0.18.1)
sphinx auto creates documentation from the description given within your function. The benefit to this is that you can update the docs in the same place that you change the code.
This is already done for many functions due to Kirstie's forsight 💖
To ensure reproducibility of BrainNetworksInPython analyses, we would like to be able to set and record the random seeds used to generate random graphs.
networkx doesn't currently support this, and in our regression tests we handle this by setting the global seed.
In the present dev branch of networkx they are introducing this functionalty link. It might be best to hold on until this release.
BrainNetworksInPython is a toolkit to analyse structural covariance brain networks using python.
The project aims to:
We will consider issues within this milestone our first priority
Brain Networks In Python needs to be refactored to break down the conceptual steps for a network analysis to allow the user to re-combine them as they see fit and, as we are fond of repeating, "The second best time to add in tests for software is when refactoring. (The optimum time would have been when the code was written in the first place)".
#22 Document the new regression tests
#45 Use Sphinx to document code
#70 Use flake8 to lint code
#10 Imitate the shablona python package framework
#40 Speed up creation of random graphs
#39 Shadow Brain Connectivity Toolbox
#75 Add command line examples to readme
testing : maximise coverage of code, especially for core modules (these are modules in the top level of the BrainNetworksInPython folder, or its wrappers subfolder
#13 Introduce way to investigate differences between two groups
#37 Add diverse club to network measures we can compute
#41 Bootstrap resampling for correlation matrices
In the fullness of time, we plan to release Brain Networks In Python as a Python package. Let's keep track of what needs to be done here.
#19 Choose a package name
#10 Restructure to python package framework
Finally...
Grow our community!
We try to make Brain Networks In Python a pleasant environment for contributors. This starts with our code of conduct and contributing guidelines. What else can we do for our users and contributors?
A declarative, efficient, and flexible JavaScript library for building user interfaces.
🖖 Vue.js is a progressive, incrementally-adoptable JavaScript framework for building UI on the web.
TypeScript is a superset of JavaScript that compiles to clean JavaScript output.
An Open Source Machine Learning Framework for Everyone
The Web framework for perfectionists with deadlines.
A PHP framework for web artisans
Bring data to life with SVG, Canvas and HTML. 📊📈🎉
JavaScript (JS) is a lightweight interpreted programming language with first-class functions.
Some thing interesting about web. New door for the world.
A server is a program made to process requests and deliver data to clients.
Machine learning is a way of modeling and interpreting data that allows a piece of software to respond intelligently.
Some thing interesting about visualization, use data art
Some thing interesting about game, make everyone happy.
We are working to build community through open source technology. NB: members must have two-factor auth.
Open source projects and samples from Microsoft.
Google ❤️ Open Source for everyone.
Alibaba Open Source for everyone
Data-Driven Documents codes.
China tencent open source team.