Code Monkey home page Code Monkey logo

clustergrammer's Introduction

Clustergramer

NPM NPM

Clustergrammer is a web-based tool for visualizing high-dimensional data (e.g. a matrix) as an interactive and shareable hierarchically clustered heatmap. Clustergrammer's front end (Clustergrammer-JS) is built using D3.js and its back-end (Clustergrammer-PY) is built using Python. Clustergrammer produces highly interactive visualizations that enable intuitive exploration of high-dimensional data and has several biology-specific features (e.g. enrichment analysis, see Biology-Specific Features) to facilitate the exploration of gene-level biological data. Click the screenshot below to view an interactive tutorial:

demo_screenshot

Clustergrammer's interacive features include:

Clustergrammer can be used in three main ways (this repo contains the source code for Clustergrammer-JS):

For information about building a webpage or app using Clustergrammer see: Web-Development with Clustergrammer

What's New

Clustergrammer2

badge Nbviewer

Running Clustergrammer2

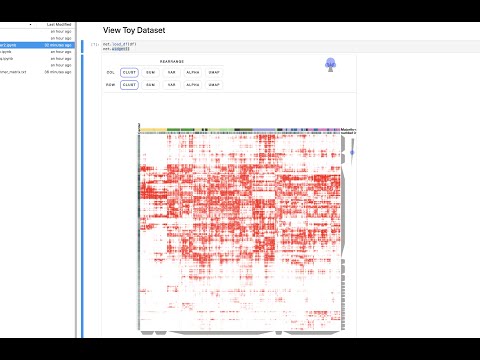
Clustergrammer is being re-built using the WebGL library regl. The new in-development front-end is Clustergrammer-GL and the new in-development Jupyter widget is Clustergrammer2. The above notebook shows how Clustergrammer2 can be used to load a small dataset and visualize a large random DataFrame. By running the notebook on MyBinder using Jupyter Lab it can also be used to visualize a user uploaded dataset. Please see the video tutorial above for more information.

For additional examples and tutorials please see:

JupyterCon 2018 Presentation

Clustergrammer JupyterCon 2018

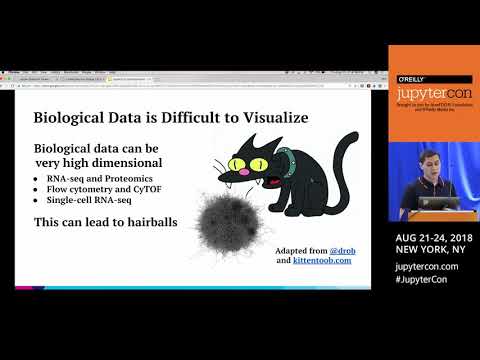
Clustergrammer was recently presented at JupyterCon 2018 (see slides).

Using Clustergrammer

Pleae see Clustergramer's documentation for detailed information or select a specific topic below:

Citing Clustergrammer

Please consider supporting Clustergrammer by citing our publication:

Fernandez, N. F. et al. Clustergrammer, a web-based heatmap visualization and analysis tool for high-dimensional biological data. Sci. Data 4:170151 doi: 10.1038/sdata.2017.151 (2017).

Licensing

Clustergrammer was developed by the Ma'ayan lab at the Icahn School of Medicine at Mount Sinai for the BD2K-LINCS DCIC and the KMC-IDG. Clustergrammer's license and third-party licenses are in the LICENSES directory and more information can be found at Clustergrammer License.

Please contact us for support, licensing questions, comments, and suggestions.

clustergrammer's People

Contributors

avimaayan avatar cornhundred avatar daniloimparato avatar gwgundersen avatar mayankmusaddi avatar michaelgmcd avatar

Stargazers

 avatar  avatar  avatar  avatar  avatar  avatar  avatar  avatar  avatar  avatar  avatar  avatar  avatar  avatar  avatar  avatar  avatar  avatar  avatar  avatar  avatar  avatar  avatar  avatar  avatar  avatar  avatar  avatar  avatar  avatar  avatar  avatar  avatar  avatar  avatar  avatar  avatar  avatar  avatar  avatar  avatar  avatar  avatar  avatar  avatar  avatar  avatar  avatar  avatar  avatar  avatar  avatar  avatar  avatar  avatar  avatar  avatar  avatar  avatar  avatar  avatar  avatar  avatar  avatar  avatar  avatar  avatar  avatar  avatar  avatar  avatar  avatar  avatar  avatar  avatar  avatar  avatar  avatar  avatar  avatar  avatar  avatar  avatar  avatar  avatar  avatar  avatar  avatar  avatar  avatar  avatar  avatar  avatar  avatar  avatar  avatar  avatar  avatar  avatar  avatar

Watchers

 avatar  avatar  avatar  avatar  avatar  avatar  avatar  avatar  avatar  avatar  avatar  avatar  avatar  avatar  avatar  avatar  avatar  avatar  avatar  avatar  avatar  avatar  avatar  avatar

clustergrammer's Issues

Row search - missing reset

It's not possible actually to go back to the original view after having searched a row. It'd be great to have a reset-button to clear a row search and restore the unfiltered view.

visualizing heatmap without clustering

Hi there,

first of all, I would like to acknowledge you for this very nice tool, it saves me a lot of time!

Here is my issue, I ran clustergrammer on my binary matrix, the results are good but I would like to rotate the branches of the hierarchical tree to get a nicer heatmap.

So I order my matrix as my convenience and now I would like to visualize it using Clustergrammer but with no clustering. Unfortunately, I'm unable to do this. I tried the option run_clustering=False, the Json file is created but I get an error when I load the webpage.

Is there a way to visualize the heatmap without cluster it ?

all the best

raphael

maximum recursion depth exceeded while getting the str of an object clustermap

Hi Nick,

We get this error 'maximum recursion depth exceeded while getting the str of an object clustermap', when we try to generate heatmap for the attached text file.
deepa1892018122623.txt

Also i tried uploading in it http://amp.pharm.mssm.edu/clustergrammer/ site, then i get the following error:

Internal Server Error
The server encountered an internal error or misconfiguration and was unable to complete your request.

Please contact the server administrator at [no address given] to inform them of the time this error occurred, and the actions you performed just before this error.

More information about this error may be available in the server error log

Thanks in advance.

Annotation column with multiple values

Hi,
I'm trying to use Clustergrammer to analyze some proteomics data, each row represent a single protein and the columns are the samples. I want to add a column of annotation (example: KEGG, GOBP, ...) so in the visualization we can do some annotation enrichment analysis for each cluster.

However, since each protein may belong to multiple gene sets/pathways, the annotation column contains multiple values represent each gene set/pathway the protein belongs to. Is there anyway to let the clustergrammer to treat the annotation as multiple values instead of a whole string?

Thanks!

"ReferenceError: new_cat is not defined"

Hi Nick,
This might be due only to my (idiosyncratic?) npm/webpack build system, but with 1.19.0 and strict mode, the chrome javascript interpreter balks at

(index):32958 Uncaught (in promise) ReferenceError: new_cat is not defined
    at (index):32958
    at Function._.each._.forEach ((index):53105)
    at (index):32955
    at Function._.each._.forEach ((index):53105)
    at (index):32935
    at Function._.each._.forEach ((index):53105)
    at make_cat_params ((index):32911)
    at ini_viz_params ((index):32080)
    at calc_viz_params ((index):31983)
    at make_params ((index):31687)

After returning to v 1.18.0, the problem went away. I am new to lots of this, you are an old hand, but fwiw I see that same error message when I neglect to explicitly declare a variable in a js function.

  • Paul

stable sorting on categories

Is your feature request related to a problem? Please describe.
I'm always frustrated when I want to sort on one category to get groups view. But also to sort on another category within those groups. Because it's impossible and Clustergrammer will ignore previous order.

Describe the solution you'd like
I would like the sorting on categories to if possible preserve the previous order of items (columns or rows). That is called "stable sorting". And it is a common feature in table data processors, as it allows to do nested sorts.

Additional context
So here's an example where it is not performing a stable sorting now (taken from http://maayanlab.github.io/clustergrammer/scrolling_tour):

  1. I sorted by Gender:
    Screen Shot 2019-12-05 at 11 00 18 AM

  2. then I sorted by "Category" in a hope that samples will stay sorted by Gender within each Category. But they don't:
    Screen Shot 2019-12-05 at 11 00 29 AM

webpack bundle.js doesn't seem to find d3.slider()

I'm trying to incorporate clustergrammer into a plotly-dash component (wrapping it into a React Component).
I'm trying to get a very basic component, which does nothing but import Clustergrammer. I've installed via npm install clustergrammer and use it in the React component with import Clustergrammer from 'clustergrammer';

However, when I build the component, the resulting bundle.js doesn't seem to have d3.slider defined.

The firefox console has the following error:
ReferenceError: d3 is not defined

And here is the problematic line in bundle.js:
d3.slider = n(261);

Clustergrammer.min.js but un-obfuscated

Hello,
First I want to thank you for this library, really powerful and efficient!
I am only able to use the clustergrammer.min.js (since it is a single independent file) in my project.

The minified version is working perfectly! However when trying to edit the obfuscation is frustrating to edit/debug i tried to beautify it but still the variable names are too confusing. I also tried using the source map but it didn't work on chrome.

Can you please include a minified version of the library but without obfuscation? It would be of great help!

Thank you,
Mohammad Bashir Sidani.

Unable to set any other color other than white to denote a 0 value in a heatmap

I wish to have a heatmap with a 0 value corresponding to red and a 1 value corresponding to white in the Clustergrammer JS Module. However this seems unachievable by any parametric changes. The only option provided in Clustergrammer JS is changing the color of the positive and the negative end.
This Feature is especially needed for P-Value heat maps where a lower value denotes higher significance, hence a darker color corresponding to the 0 is preferred.

clustergrammer not working inside an Electron app

I am trying to use clustergrammer inside an electron app but I am getting Uncaught TypeError: Cannot read property 'getComputedStyle' of null (See screenshot below)

clustergrammer_error2

I've followed the instructions from the official page which describes how to use clustergrammer in a web page.

My package.json looks like below,

pkg_json2

To reproduce this issue I've created a minimal repo in GitHub. First, execute yarn install inside the repo folder to install the node modules and then execute yarn start to launch the app.

My OS is Ubuntu 20.04 and using node version 14.16.1

Is it a bug or I am missing something? I will appreciate your suggestions

getSelectedRowNames, getSelectedColnames, selectRows, selectCols?

Hi Nick,

We are making pretty good progress on the RClustergrammer package. It's a pleasure working with what you have created.

Here are a few requests, all regarding selections: either retrieving the currently selected rows or column names for use in R, or making Clustergrammer selections from R - the programmatic equivalent, say, of clicking on a subcluster, after which the other rows (or columns) are grayed out.

All we need in either case is the equivalent functions in your javascript API. Maybe they already exist?

To sketch out some pseudo-code:

cg = Clustergrammer(args);
var nodeNames = cg.getSelectedRowNames()
var colNames = cg.getSelectedColumnNames()
cg.selectRows(["A", "B", "C"])
cg.selectColumns(["X", "Y", "Z"])

Possible?

ERROR TypeError: inst_cat.indexOf is not a function

Hi Nick,

When i upload this text file, i get below error

vendor.bundle.js:297317 ERROR TypeError: inst_cat.indexOf is not a function
at vendor.bundle.js:54354
at Function.forEach (vendor.bundle.js:128158)
at vendor.bundle.js:54351
at Function.forEach (vendor.bundle.js:128158)
at vendor.bundle.js:54331
at Function.forEach (vendor.bundle.js:128158)
at make_cat_params (vendor.bundle.js:54307)
at ini_viz_params (vendor.bundle.js:51881)
at calc_viz_params (vendor.bundle.js:51784)
at make_params (vendor.bundle.js:41021)

Can you pls tell me what am i missing here!!?

pls find the txt file,
Analytic Brains2862018113520.txt

Thanks in advance.

still planning to implement webgl version?

Hello, thanks for making such a great tool. I like the clustergrammer and now we're testing it. Btw, I read from your paper that you were planning to build webgl version to incorporate larger dataset. How is it going? we wish to load ~500 genomes by ~10/15k features.

clustergrammer with Dash?

Can clustergrammer be used with Dash? all my efforts have failed to render the visualisation. how would one approach doing this?

Original Value not showing in JS viewer

Although keep_orig=True is used when normalizing the data, and the JSON file contains the mat_orig data, the visualization does not show the original value.

In clustergrammer.js, from 297 - 308, the network_data.links is being created. Note, that while the .value (normalized value) is set, no .value_orig is set. In lines 365 - 369, the first links element is then checked to see if it contains a value_orig. Because no value_orig was set above, this is always false, and the config.keep_orig is set to false.

I updated my local copy to check:
if(_.has(config.network_data, 'mat_orig'))
if it does, then I go through the loop set with adding value_orig, else I go through the original 298-308 loop set.

Can you verify this bug?

Is ranking by variance done from top to lowest or vice versa?

Hi! Thanks so much for this wonderful tool! I just wanted to know what the ordering of ranking is when the user clicks on "Rank by sum" or "Rank by variance" (I couldn't find any info on this). So for example, if I would like to sort my columns by variance, does that mean columns on the left side have low variance and columns on the right side have high variance or vice versa?

Legend for Clustergrammer JS doesnt get updated on Defining Custom Tile Colors

When the tile_colors field in the argument was set to a different color, the heatmap generated gets updated however the legend always shows the colors red and blue only as is evident in the image,

clustergrammerColor

Ways to reproduce

var args = {
    root: chartid,
    network_data: data,
    tile_colors: ["#ED9124", "#00FF00"],
  };

cgm = Clustergrammer(args);

When using the above piece of code in a JS file to generate the heatmap, the tile colors gets updated however the legend remains the same.

Internal Server Error

Dear Clustergrammer Developers,

Thank you for making this tool, I am very excited to try it out on my own data!

I have been working towards testing clustergrammer today on a sample file. Once finally inputting my data on the Web-App I got the following error:

"Internal Server Error
The server encountered an internal error and was unable to complete your request. Either the server is overloaded or there is an error in the application."

Is this something to do with my input file being in the wrong format?

My input file is a tab-seperated txt file with 894 rows and 6 columns. Shown with hidden characters it looks like this;

"target"^I"12AL"^I"10CR"^I"20CR"^I"30CR"^I"40CR"$
"ENSMUST00000000759.8"^I0.837066862372647^I0.897578858825615^I0.903610323994267^I0.905386522086556^I0.900658493787424^I0.892458276216388$
"ENSMUST00000001002.7"^I0.549957075865901^I0.577077643009941^I0.604172738834674^I0.600149132294174^I0.637861013231482^I0.771398490740974$
"ENSMUST00000001565.14"^I0.645215616120261^I0.542169909604761^I0.369824160416951^I0.518234468798793^I0.422244547151046^I0.455743642122183$
"ENSMUST00000002490.6"^I0.208895273964395^I0.232327449287293^I0.268724633939878^I0.282537902134704^I0.334454959543114^I0.402702056762878$
"ENSMUST00000002855.13"^I0.335724125038441^I0.242222325278917^I0.186144528271758^I0.165387847236894^I0.165006323094772^I0.163753851614528$
"ENSMUST00000003620.12"^I0.315889000413465^I0.344475261530825^I0.517264720960506^I0.366597095088732^I0.428422071533618^I0.536253994714879$
"ENSMUST00000003876.9"^I0.043143113645689^I0.098860723732458^I0.326777947325392^I0.300270114141069^I0.236997433218614^I0.127533710978142$

Please let me know if anything stands out so I can get back to work.

Best wishes,
Daniel

Obtaining similarity matrices

Hi,

I am trying to get similarity matrices like shown on the web app demo page.
My set up is as follow:

  • a front end formatting data to tsv, requesting a 'net.viz' from a:
  • 'minimally forked' clustergrammer_py_v1_13_4 returning a net.cluster( ) response to a:
  • forked Clustergrammer.js

From this setup I can get a "clustergram/heatmap".
What I am missing is:

  • do I have to format the request matrix differently to get a similarity matrix back ?
  • do I have to modify request parameters (like sim_mat=true) ?

In the demo pages I see these two objects:
var network_sim_row
var network_sim_col
but I don't know how to get them.

Thank you,
Richard

multiple_clustergrams??

Hello,
Probably, this is a very silly question, but I couldn't find the documentation. I would like to create the JSON file for multiple clustergrams in order to have all the plots you show using the web app (heatmap plus Column Similarity Matrix and Row Similarity Matrix).
Right now I'm using the following code in python:

from clustergrammer_widget import *
from clustergrammer import Network
net = Network()
net.load_file('data.txt')
net.cluster()
net.write_json_to_file('viz', 'mult_view.json')

But how can I create the JSON with the other similarity matrix?

Thanks

Depricated jQuery shorthands

I have recently been integrating clustergrammer with a web app for exploring RNAseq data. I noticed that it still depends on jQuery 1.11.0 . I Used the jQuery migrate plugin with jQuery 3.5.1 and got the following warnings.
jquery_migrate_error

I have replaced the uses of these shorthands with .on() which has solved the issue and it as far as I have been able to see through my testing allows for clustergrammer to use jQuery 3.5.1

click_tile callback not working after zoom or crop

When using zooming functionality, the heatmap tiles outside zooming view are deleted from the dom.
Then when unzooming, the tiles reappear but whithout the click event mapped to the click_tile parameter function.

To fix it we patched the library by modifying the run_when_zoom_stopped function :

// }),
/
156 /
/
/ (function(module, exports, webpack_require) {

var constrain_font_size = __webpack_require__(147);
var trim_text = __webpack_require__(146);
var num_visible_labels = __webpack_require__(157);
var toggle_grid_lines = __webpack_require__(149);
var show_visible_area = __webpack_require__(134);
var check_zoom_stop_status = __webpack_require__(158);
var utils = __webpack_require__(2);
var add_click_hlight = __webpack_require__(92);

module.exports = function run_when_zoom_stopped(cgm) {

  var params = cgm.params;

  var stop_attributes = check_zoom_stop_status(params);

  if (stop_attributes === true) {

      if (typeof params.click_tile === 'function') {
          d3.selectAll(params.root + ' .tile').on('click', function (d) {

              // export row/col name and value from tile
              var tile_info = {};
              tile_info.row = params.network_data.row_nodes[d.pos_y].name;
              tile_info.col = params.network_data.col_nodes[d.pos_x].name;
              tile_info.value = d.value;

              if (utils.has(d, 'value_up')) {
                  tile_info.value_up = d.value_up;
              }
              if (utils.has(d, 'value_dn')) {
                  tile_info.value_dn = d.value_dn;
              }
              if (utils.has(d, 'info')) {
                  tile_info.info = d.info;
              }
              // run the user supplied callback function
              params.click_tile(tile_info);
              add_click_hlight(params, this);
          });
      } else {

          // highlight clicked tile
          if (params.tile_click_hlight) {
              d3.selectAll(params.root + ' .tile').on('click', function () {
                  add_click_hlight(params, this);
              });
          }
      }

......

Not sure if it's the best way to fix it, but for us it does the job. I let you decide if this should be integrated in future release.

max tree levels 11?

Hi NIck,

In our early testing of RClustergrammer we encountered a matrix of single cell neuron rna-seq data. When we cluster in R (using the base R hclust function) we get back a hierachical tree of 187 (!) levels.

The max tree depth level in Clustergrammer appears to be 11.

Is this configurable? We are getting by right now by truncating our tree, from the top or the bottom, to 11 levels, but we lose lots of information.

Thanks!

  • Paul

Column Headers Need More Space

Hi again,

So, we noticed another thing about the heatmap links (awesome heatmaps though!) generated and returned by the API. There isn't a lot of room for column headers, although a context blurb does appear nicely when the cursor hovers over it. But if the header is over several characters long, it gets truncated. Like so:
image

The usual header is something like "3 Mouse Lung Cancer - specimen grey mouse 33".

Is there perhaps an argument that could be included to allow for space above the table during the Post?

Cheers,
Grant

type: 'cat_values' seems excluded from treatment at calc_cat_cluster_breakdown

Hi,
I have this situation where my data contains numerical categories, giving this error:

Uncaught TypeError: Cannot read property 'length' of undefined
at make_cat_breakdown_graph.js:132
at arrayEach (lodash.js:532)
at Function.forEach (lodash.js:9357)
at make_cat_breakdown_graph (make_cat_breakdown_graph.js:108)
at still_hovering (make_dendro_triangles.js:54)

JSON.stringify(inst_cat_info,null,'\t')

{
	"cat-0": {
		"type": "cat_strings",
		"max_abs_val": null,
		"cat_scale": null,
		"cat_hist": {
			"None": 8,
			"High": 2,
			"Low": 2
		}
	},
	"cat-1": {
		**"type": "cat_values",**
		"max_abs_val": 90,
		"cat_hist": null
	},
	"cat-2": {
		"type": "cat_strings",
		"max_abs_val": null,
		"cat_scale": null,
		"cat_hist": {
			"Female": 9,
			"Male": 3
		}
	},
	"cat-3": {
		"type": "cat_strings",
		"max_abs_val": null,
		"cat_scale": null,
		"cat_hist": {
			"White": 12
		}
	}
}

JSON.stringify(cat_breakdown,null,'\t')

[
	{
		"type_name": "drug_efficacy",
		"num_in_clust": 1,
		"bar_data": [
			[
				"cat-0",
				"drug_efficacy: None",
				{
					"num_nodes": 1
				},
				"#dbdb8d",
				1,
				null,
				0.6666666666666666
			]
		]
	},
	{
		"type_name": "race",
		"num_in_clust": 1,
		"bar_data": [
			[
				"cat-2",
				"race: Female",
				{
					"num_nodes": 1
				},
				null,
				1,
				null,
				0.75
			]
		]
	},
	{
		"num_in_clust": 1,
		"bar_data": [
			[
				"cat-3",
				**"undefined: White",**
				{
					"num_nodes": 1
				},
				null,
				1,
				null,
				1
			]
		]
	}
]

I think it is related to another manifestation I am seeing in the demo page with similar data:
http://amp.pharm.mssm.edu/clustergrammer/viz_sim_mats/5a81ec1b3a82d369f2be253a/cat_matrix_test.txt
see how 'age' is skipped from the Cluster information categories and the titles shifted:
image

I am working on this bug on my forked version, but I'd rather have your advice.

Thanks,
Richard

Embedded Clustergrammer Error in Firefox and Safari

Hi,

I created a html file containing a clustergram, which can be correctly displayed when opened directly in Chrome/Safari/Firefox.

However, when I embedded the page in another web page, in Chrome and Mobile Safari it looks fine, but there is an Error in Safari and Firefox:

TypeError: d3_window(...).getComputedStyle(...) is null[Learn More] d3.js:739:16 d3_selectionPrototype.style http://localhost/static/clustergrammer/js/d3.js:739:16 calc_viz_dimensions http://localhost/static/clustergrammer/js/clustergrammer.js:13239:26 set_viz_wrapper_size http://localhost/static/clustergrammer/js/clustergrammer.js:13215:19 calc_viz_params http://localhost/static/clustergrammer/js/clustergrammer.js:13011:4 make_params http://localhost/static/clustergrammer/js/clustergrammer.js:2304:13 Clustergrammer http://localhost/static/clustergrammer/js/clustergrammer.js:96:17 make_clust/< http://localhost/static/clustergrammer/js/load_clustergram.js:45:13 d3_xhr_fixCallback/< http://localhost/static/clustergrammer/js/d3.js:2010:7 d3_xhr/xhr.send/< http://localhost/static/clustergrammer/js/d3.js:1995:9 event http://localhost/static/clustergrammer/js/d3.js:504:40 respond http://localhost/static/clustergrammer/js/d3.js:1948:9

Wider space between clusters

Hi,

I am forking Clustergrammer and would like to add a wider space between clusters like this:
image

This should be dynamic as well.
Is it possible to do it 'easily' ?
Could you point me where to begin please.

Thanks,
Richard

Pandas df format for categories

It is not clear what the format of a dataframe should be to enable categories. I tried with a pandas multi index and it doesn't display anything.

send_to_Enrichr function

At Enrichrgram.js line 326, need to change the function name to make it export the gene list to Enrichr.

        //enrich(enrichr_info);
        send_to_Enrichr(enrichr_info);

Clustergrammer Dendrogram JSON Generation

I am trying to integrate clustergrammer into a scientific site by generating the visualization-json file myself and am having trouble understanding how dendrograms are generated. Is there any guidance you can provide regarding the relationships inside the "groups" array that generates the dendrogram relationships?

Visualization-JSON example

Is there an example of a Visualization-JSON file that has all or most possible configurations? I'm specifically wondering about manipulating chart colors without altering the core clustergrammer.js configuration (tile_colors: ['#FF0000', '#1C86EE'], line 567 in clustergrammer.js), as well as manipulating column and row header sizes.

Large row count causes label SVGs to swell and overlap - workaround to prevent timed auto-adjust?

Good afternoon.

I am implementing Clustergrammer to work with genomics data in the NIH-funded Microphysiology Systems Database; this is a fantastic and feature-rich library, but our large datasets are resulting in the below issue.

As soon as the number of rows exceeds a certain amount, the automatic adjustment that row labels undergo after panning/zooming/scrolling causes them to grow, overlap, and eventually conceal all information of use. It continues to scale with row count until nothing is left but a solid black miasma.

Attached are two GIFs depicting the problem - one with a row count of 100, and another with a row count of 300. I would absolutely appreciate being pointed to a solution or spot to customize in the JS; do you have any suggestions?

Cheers and best wishes, and thank you for your work on the tool so far.

ClustergrammerIssue01
ClustergrammerIssue02

Recommend Projects

  • React photo React

    A declarative, efficient, and flexible JavaScript library for building user interfaces.

  • Vue.js photo Vue.js

    ๐Ÿ–– Vue.js is a progressive, incrementally-adoptable JavaScript framework for building UI on the web.

  • Typescript photo Typescript

    TypeScript is a superset of JavaScript that compiles to clean JavaScript output.

  • TensorFlow photo TensorFlow

    An Open Source Machine Learning Framework for Everyone

  • Django photo Django

    The Web framework for perfectionists with deadlines.

  • D3 photo D3

    Bring data to life with SVG, Canvas and HTML. ๐Ÿ“Š๐Ÿ“ˆ๐ŸŽ‰

Recommend Topics

  • javascript

    JavaScript (JS) is a lightweight interpreted programming language with first-class functions.

  • web

    Some thing interesting about web. New door for the world.

  • server

    A server is a program made to process requests and deliver data to clients.

  • Machine learning

    Machine learning is a way of modeling and interpreting data that allows a piece of software to respond intelligently.

  • Game

    Some thing interesting about game, make everyone happy.

Recommend Org

  • Facebook photo Facebook

    We are working to build community through open source technology. NB: members must have two-factor auth.

  • Microsoft photo Microsoft

    Open source projects and samples from Microsoft.

  • Google photo Google

    Google โค๏ธ Open Source for everyone.

  • D3 photo D3

    Data-Driven Documents codes.