This repository contains core material for the 2-day data carpentry workshop. Please see our contribution guidelines before contributing updates, bug fixes, or other corrections.
Data Organization in Spreadsheets for Ecologists
Home Page: https://datacarpentry.org/spreadsheet-ecology-lesson
License: Other
This repository contains core material for the 2-day data carpentry workshop. Please see our contribution guidelines before contributing updates, bug fixes, or other corrections.


We allocate about an hour or an hour and a half to this exercise, but there's currently not enough content to fill that time. Adding to the quality control materials #20 might help, but this is an important point to consider.
We either need to expand the lesson or shorten the allocated time.
The 04-quality control lesson is designed to go through some things in Excel to show how you can do conditional formatting or sorting to look for outliers or mistakes in data.
The Learning Objectives are stated twice - once in the box at the top and then immediately at the top of the lesson.
I don't mind having them twice, but is this what we want to do?
Some potential options:
And I know there are a lot of other options.
In some places it is "Spreadsheets" others "spreadsheets"
@ethanwhite what do you think about adding the messy data file now used in this lesson to the Figshare collection?
https://www.dropbox.com/s/5ncuacnd3arjitc/survey_data_tabs.xls?dl=0
Add glossary terms to reference.md. If there aren't terms that need to be added, delete FIXME.
The current exercise in 01-format-data says that people should clean up the data, but often we just have them identify what's wrong with the messy data. We should maybe update the exercise to reflect that version.
There is language duplicated in the index and 00-intro lesson, but differences in both syntax and wording. I recommend cutting out duplication and leaving in only one place.
LibreOffice should be strongly preferred to OpenOffice, and it's better not to suggest to new users to use OpenOffice at all. OpenOffice is barely able to make an occasional release, has open exploitable bugs (https://lwn.net/Articles/699755/, https://lwn.net/Articles/699050/), and development has in general moved to LO.
Suggestion: drop OpenOffice link from http://www.datacarpentry.org/spreadsheet-ecology-lesson/.
The spreadsheet lesson doesn't have a lot of work for students to do with the instructor. Needs more interactive work, more exercises.
Currently there is a FIXME in the CITATION file. Add information to that file on how to cite.
There is a lot of bolded language the episode files that doesn't seem to make much sense. I recommend dropping the bolding (and the one instance of a word in all caps "HOWEVER" in 00-intro.md).
The page that appears from selecting Extras/reference is titled "Glossary" and appears to be a compendium of the key points from each lesson. Do these key points auto-update if they are changed in the lesson files? Or is this where they should be changed?
There was a paper and a blog post with examples with gene names that where similar to dates and have been converted by excel to dates.
https://nsaunders.wordpress.com/2012/10/22/gene-name-errors-and-excel-lessons-not-learned/
In the Setup page, there is a short description of the dataset used here and in the rest of the ecology lesson. http://www.datacarpentry.org/spreadsheet-ecology-lesson/setup/
Is what is said here OK?
Should we do a fuller description of the data, like here https://github.com/datacarpentry/ecology-workshop/blob/gh-pages/data.md and point to that description?
We have authors and contributors on each lesson. It's likely we should do something else with this information and follow what SWC does.
Take for example the introduction, that links to the topic
That is not right, it should point to this.
The same happens with .csv files, and other links.
A cheatsheet/list of issues with the messy data would be useful for instructors to have.
Some of the small sample files with mistakes in Excel (available via previous commits when the data was still stored in the repo) could be now moved to the data repository. However, these are not ecology specific. Also, since there is now a messy dataset available, maybe these are not needed?
There could be more key points in 01-format-data
merge the contents of https://github.com/datacarpentry/excel-ecology/blob/gh-pages/manage-date-time.md with https://github.com/datacarpentry/excel-ecology/blob/gh-pages/03-dates-as-data.md
And add @acorpuz to the list of contributors.
[submitted by J Gallinger as part of instructor training]
I think the treatment of metadata deserves more space. The additions are pasted or adapted from MANTRA under a creative commons attribution license. I also noticed that most of the social media buttons at the bottom of the lesson page do not go anywhere.
Inclusion of metadata in data table
Example: You add a legend at the top or bottom of your data table explaining column meaning, units, exceptions, etc.
BEFORE
Solution: While recording data about your data ("metadata") is essential, this information should not be contained in the data file itself. Unlike a table in a paper or a supplemental file, metadata (in the form of legends) should not be included in a data file since this information is not data, and including it can disrupt how computer programs interpret your data file. Rather, metadata should be stored as a separate file in the same directory as your data file, preferably in plain text format with a name that clearly associates it with your data file. Because metadata files are free text format, they also allow you to encode comments, units, information about how null values are encoded, etc. that are important to document but can disrupt the formatting of your data file.
AFTER
Solution: Recording data about your data (“metadata”) is essential. You may be on intimate terms with your dataset while you are collecting and analysing it, but the chances that you will still remember that the variable "sglmemgp" means single member of group, for example, or the exact algorithm you used to transform a variable or create a derived one, after a few months, a year, or more are slim.
As well, there are many reasons other people may want to examine or use your data - to understand your findings, to verify your findings, to review your submitted publication, to replicate your results, to design a similar study, or even to archive your data for access and re-use by others. While digital data by definition are machine-readable, understanding their meaning is a job for human beings. The importance of documenting your data during the collection and analysis phase of your research cannot be overestimated, especially if your research is going to be part of the scholarly record.
However, while recording data about your data ("metadata") is essential, this information should not be contained in the data file itself. Unlike a table in a paper or a supplemental file, metadata (in the form of legends) should not be included in a data file since this information is not data, and including it can disrupt how computer programs interpret your data file. Rather, metadata should be stored as a separate file in the same directory as your data file, preferably in plain text format with a name that clearly associates it with your data file. Because metadata files are free text format, they also allow you to encode comments, units, information about how null values are encoded, etc. that are important to document but can disrupt the formatting of your data file.
Additionally, file or database level metadata describes how files that make up the dataset relate to each other; what format are they are in; and whether they supercede or are superceded by previous files. A folder-level readme.txt file is the classic way of accounting for all the files and folders in a project.
(Text adapted from MANTRA).
Figures aren't automatically added to the Extras -> Figures menu. It seems difficult to maintain the list of figures by hand.
This menu item likely isn't used that option, so it might be reasonable to remove that menu option.
At the bottom of 00-intro.md the lessons in the module are listed.
Except for the last two, the names match up with the names on the lesson titles.
The exceptions are:
"Basic quality control and data manipulation in spreadsheets." -- this lesson is titled "quality control"
and
"Exporting data from spreadsheets." -- this lesson is titled "exporting data"
As described in datacarpentry/python-ecology-lesson#45.
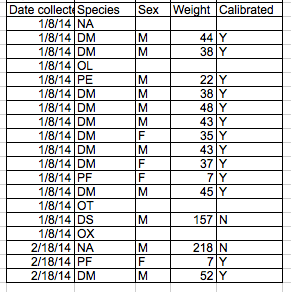
When I open species.csv from the GitHub repo in Excel 2013 (Windows), the cell contents do not appear to be enclosed in quotation marks. Furthermore, when I add a comma in "Rodent-not censused" (as per the exercise) and I save it as .csv with a different name there is no extra column error.
Looking at the species.csv file in a plain text editor, I find that the quotation marks are in fact present. So Excel is masking the quotation marks. The exercise does not work to illustrate the value of adding quotation marks because they are invisible.
In index.md it's not clear what the difference is between "Good data entry practices" and "Overall good data practices".
There are figures in this lesson but they are not included in _extras/figures.
In the "avoid highlighting" section, the "good formatting" example contains at least one metadata row above the table ("Plot: 2").
(fig/good_formatting.pdf)
With the focus of the examples around machine-readability, this sort of thing makes ingest harder as the rows need to be skipped.
I could just be being overly sensitive though having waded through a bunch of spreadsheets recently :)
Under Quality Control > Sorting, a 1980 tab in the messy spreadsheet is referenced. This tab does not exist in the hyperlinked file on Figshare that is associated with the lesson. Is this reference a relic of a past version of the lesson?
Update contact information in _config.yml to go to [email protected]
If I was teaching this lesson, I wouldn't know whether to start with the index.md or 00-intro.md pages. If index.md is considered part of the lesson, instructors should start there and we can get rid of the duplicated information about the topics to be covered on 00-intro.md since these are listed in the schedule already.
Possibly add this info also to the instructor notes.
The file 06-data-formats-caveats.md was originally a lesson, but most of its elements were integrated into other lessons. It is now in _extras/
It should be moved out of there, and perhaps the information put somewhere information put somewhere else. Perhaps some might be good for reference.md.
Greetings everyone,
I'd appreciate your feedback on my current project. We've successfully revised the learning objectives for all of the Ecology lessons to reflect what we are teaching, and now we are in the process of developing surveys to assess our learners (before and after the workshop) on their skills and self-efficacy for the tools they were taught.
Your feedback is extremely valuable. In this document I've added the learning objectives for all of the Ecology lessons. I would appreciate if you'd open this document and add a +1 to the learning objectives you think are most important to assess our learners.
Additionally, I'm scheduling a virtual meeting to review the objectives, discuss your +1's, and come to a consensus. Please provide your availability here.
Our goal isn't to change what we're teaching, but to better understand what we're teaching, and ensure our learning objectives reflect that, so that we can assess our learners.
Thank you for your feedback and your time.
Kari
P.S. Thank you so much to all the maintainers who helped revise the learning objectives!
@tracykteal @lgatto @cbahlai @sedako @fmichonneau @ethanwhite @hlapp @acorpuz @hdashnow @brymz @apawlik @karthik @aNurnberger
Inconsistent wording.
The language for Windows and Linux is: "Once the installer is downloaded, double click on it and LibreOffice should install."
But for Mac OS X it is: "Once the installer is downloaded, double click on this file, and LibreOffice will be installed."
This is probably also the case for other lessons. The link to code of conduct at the top of the rendered lesson page (http://www.datacarpentry.org/spreadsheet-ecology-lesson/conduct/) should go back to the official DC/SWC code of conduct (http://www.datacarpentry.org/code-of-conduct/) or the language from this CoC that is specific to project contribution should be incorporated into our official CoC. We shouldn't have two different CoCs. @PBarmby as head of Policy subcommittee.
When teaching this lesson, 02-common-mistakes is used as a reference, as people identify problems with the messy data, rather than something that instructors get up in the front of the room and discuss. This is noted in the instructor notes, but it would be good to add that information to this file.
At the beginning of each lesson, there's a segment called 'Questions', but the sentences used there are statements rather than questions. Do we want to have statements rather than questions? These also go on the index page.
If we do want statements instead, we should update to something other than 'Questions'.
The layout is not up to date with the newest changes to https://github.com/datacarpentry/lesson-template
Index.md says "This lesson requires a working copy of spreadsheet software, like Microsoft Excel or LibreOffice."
It would be good to include a link to the LibreOffice installer (https://www.libreoffice.org/download/download/) so folks know where to get a copy.
Hi all,
I really appreciate this lesson in particular, and have shared it with lots of other teams! One thing to consider in the "using bad null values" section are the reasons why people use -999 or other non-NA missing value codes. I have done this is in the past with (some) good reasons. In human subjects research (where I work), we need to track and report the reason any value is missing, so I differentiate between active versus passive missing data: active is when missing data is assigned a value (with good and bad options here, but the idea is that we know it is truly missing); passive missing data is data left blank.
Passive missing data is a red flag that we have to go back to the file and figure out what happened. Sometimes we rescue the data and it was just missed in the initial data entry, and sometimes it is actively missing. The problem is, if you use R (like I do) and you use NA as your active missing data code (meaning that data is truly missing), it is difficult to tell active from passive missing data if you read in this kind of data file. I think this is usually why -999 or other values may be used- it is a way to have a placeholder to say "yes this is missing- no detective work required here." But as you guys note, it is dangerous to have those values mixed in with the true non-missing values in the analysis variable.
One way around this problem is to follow your advice for the analysis variable (leaving blank or NA), but add a separate "why is it missing" indicator variable. The values for that variable help track whatever the causes of missing data might be, like 1 = equipment failure; 2 = participant refusal; 3 = examiner error; 4 = file lost; 5 = tears of research assistants blurred the numbers, etc. :) The frequencies of each error need to be reported in the methods section of any later publications. This method does have two main drawbacks: 1) it adds more variables to the dataset and 2) it adds an extra layer of data checking to make sure that each NA value in one column has a reason for it in the other column. This is likely why some folks go with the -999 route.
I know this particular lesson is geared towards ecology and the "why is it missing" problem may not be broadly applicable. I wasn't sure how else to contribute to the discussion, so I'm sorry for the Github issue- if there is a better way please let me know. Other folks in different fields may have different solutions- it would be great to share what works in some forum!
Thanks again for all the wonderful materials-
Alison Hill
[email protected]
On one of the stickies at a recent workshop, a learner asked what were the differences among the options Excel offers when saving CSV files (ms-dos CSV, windows CSV, ...). I think it could be good to briefly mention issues with EOL and different operating systems
It looks like http://www.datacarpentry.org/spreadsheet-ecology-lesson/extras/06-data-formats-caveats.html doesn't have the new template implemented. There are also problems with broken markdown (### that doesn't render as headers), and empty sections ("Tab Separated Values" format and "Other delimiters for data formats" are both empty).
If this is meant to be a usable extension to the lesson it should be formatted and added to the index page as an optional module.
The quality control lesson overall needs some updates (#20)
In that lesson though, we have Pivot Tables. Is that something we should be teaching? It is a very useful Excel skill, and we can tie it to the quality control piece, but it also is starting to do things that would be done more reproducibly in R or SQL.
The data.md file in the ecology-workshop repo includes a lot of information about the dataset used in these exercises. Either point the learner back to that information or include it in the Setup page.
In intro.md
"accidentally apply a calculation to one observation in your dataset but not another unless you’re doing it on purpose."
"accidentally" implies you're not doing it on purpose.
On the 'Spreadsheets for Ecology' page (http://datacarpentry.github.io/spreadsheet-ecology-lesson/), the link to the Quality control lesson (http://www.datacarpentry.org/spreadsheet-ecology-lesson/04-quality-control.html) is down.
The current Code of Conduct menu link goes to http://www.datacarpentry.org/spreadsheet-ecology-lesson/conduct/
Should we add a link to the Data Carpentry Code of Conduct on this page? Or make some other adaptation?
Repo to submit pull requests to is no longer the datacarpentry repo.
Lessons are no longer in subdirectories:
Every lesson has a sub-directory of its own, while individual topics are files in that directory. For example, the lessons/shell directory holding our introduction to the shell contains the files 00-intro.md, 01-filedir.md and so on.
A declarative, efficient, and flexible JavaScript library for building user interfaces.
🖖 Vue.js is a progressive, incrementally-adoptable JavaScript framework for building UI on the web.
TypeScript is a superset of JavaScript that compiles to clean JavaScript output.
An Open Source Machine Learning Framework for Everyone
The Web framework for perfectionists with deadlines.
A PHP framework for web artisans
Bring data to life with SVG, Canvas and HTML. 📊📈🎉
JavaScript (JS) is a lightweight interpreted programming language with first-class functions.
Some thing interesting about web. New door for the world.
A server is a program made to process requests and deliver data to clients.
Machine learning is a way of modeling and interpreting data that allows a piece of software to respond intelligently.
Some thing interesting about visualization, use data art
Some thing interesting about game, make everyone happy.
We are working to build community through open source technology. NB: members must have two-factor auth.
Open source projects and samples from Microsoft.
Google ❤️ Open Source for everyone.
Alibaba Open Source for everyone
Data-Driven Documents codes.
China tencent open source team.