jupyterlab / debugger Goto Github PK
View Code? Open in Web Editor NEWA visual debugger for Jupyter notebooks, consoles, and source files
License: BSD 3-Clause "New" or "Revised" License
A visual debugger for Jupyter notebooks, consoles, and source files
License: BSD 3-Clause "New" or "Revised" License
To be implemented after #42.
Breakpoints set in the UI should be sent over to the debugger all at once (the debugger must be started beforehand).
Since #9 is going to add some tests, we can start thinking about what we want to use to run them automatically.
The 2 main options at the moment seem to be:
Editors should show the line that corresponds to where the execution has stopped.
Something similar to this:

This information can be retrieved from the StackFrame: https://microsoft.github.io/debug-adapter-protocol/specification#Types_StackFrame
How about having the variable search filter return results on substring matches?
So searching for 1 would return test 1:


I was looking into the NotebookActions.executed signal to be able to know when a cell is executed.
However it seems to be triggered after a cell has been executed (after the execute_request message is sent).
Ideally what we would want is:
beforeExecute signal is emitted, send all the messages to initialize the debug sessionexecute_request be sent)While investigating #68 (and testing on master), I noticed that breakpoints are not visible anymore when switching between the expanded and condensed modes:

- Table in Variables need second level when type of variable is class.
- Body of table need have resize with set scrollbar (overflow:auto)
As described in #89:

It looks like the handlers are not removed correctly when switching between notebooks and cells.
Ideally we should be able to resize the "Name" and "Value" columns in the "Variables" table, to be able to read long variable names:

We can create a new tag / branch and update the Binder link to keep a quick "demo preview" around easily accessible.
For now we don't check whether a kernel is ready before sending debug messages.
We should do that check before starting a new session and restoring an existing one. And also handle status changes.
Instead of always restoring to a sidebar, restoration should support either creating a MainAreaWidget<Debugger> or just the sidebar. This issue is dependent on #38 first.
Now that we have the start and stop commands, they can be triggered when clicking on the start / continue and stop buttons.
If a user switches back to a notebook whose code execution was interrupted on a breakpoint, or if she reloads the page while the code execution is interrupted on a breakpoint, what should the behavior be? Should we be able to restore the full state, that is highlight the line where the code stopped, and restore the breakpoints and callstack? Or should we simply restart the debugger (and resume the code execution)?
I think the first behavior (restoring everything) would be a butter user experience, however this requires additional changes in the backend.
i.e., breakpoints.css, callstack.css, variables.css

Now the issue look like that :

The label widget should be private and its contents should come from the title attribute of its parent.
Although most of the Debug Adapter Protocol can be directly used, there is a usecase specific to Jupyterlab that requires an additional message type.
When setting breakpoints, the debugger expects a source path which must refer to a file on disk. Since the cells of a notebook are executed by the interpreter, it not possible to directly set breakpoints in them. The solution is to first require the backend to dump the cell in a file, and then use this file as the source path argument of the setBreakpoints request. This can be achieved with the following additional messages:
Message type: debug_request
content = {
  'type': 'request',
  # Sequence number (also known as message ID).
  # For protocol messages of type 'request' this ID can be used to cancel the request.
  'seq': 'number',
  'command': 'dumpCell',
  'arguments': {
    # Source code of the cell, one or more lines
    'code': str
  }
}
When receiving this request, the backend "computes" a filename, write the content of the cell in it, and returns the name of the file:
Message_type debug_reply
content = {
  'type': 'response',
  # Sequence number of the corresponding request.
  'request_seq': 'number',
  # Outcome of the request
  'success': 'bool',
  'command': 'dumpCell',
  'body': {
    # Name of the file where the cell was dumped
    # Can be used as the 'sourcePath' argument in a 'setBreakpoints' request
    'sourcePath': 'str'
  }
}To be done after #54 is merged.
Quoting #48 (comment):
The Debugger extends BoxPanel class should have an attribute called editors that is a TabPanel of read-only text editors that allow users to add breakpoints
After getting any response we need to create some adapter/service/methods which will modify data for UI.
I am so glad to see jupyterlab will be able to debug code soon, but the readme tells that xeus-python 0.5+ is needed. Must this Prerequisites be satisfied after stable version realesed? I use pip rather than conda env.
When will this feature be released? I can't wait to debug my code.
Thx!
Nothing blocking at all, these are just some questions and thoughts about how internal components should interact.
Now that there is a minimal UI for the debugger, we could start using the DebugSession to send debug requests to the kernel and have a "loop" in place:
Setting breakpoints and sending the configurationDone message to the kernel should happen without manually executing the launch command.
There should be a new command for the continue debug action, so it can be mapped to a keyboard shortcut (F5 in regular IDEs, F8 in the dev tools).
At the moment the gutters and line numbers are being toggled when switching between cells:

It would be better to always keep them on when the debugger sidebar is visible and being used.
We also want to keep the breakpoints set for other cells.
#84 handles when the execution of a cell has continued.
But for now if we click on stop the variables and callstack are still shown:

We've been carrying a reference to an IDataConnector, but without really using it:
Line 89 in 52880b7
The idea was to use it and implement the fetch method to send debug messages to the kernel, similar to the inspector extension.
However since the DebugSession handles the communication to the kernel we probably don't need the connector anymore.
The react-inspector library could be a nice tool to consider to show a tree of variables, that would handle the different scopes ("Locals", "Globals", "builtins") out of the box.
It's being used in the jupyterlab-kernelspy and the jupyterlab-data-explorer extensions.
An example of what it would look like:
The tree (headers, labels) can be customized so we could show the most important information at the higher levels (variable name and value). And end up with something similar to VS Code:

The expanded mode of the debugger should have the debugger sidebar inside a SplitPanel that has a TabPanel as its other pane (to hold read-only text editors for stepping into code).
Adding a quick overview of the debug protocol, so it's easier to visualize the types of messages sent between the JupyterLab extension and the kernel.
It only shows a subset of the messages for now, but can be extended to also include the calls to continue, stepIn and disconnect.
This also show new messages that are not part of the Debug Adapter Protocol (DAP), such as dumpCell.

debug_info_requestGenerated using: https://bramp.github.io/js-sequence-diagrams/
user->JupyterLab: open notebookJupyterLab->kernel: kernel_info_request
kernel->JupyterLab: kernel_info_reply
JupyterLab->JupyterLab: check 'debugger' key
JupyterLab->user: show toggle button\nif 'debugger'
user->JupyterLab: enable debugging
JupyterLab->kernel: debugInfo request
kernel->JupyterLab: debugInfo response
user->JupyterLab: start debugger
JupyterLab->kernel: initialize request
kernel->JupyterLab: initialize response
JupyterLab->kernel: attach request
kernel->JupyterLab: attach response
Note right of kernel: debugger started
user->JupyterLab: add breakpoints\n(click on gutters)
JupyterLab->kernel: dumpCell request
kernel->JupyterLab: dumpCell response
JupyterLab->kernel: setBreakpoints request
kernel->JupyterLab: breakpoints response
JupyterLab->kernel: configurationDone request
kernel->JupyterLab: configurationDone response
user->JupyterLab: execute cell\n(Ctrl-Enter)
JupyterLab->kernel: requestExecute
kernel->kernel: execute code
kernel->kernel: hit breakpoint
kernel-->JupyterLab: stopped event
JupyterLab->kernel: stackTrace request
kernel->JupyterLab: stackTrace response
JupyterLab->user: show current line
JupyterLab->kernel: scopes request
kernel->JupyterLab: scopes response
JupyterLab->kernel: variables request
kernel->JupyterLab: variables response
JupyterLab->user: show variables
user->JupyterLab: step in deleted cell code
JupyterLab->kernel: stepIn request
kernel-->JupyterLab: stopped event
JupyterLab->JupyterLab: search for code matching\nsource path
JupyterLab->kernel: source request
kernel->JupyterLab: source response
JupyterLab->user: show source for current path
Note right of kernel: debug session
user->JupyterLab: disable debugging
JupyterLab->kernel: disconnect request
Note right of kernel: debugger stopped
kernel->JupyterLab: disconnect response
JupyterLab->JupyterLab: clear debugging UI for\nthe notebook
The frontend should be able to request the state of the debugger so it can restore its state after a reload for instance. This implies adding a new message in the debug protocol.
Besides, a cell with breakpoints needs to be dumped to a real file, so that the debugger can break when the execution hits a breakpoint. The current solution is to send the content of the cell to the backend in the dumpCell request, and let the backend compute the hash of this content, and then dump the content to a file whose name contents this hash. Notice that the backend also needs to compute this file name (and therefore, the hash of the content) in the implementation of execute_request to "map" the code of the cell to the file. It is required that the names computed in execute_request and dumpCell match, otherwise the debugger cannot break.
With the current implementation, it is impossible to restore the breakpoints in the frontend after a reload. The frontend needs to ask the kernel which breakpoints were set, and how files map to cells. After in person conversations with @jtpio and @SylvainCorlay, the following solutions are considered:
execute_request.debug_info_request message, or harcoded) and the full state of the debugger can be retrieved with a single request.I think solution 2 should be avoided since it requires modifying the current protocol with additional parameter that makes sense for debugging only. Solution 1 is simpler than solutoin 3 since the hash method is an implementation detail of the backend, however many messages are sent upon reload while solution 3 requires only one request.
Also, since many notebooks can be opened at the same time, it could be useful to "cache" the state and the breakpoints in the DebugSession objects to avoid requesting the backend each time we switch from one notebook to the other (or to a console).
EDIT: reformulated and exposed the three possible solutions
We can add an example notebook to the repo that uses xeus-python as the kernel.
This example notebook wll then be opened when starting Binder.
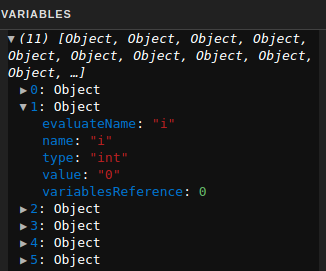
For now classes (and potentially other nested data types) don't have their attributes displayed:

We'll probably need a few extra calls to variables and send the right variablesReference.
As a reference in VS Code:

The variables should be cleared from the sidebar when the exited is received.
Other visual elements should also update accordingly.
Quoting #53 (comment):
the '_isStarted' cache variable in the DebuggerSession object should be updated upon event notification
We can make use of the debug events instead to set _isStarted
At the moment the debugger widget is accessed from the notebooks and consoles plugins via the tracker exposed from the proxy.
A side effect of accessing the widget this way is code that doesn't look natural. Here debug.session is tested twice:
Lines 185 to 193 in b15c240
We should probably keep the proxy as a way to access the (single) instance of the debugger widget (similar to the inspector and completer extensions), but it looks we could change some of the values it proxies?
The FooWidget classes should just be called Foo and they should have a namespace Foo where their model is defined as Foo.IModel.
One thing that the current tslint / prettier configuration is not covering is the automatic sorting of imports.
It doesn't seem to be enforced in the jupyterlab repo either.
Maybe we can consider having that triggered on git commit too.
At the moment if we open the sidebar and then reload the page, the sidebar will be minimized:
It would be great if the sidebar could keep its "open" state on reload.
JupyterLab 1.1.0 final was released yesterday so we can start using it.
Let's replace the fake variables by real ones read from the kernel.
This means implementing the scopes and variables requests.
There is an example of such requests in the tests:
debugger/tests/src/session.spec.ts
Lines 188 to 202 in 23ed40d
Once the interfaces and the overall structure become more stable, it will be useful to start adding tests for the UI elements as well.
This will help us test more complex scenarios and edge cases.
As mentioned in #99 and #99 (comment), the breakpoints actually set by the debugger might not correspond to the ones set in the UI.
For example this is the case when setting a breakpoint on an empty line.
We should read the debug_reply message received after setBreakpoints to retrieve the correct list of breakpoints, and update the breakpoint marks in the editor UI (and the line in the sidebar).
As an example in VS code when the debugger is running:
A declarative, efficient, and flexible JavaScript library for building user interfaces.
🖖 Vue.js is a progressive, incrementally-adoptable JavaScript framework for building UI on the web.
TypeScript is a superset of JavaScript that compiles to clean JavaScript output.
An Open Source Machine Learning Framework for Everyone
The Web framework for perfectionists with deadlines.
A PHP framework for web artisans
Bring data to life with SVG, Canvas and HTML. 📊📈🎉
JavaScript (JS) is a lightweight interpreted programming language with first-class functions.
Some thing interesting about web. New door for the world.
A server is a program made to process requests and deliver data to clients.
Machine learning is a way of modeling and interpreting data that allows a piece of software to respond intelligently.
Some thing interesting about visualization, use data art
Some thing interesting about game, make everyone happy.
We are working to build community through open source technology. NB: members must have two-factor auth.
Open source projects and samples from Microsoft.
Google ❤️ Open Source for everyone.
Alibaba Open Source for everyone
Data-Driven Documents codes.
China tencent open source team.