epiverse-trace / linelist Goto Github PK
View Code? Open in Web Editor NEWR package for handling linelist data
Home Page: https://epiverse-trace.github.io/linelist/
License: Other
R package for handling linelist data
Home Page: https://epiverse-trace.github.io/linelist/
License: Other
Is your feature request related to a problem? Please describe.
A clear and concise description of what the problem is. Ex. I'm always frustrated when [...]
Describe the solution you'd like
A clear and concise description of what you want to happen.
Additional context
Add any other context or screenshots about the feature request here.
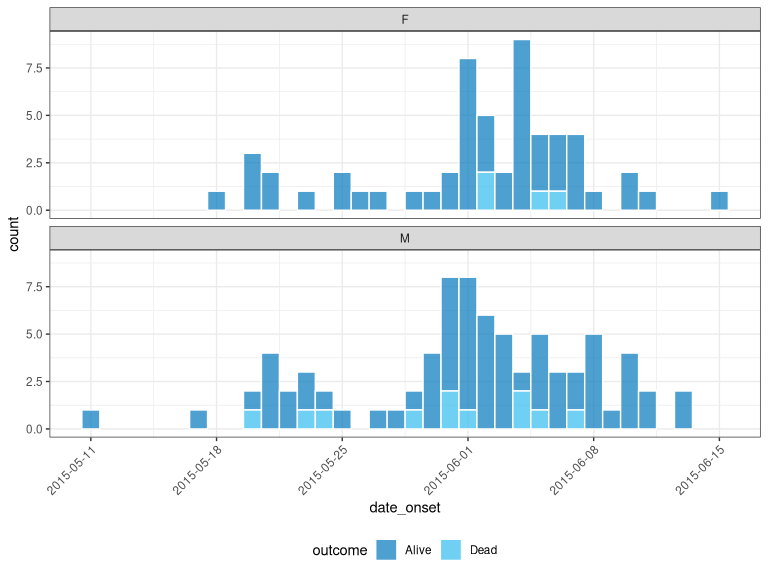
As of reconverse/incidence2@3db823f, you can obtain a slightly nicer plot for the current README:
x_no_geo %>%
  tags_df() %>%
  incidence("date_onset", groups = c("gender", "outcome")) %>%
  plot(
    fill = "outcome",
    angle = 45,
    nrow = 2,
    border_colour = "white",
    legend = "bottom"
  )
See #70 for draft PR for reference.
Hey Thibaut - just read through as popped up on timeline, and had a few thoughts pop up.
We already spoke briefly about this a while back but I like the concept and think is going to be super important to have an implementation like this that allows for generalising script templates (e.g. r4epis).
We also talked briefly about whether a whole new class entirely necessary and thought I would just highlight a few things that would probably make the dev side easier and make it more useful for a wider audience of people:
anyway, long story short - I like the idea and think as a community we should emphasise the importance of data dictionaries and build around that with existing infrastructure, and maybe deemphasise the need for separate class and infrastructure cascade.
Just my two cents though :)
Include:
The NEWS.md document links to #76 for parallelisation of testing but I believe it should instead direct to #77.
While the package is primarily designed for case line list, all features would equally apply to pre-calculated counts. It could be useful to add support for numbers of cases associated to specific date ranges, to be passed to incidence2::incidence(counts = ...).
The action x[[some_var]] <- NULL could possibly delete tagged variables. We need to fool-proof this by adding a dedicated method.
When subsetted by columns, the tags may be altered. We need a procedure to restore the tags whose variables are still present in the output object.
library(linelist)
dat <- data.frame(a=1)
ll <- make_linelist(dat, a = "a", allow_extra = TRUE)
ll["a"]
#> Error in modify_defaults(tags_defaults(), new_tags): Unknown variable types: a
#>   Use only tags listed in `tags_names()`, or set `allow_extra = TRUE`
Created on 2023-04-27 with reprex v2.0.2
I think the issue is that methods need to pass through an appropriate strict argument depending on whether or not extra tags have been allowed
Implement default group to be used by downstream analyses:
Subsetting columns risks dropping tagged variables. Proposed strategy is to implement the common generics for subsetting columns which will silently drop the corresponding tags. This includes:
[,] operator for 2-D objects[] operator for listsselect functionThe trick of passing "error"/"warning"/"none" either as the first or the second argument in lost_tags_action() seems like a hack. I'm afraid this will cause us maintainance issues in the future and will confuse users.
My first reaction would be to remove the option to use it in a pipeline. This is a global option and is not strictly speaking part of the pipeline so I find it confusing to use it here.
If you really want to allow its usage a part of a pipeline, a better option IMO would be to use ... and force the usage of named argument for action
lost_tags_action <- function(..., action = c("warning", "error", "none"),
quiet = FALSE) {This comes from a short slack discussion with @TimTaylor:
Should we support data.frame & tibble subclasses by default or only support classes that we have thoroughly tested with linelist?
One good example of a data.frame subclass that doesn't play well with linelist (because linelist breaks many of its assumptions) is data.table. Support for data.table is now disabled in #55 but it is likely that other data.frame / tibble subclasses will have the same issue and produce an undefined behaviour that doesn't match user expectations.
An extreme measure would be to allow only classes that we are properly, thoroughly tested, i.e., only data.frame and tibble. But then, we could possibly make it difficult for users to use other subclasses that we don't know about and that are strictly compatible with data.frame and tibble, and by extension with linelist.
A fundamental barrier for sharing linelist data for further analysis/processing is the risk of identification of individuals, with substantial ethical and, potentially, legal implications. I wonder if linelist could help mitigate this risk by providing tools for users to help with ensuring none of the data contained is identifiable.
I can see two potential functions that linelist could provide:
Dates can be any numeric values, or a character to be converted as Date. POSIXct / lt should also be acceptable.
The same way we have [[<-.linelist(), to prevent against dropping tagged columns with:
ll$col <- NULLOnce we are able to move ahead the deprecation process in select(tags =) and select_tags()
See worked example for illustration of the issue. Need to fix and add tests
Last month we had a meeting with the HARMONIZE team, where we discussed best ways to link climate and epi data, and identified opportunities for collaboration with Epiverse.
One of the issues that we identified was the lack of wrangling and cleaning tools for aggregated data, which is the most common format for climate data, often the format found for outbreak data (e.g., in situation reports), and therefore the format that would have to be used to merge both types of dataset.
When discussing the overlap between both projects, we realised that there is an existing gap that could be addressed using linelist functionality, namely the tagging and validation feature. HARMONIZE collaborators mentioned that it would be very valuable to extend this feature to tag aggregated data, to prevent the accidental loss of data in spatiotemporal units (e.g., data from a certain location overtime) in the subsequent steps of the analysis.
At the moment linelist only provides functions to handle individual level data, I'm raising this issue here to have a discussion about expanding the functionality of the package to also provide functions for aggregated data
The function validate_linelist() should perform a series of sanity checks on the object:
tagsBuild accessors for all meta data stored in a linelist object:
As we know what tagged variables should contain, we can build assessors for them:
dplyr::rename is a dangerous operation as we risk losing tagged variables by renaming them; ideally we'll capture the inputs and process them to rename tags accordingly, but as a first easier solution we should issue a warning if some tags have changed
Tags provided by default in linelist currently don't include any explanation of their meaning. You can get a list of tags, or their allowed class, but that's it.
library(linelist)

tags_names()
#>  [1] "id"             "date_onset"     "date_reporting" "date_admission"
#>  [5] "date_discharge" "date_outcome"   "date_death"     "gender"
#>  [9] "age"            "location"       "occupation"     "hcw"
#> [13] "outcome"

tags_types()
#> $id
#> [1] "numeric"   "integer"   "character"
#>
#> $date_onset
#> [1] "integer" "numeric" "Date"    "POSIXct" "POSIXlt"
#>
#> $date_reporting
#> [1] "integer" "numeric" "Date"    "POSIXct" "POSIXlt"
#>
#> $date_admission
#> [1] "integer" "numeric" "Date"    "POSIXct" "POSIXlt"
#>
#> $date_discharge
#> [1] "integer" "numeric" "Date"    "POSIXct" "POSIXlt"
#>
#> $date_outcome
#> [1] "integer" "numeric" "Date"    "POSIXct" "POSIXlt"
#>
#> $date_death
#> [1] "integer" "numeric" "Date"    "POSIXct" "POSIXlt"
#>
#> $gender
#> [1] "character" "factor"
#>
#> $age
#> [1] "numeric" "integer"
#>
#> $location
#> [1] "character" "factor"
#>
#> $occupation
#> [1] "character" "factor"
#>
#> $hcw
#> [1] "logical"   "integer"   "character" "factor"
#>
#> $outcome
#> [1] "character" "factor"

tags_defaults()
#> $id
#> NULL
#>
#> $date_onset
#> NULL
#>
#> $date_reporting
#> NULL
#>
#> $date_admission
#> NULL
#>
#> $date_discharge
#> NULL
#>
#> $date_outcome
#> NULL
#>
#> $date_death
#> NULL
#>
#> $gender
#> NULL
#>
#> $age
#> NULL
#>
#> $location
#> NULL
#>
#> $occupation
#> NULL
#>
#> $hcw
#> NULL
#>
#> $outcome
#> NULL
Created on 2023-06-20 with reprex v2.0.2
This change should probably be done by creating a csv file containing the following columns:
The tag_names(), tag_types() and tag_defaults() functions should then be updated to read from this file.
And:
tags argument in select.linelist()select.linelist() as we are now fully compatible with the NextMethod()Lines 116 to 118 in 136efb4
library(linelist)

x <- make_linelist(cars, date_onset = "dist", date_outcome = "speed")

x
#>
#> // linelist object
#>    speed dist
#> 1      4    2
#> 2      4   10
#> 3      7    4
#> 4      7   22
#> 5      8   16
#> 6      9   10
#> 7     10   18
#> 8     10   26
#> 9     10   34
#> 10    11   17
#> 11    11   28
#> 12    12   14
#> 13    12   20
#> 14    12   24
#> 15    12   28
#> 16    13   26
#> 17    13   34
#> 18    13   34
#> 19    13   46
#> 20    14   26
#> 21    14   36
#> 22    14   60
#> 23    14   80
#> 24    15   20
#> 25    15   26
#> 26    15   54
#> 27    16   32
#> 28    16   40
#> 29    17   32
#> 30    17   40
#> 31    17   50
#> 32    18   42
#> 33    18   56
#> 34    18   76
#> 35    18   84
#> 36    19   36
#> 37    19   46
#> 38    19   68
#> 39    20   32
#> 40    20   48
#> 41    20   52
#> 42    20   56
#> 43    20   64
#> 44    22   66
#> 45    23   54
#> 46    24   70
#> 47    24   92
#> 48    24   93
#> 49    24  120
#> 50    25   85
#>
#> // tags: date_onset:dist, date_outcome:speed

dplyr::relocate(x)
#>
#> // linelist object
#>   speed dist
#> 1     4    2
#> 2     4   10
#>
#> // tags: date_onset:dist, date_outcome:speed
Created on 2023-04-18 with reprex v2.0.2.9000
Hi Hugo, I was using linelist to build one of the pipelines for the case studies I'm working on, and I realised that there were some unexpected results, particularly when using the mutate() and filter() functions from dplyr.
I was creating a reproducible example for this when @jamesmbaazam brought to my attention (thanks James for all your help) that there is a wip vignette that talks about this- I think it'd be very useful to bring this information to the forefront for users, so that they don't assume that this is a bug. Also, if this is possible, I think that linelist objects should be made compatible with all dplyr functions, as they are most widely used and taught to public health practitioners.
Let me know what you think, many thanks!
As other ways to updates column names.
Default date to be used in downstream analyses:
This is the base-R version of rename, which we need to implement for linelist with tag restoration feature.
Add templates for:
Create a linelist S3 class, inheriting data.frame.
Current implementation of select is user-friendly but unsafe as tags are not formally differentiated from regular variables. A safer implementation will be to have:
data.frame, i.e. losing the linelist classlinelist, checking that tags are not lost, and renaming tags if tags is usedlinelist offers the ability for users to define their own tags but also include some tags by default.
At the moment, we are not documenting how these default tags have been determined. This raises questions about addition of new tags. For example, the vaccineff package works with linelist data and would benefit from linelist having, e.g., a vaccination_status tag.
We should clarify:
There has been a merge conflict left in the getting started vignette at the following lines: https://github.com/epiverse-trace/linelist/blob/main/vignettes/linelist.Rmd#L189-L204.
To avoid repeated copy of the object in a loop
S3 methods for:
It seems the package {labelled} is doing something very similar to our tagging system. We should consider using it as a backend. Some considerations:
Prepare for release:
git pullurlchecker::url_check()devtools::build_readme()devtools::check(remote = TRUE, manual = TRUE)devtools::check_win_devel()revdepcheck::revdep_check(num_workers = 4)cran-comments.mdgit pushSubmit to CRAN:
usethis::use_version('major')devtools::submit_cran()Wait for CRAN...
usethis::use_github_release()usethis::use_dev_version(push = TRUE)A declarative, efficient, and flexible JavaScript library for building user interfaces.
🖖 Vue.js is a progressive, incrementally-adoptable JavaScript framework for building UI on the web.
TypeScript is a superset of JavaScript that compiles to clean JavaScript output.
An Open Source Machine Learning Framework for Everyone
The Web framework for perfectionists with deadlines.
A PHP framework for web artisans
Bring data to life with SVG, Canvas and HTML. 📊📈🎉
JavaScript (JS) is a lightweight interpreted programming language with first-class functions.
Some thing interesting about web. New door for the world.
A server is a program made to process requests and deliver data to clients.
Machine learning is a way of modeling and interpreting data that allows a piece of software to respond intelligently.
Some thing interesting about visualization, use data art
Some thing interesting about game, make everyone happy.
We are working to build community through open source technology. NB: members must have two-factor auth.
Open source projects and samples from Microsoft.
Google ❤️ Open Source for everyone.
Alibaba Open Source for everyone
Data-Driven Documents codes.
China tencent open source team.