bgi-shenzhen / poplddecay Goto Github PK
View Code? Open in Web Editor NEWPopLDdecay: a fast and effective tool for linkage disequilibrium decay analysis based on variant call format(VCF) files
License: MIT License
PopLDdecay: a fast and effective tool for linkage disequilibrium decay analysis based on variant call format(VCF) files
License: MIT License


Hi, this tool works great on the example chrom 22 vcf (ALL.chr22.phase3_shapeit2_mvncall_integrated_v5a.20130502.genotypes.vcf), but it does not work on mine, which has a slightly different format. When I run it on my vcf, I get a segmentation fault, but no other information. I have uploaded the first few lines of my vcf for you to see (I had to add a .txt extension so that github would accept it).
In my vcf there is no information in the QUAL, FILTER, or INFO columns, could this be the problem? Does PopLDdecay look for some info tag e.g. VT=SNP? Do the variants need IDs? If I know exactly what the tool is looking for then I could modify my vcf to be compatible.
Thanks!
example.vcf.txt
I followed the instruction to make file on MacOS, and an error was issued when I type 'make':
It begun like this:
############
g++  -c  LD_Decay.cpp -o ../bin/LD_Decay.o    -L./include/gzstream/ -L./include/zlib/
clang: warning: argument unused during compilation: '-L./include/gzstream/'
clang: warning: argument unused during compilation: '-L./include/zlib/'
In file included from LD_Decay.cpp:5:
./FileDeal.h:390:1: warning: control may reach end of non-void function
      [-Wreturn-type]
}
^
./FileDeal.h:1221:1: warning: control may reach end of non-void function
      [-Wreturn-type]
}
^
LD_Decay.cpp:220:2: warning: 'delete' applied to a pointer that was allocated
      with 'new[]'; did you mean 'delete[]'? [-Wmismatched-new-delete]
        delete All_Stat ;
        ^
              []
LD_Decay.cpp:203:24: note: allocated with 'new[]' here
        StarRsult *All_Stat = new StarRsult [((paraFA04->InInt)+1)];
                              ^
.................
ld: symbol(s) not found for architecture x86_64
clang: error: linker command failed with exit code 1 (use -v to see invocation)
make: *** [../bin/PopLDdecay] Error 1
################
I don't know where is the problem.
THanks!
Hi @hewm2008,
Thanks for your useful software.
The script is as follows:
PopLDdecay -InVCF all.final.vcf.gz -SubPop "$pop".list -MaxDist 500 -MAF 0.05 -OutType 1 -OutStat "$pop".stat.gz
I would like to ask whether this "maf0.05" is for the selected pop population or for all populations ?
Sincerely,
Ding
Dear PopLDdecay authors,
Currently I am having issues with installing this software. ./configure is outputting a zlib error, saying the version is not compatible.
My current version of zlib is 1.2.11 on Ubuntu20.04. Screenshot describes the issue.


Hi, I am trying to add the non-linear regression tendency line to the Linkage Disequilibrium (LD) plot. I followed the manual document of PopLDdecay and got the plot. However, I am looking to make plot like above where r2 only goes until 0.5 and physical distance until 500 kb.
Got the plot using PopLDdecay.

However,
I am looking the LD plot like this with dots.

Dear @hewm2008,
Could you please share vcf file that you used to test program? I'm trying to use PopLDdecay on my gatk processed vcf file, but it gives empty file. Maybe my vcf files are not in the correct format.
In the off chance you'd like to provide users with access to a containerized version of PopLDdecay, I've recently generated a Singularity container.
The image is housed on Singularity Hub:
https://singularity-hub.org/collections/2877
It can be pulled as follows:
singularity pull shub://jlboat/BioinfoContainers:poplddecay
Or you can edit my original recipe to make your own container (it could probably be improved):
https://github.com/jlboat/BioinfoContainers/tree/master/poplddecay
From my first tries, it seems that what you save in storage (compared to other software) you spend it in RAM.
Do you have some tests that show RAM usage by this tool? Running it on a 71 GB vcf file, 360 individuals and about 7,000,000 SNPs, it can't be run with 8GB of RAM, jobs get killed because it goes out of RAM. Now trying with 64. Any suggestion?
Also, I had a look at your paper and on Table 1 you are saying that Plink can't do this on vcf files directly. This is not true. There is the function --r2 in plink that does exactly this, and then you can plot it in R. Plink also has the function --blocks which let you calculated the LD block size distribution of your dataset. and YES, plink can be run directly on vcf files for a good few years now (flag --vcf)
Finally, sorry for posting here even though it is not a bug. I tried to join your QQ group and downloaded the app. But it is not ideal for Europeans as the app is not in English and I am not able to create an account as I do not understand it.
Hi,
I was wondering how are the confidence intervals calculated for pairwise LD calculation using r^2?
My LD calculation corresponds very well with patterns of genetic diversity and recombination rate, however, I see a very large confidence interval for r^2? What does that mean? Can I trust the r^2 values?
I have 20 unphased chromosomes (10 diploid individuals) for LD calculation so I have used the genotype data.
Thank you!
I am working with pine trees with very long chromosomes.
The largest chromosome has over 2.3G bp long, which cannot be accepted by PLINK and many frequently used programs.
Can this program work with such long chromosomes?
Have you ever tested (or in theory) how long of the chromosomes could be accepted?
I tested with my data. It seems worked well, but how do I know all the data has been read and calculated?
Sorry for asking this. Some programs don't show error message, but over length limit data is not read and processed properly.
when I use a vcf with structure variation, It's warning skip Indel site, there are total skip Indel sites number is : 618346,after filter Remain SNP Number : 0. Does it mean that VCF files with structural variations cannot be used with this software?
I notice that in the github page it said the following analysis was carried out with PopLDdecay.
https://media.nature.com/full/nature-assets/ng/journal/v42/n12/images/ng.715-F1.jpg
But in the manuscript it said the analysis was carried out with Haploview.
It's a little problem and should be clarified, shouldn't it? ;)
Hi!
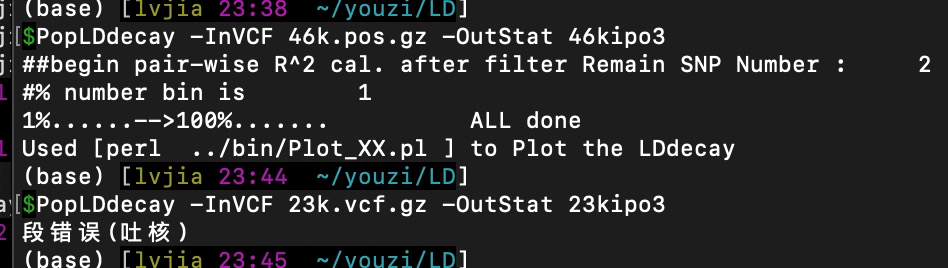
Shortly after running the PopLDdecay script I get some information on the number of SNPs surviving the filters and a percentage number in bin, what does that number refers to, for example
##begin pair-wise R^2 cal. after filter Remain SNP Number : 528325
#% number bin is 5284 What is this?
1%......-->100%....... ALL done
Then I used the perl script to produce the figure as indicated, but when examining the *.bin.gz file it isn't clear for me how where the distance bins constructed? Is it every 10bp or every 100 bps. This is very confusing could you please clarify?
Hi @hewm2008,
Thanks for your useful software.
I notice that there is a spelling mistake in the plot command.
That should be
perl Plot_MultiPop.pl -inList Pop.ReslutPath.list -output Fig
rather than
perl Plot_MutiPop.pl -inList Pop.ReslutPath.list -output Fig
Sincerely,
Jiabo
Hello!
trying to execute the EHH functionality built in PopLDdecay, I tried the following:
PopLDdecay -EHH 1:2750001 -InVCF vcf
And got this message:
lack argument for the must
But it is not very clear what the message means.
Also, can a text file be used to provide the sites?
The code I used was “nohup PopLDdecay -InVCF 74.vcf.gz -MaxDist 100 -MAF 0.1 -Miss 0.2 -OutStat wewLD.stat.gz -SubPop wew.list -OutType 1 1 > o.log 2 > e.log &”,
it will be prompted with “command option error! please check”.
I tried to use simpler code “PopLDdecay -InVCF 74.vcf.gz -OutStat wewLD.stat.gz”, but such mistakes still occured.
I would like to ask for your help and look forward to your answer. Thank you very much.
Hi! @hewm2008
The sub-population has 51 samples and the LD result seems incorrect.
The reads used for mapping were from the assembled genome(Using wgsim).

Thank you for your reply!
Hi all,
Thanks for developing such a useful tool. I am trying to plot the LD along the genome for a bacterial population. So I plan to obtain the vcf using Snippy (with snippy-multi, I would get the core SNPs for the population).
Could you please let me know if PopLDdecay can use this vcf from haploid bacteria?
Thanks and regards,
Xiaojun
Hi,
Thank you for developing this wonderful tool. I have plotted genome-wide LD decay for 9 populations as shown in the attached figure. But I was wondering how would I get something like "LD decay dropping to half of its maximum at XX kb" at a specific r2 value.
Can you please tell me a way to get this measurement? Because the figure does not specifically
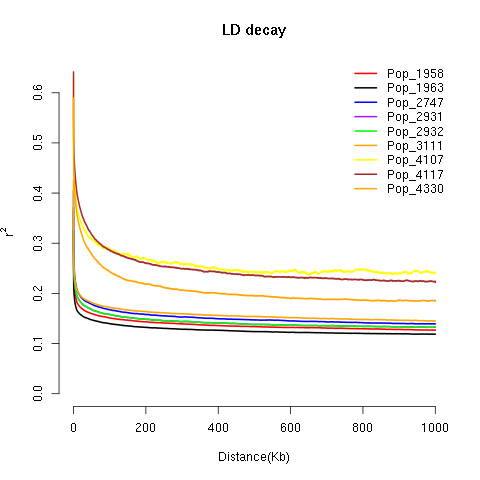
shows the Kb number on the X-axis where the decay stops.
Thank you.
A declarative, efficient, and flexible JavaScript library for building user interfaces.
🖖 Vue.js is a progressive, incrementally-adoptable JavaScript framework for building UI on the web.
TypeScript is a superset of JavaScript that compiles to clean JavaScript output.
An Open Source Machine Learning Framework for Everyone
The Web framework for perfectionists with deadlines.
A PHP framework for web artisans
Bring data to life with SVG, Canvas and HTML. 📊📈🎉
JavaScript (JS) is a lightweight interpreted programming language with first-class functions.
Some thing interesting about web. New door for the world.
A server is a program made to process requests and deliver data to clients.
Machine learning is a way of modeling and interpreting data that allows a piece of software to respond intelligently.
Some thing interesting about visualization, use data art
Some thing interesting about game, make everyone happy.
We are working to build community through open source technology. NB: members must have two-factor auth.
Open source projects and samples from Microsoft.
Google ❤️ Open Source for everyone.
Alibaba Open Source for everyone
Data-Driven Documents codes.
China tencent open source team.