a maptalks | mapbox-gl | openlayers | leaflet | bmap | amap extension to show wind field。
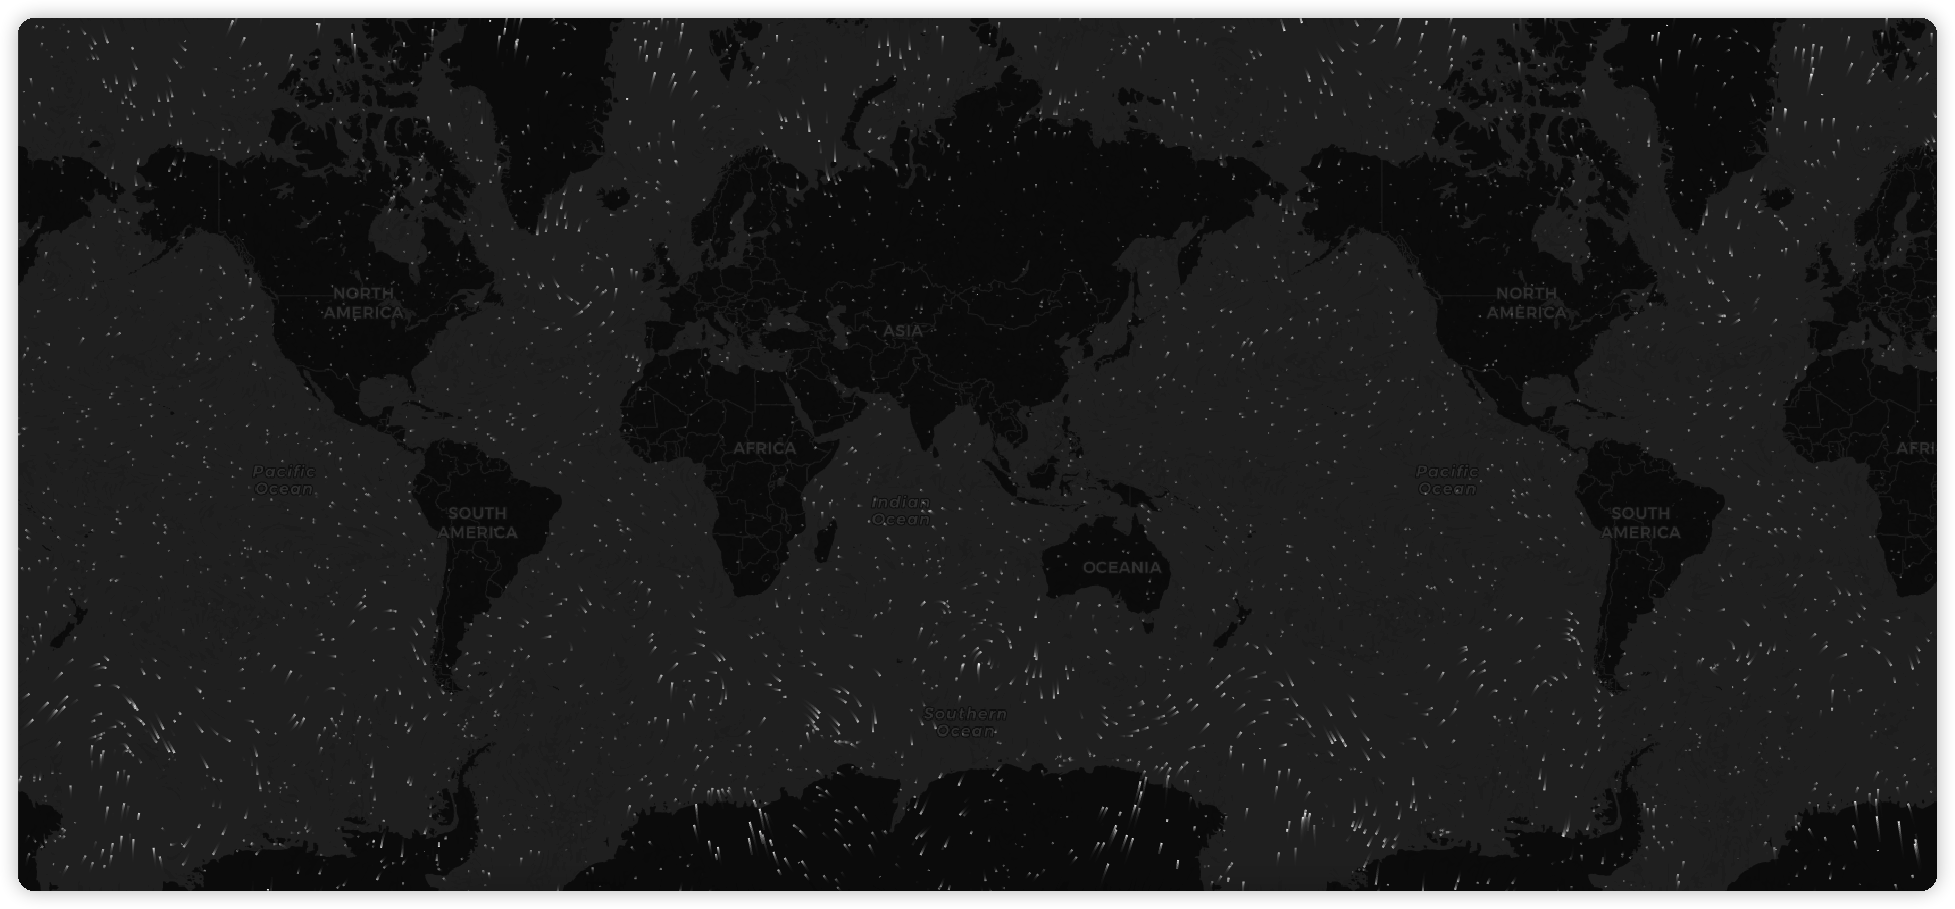
wind-layer 是一个专注于气象格点数据可视的插件,设计之处是参考了 earth cambecc 的一个气象数据的展示,他使用了流体场的方式去展示了全球的风速和风向,富有很强的 表现力, 这个插件的早期的很多核心代码也是来源于此。当然现在它不仅仅是做风场的展示,常规的气象数据都可以依赖此插件进行可视化。
特性 (1.x 通用版本相对于原始 windy.js)
- 易于配置粒子数量,原始 windy.js 只能给定一个系数,会根据地图元素的大小进行计算粒子数量;现在可以支持系数方式和固定粒子数量以及回调函数的的三种方式。
- 颜色配置支持三种方式: String:固定颜色值 Function: 通过回调函数的风速值设定颜色(但是会有一定的性能损失) String[]: 按照风速值范围等间隔渲染,无法做到精确匹配对应值的颜色。
- 线条宽度支持动态设置。
- 抽离了核心渲染库,便于扩展到其他地图渲染库。
gl-core扩展目前只针对 mapbox、maplibre 和 maptalks 做了相关适配,其他引擎适配欢迎 PR。
目前计划支持的图层如下:
- 常规 raster 图层,为了解决多时次瓦片序列播放问题。
- 常规 Image 图层,单张 raster 图层。
- 色斑图渲染,支持瓦片和单张。
- 多数据源支持(geotiff、灰度图-可解析带 exif 信息、png-多通道浮点数压缩)。
- geotiff 的支持需要配置
configDeps,exif默认支持,因为在safari浏览器下configDeps有兼容性问题,所以默认打包了 exif 的解析库。
mapboxWind.configDeps(['https://unpkg.com/geotiff/dist-browser/geotiff.js']);
- geotiff 的支持需要配置
- TimelineSource(时序数据源)支持。
- 粒子渲染,支持瓦片和单张。
- 箭头图层,支持瓦片和单张(矢量数据:风或洋流)。
- 图层拾取。
- 图层掩膜。
TIP: 注意 2.0 之后不再支持 jsonArray 数据和 EPSG:4326 的图片数据,如果有需求请使用 1.x 版本
wind-animation.mp4
animation.mp4
arrow.mp4
poc.mp4
| Project | Version | Npm | CDN | Description |
|---|---|---|---|---|
| wind-core |  |
 |
风场核心渲染,可扩展不可以直接使用 | |
| wind-gl-core |  |
 |
色斑图核心渲染,可扩展不可以直接使用 | |
| ol-wind |  |
 |
openlayers 6+ 风场扩展插件 |
|
| ol5-wind |  |
 |
openlayers 5 风场扩展插件 |
|
| openlayers-wind |  |
 |
openlayers 3/4 风场扩展插件 |
|
| @sakitam-gis/maptalks-wind |  |
 |
maptalks 风场扩展插件 |
|
| amap-wind |  |
 |
高德地图风场扩展插件 | |
| bmap-wind |  |
 |
百度地图风场扩展插件 | |
| mapbox-wind |  |
 |
mapbox-gl 风场扩展插件 | |
| maplibre-wind |  |
 |
maplibre-gl 风场扩展插件 | |
| leaflet-wind |  |
 |
Leaflet风场扩展插件 |
cesium 相关集成请查看 cesium-wind
我们推荐使用 pnpm 或 yarn 的方式进行开发, 不仅可在开发环境轻松调试,也可放心地在生产环境打包部署使用, 享受整个生态圈和工具链带来的诸多好处。
相关插件:
# pnpm
pnpm install wind-core
pnpm install wind-gl-core
pnpm install src-wind
pnpm install ol5-wind
pnpm install openlayers-wind
pnpm install @sakitam-gis/maptalks-wind
pnpm install amap-wind
pnpm install bmap-wind
pnpm install leaflet-wind
pnpm install @sakitam-gis/mapbox-wind
pnpm install @sakitam-gis/maplibre-wind

# yarn
yarn add wind-core
yarn add wind-gl-core
yarn add src-wind
yarn add ol5-wind
yarn add openlayers-wind
yarn add @sakitam-gis/maptalks-wind
yarn add amap-wind
yarn add bmap-wind
yarn add leaflet-wind
yarn add @sakitam-gis/mapbox-wind
yarn add @sakitam-gis/maplibre-wind在浏览器中使用 script 标签直接引入文件,并使用全局变量。
我们在仓库发布包内的 dist 目录下提供了 xxx.js 以及 xxx.min.js;
基础使用可以分为三步:
- 引入相应的
WebGIS地图类库,引入对应的可视化图层扩展插件。 - 正常初始化一个地图。
- 创建一个
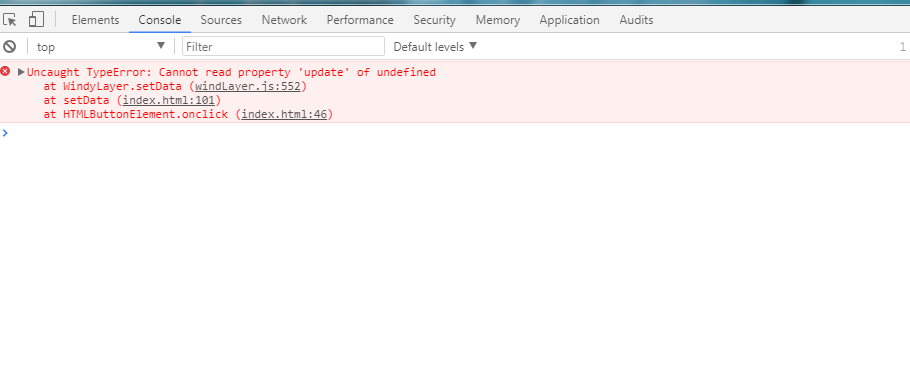
WindLayer,设置风场格点的U V数据和图层参数 并添加到地图上。
以下以 maptalks 为例:
<template>
  <div class="demo-content">
    <div class="demo-content-datgui"></div>
    <div class="map-warp" ref="map"></div>
  </div>
</template>
<script>
  import 'maptalks/dist/maptalks.css';
  import {
    Map,
    TileLayer,
  } from 'maptalks';

  import { WindLayer } from 'maptalks-wind';

  export default {
    name: 'maptalks-wind-base',
    data() {
      return {};
    },
    watch: {},
    methods: {
      initMap() {
        const map = new Map(this.$refs.map, {
          center: [113.53450137499999, 34.44104525],
          zoom: 3,
          baseLayer: new TileLayer('base', {
            urlTemplate: '//{s}.basemaps.cartocdn.com/dark_all/{z}/{x}/{y}.png',
            // urlTemplate: 'https://{s}.basemaps.cartocdn.com/light_all/{z}/{x}/{y}.png',
            subdomains: ['a', 'b', 'c', 'd'],
          })
        });

        fetch('/data/wind.json')
          .then(res => res.json())
          .then(res => {
            const windLayer = new WindLayer('wind', res, {
              windOptions: {
                // colorScale: scale,
                velocityScale: 1 / 20,
                paths: 5000,
                // eslint-disable-next-line no-unused-vars
                colorScale: [
                  "rgb(36,104, 180)",
                  "rgb(60,157, 194)",
                  "rgb(128,205,193 )",
                  "rgb(151,218,168 )",
                  "rgb(198,231,181)",
                  "rgb(238,247,217)",
                  "rgb(255,238,159)",
                  "rgb(252,217,125)",
                  "rgb(255,182,100)",
                  "rgb(252,150,75)",
                  "rgb(250,112,52)",
                  "rgb(245,64,32)",
                  "rgb(237,45,28)",
                  "rgb(220,24,32)",
                  "rgb(180,0,35)"
                ],
                // colorScale: scale,
              },
              // map: map,
              // projection: 'EPSG:4326'
            });

            console.log(map, windLayer);

            map.addLayer(windLayer);
          });
      }
    },
    mounted() {
      this.initMap();
    },
  };
</script>

<style lang="less">
  .demo-content {
    width: 100%;
    height: 100%;
    position: relative;
    background-color: #cbe0ff;
    &-datgui {
      position: absolute;
      top: 10px;
      left: 10px;
      z-index: 1;
      pointer-events: auto;
    }

    .map-warp {
      width: 100%;
      height: 100%;
    }
  }
</style><!DOCTYPE html>
<html>
<meta charset="UTF-8">
<meta name="viewport" content="width=device-width, initial-scale=1">
<title>Map - Display a map</title>
<link rel="stylesheet" href="https://cdn.jsdelivr.net/npm/maptalks/dist/maptalks.css">
<style type="text/css">
html, body {
margin: 0;
height: 100%;
width: 100%
}
.container {
width: 100%;
height: 100%
}
</style>
<body>
<div id="map" class="container"></div>
<script src="https://cdn.jsdelivr.net/npm/maptalks/dist/maptalks.min.js"></script>
<script src="https://cdn.jsdelivr.net/npm/@sakitam-gis/maptalks-wind/dist/maptalks-wind.js"></script>
<script>
const map = new maptalks.Map('map', {
center: [113.53450137499999, 34.44104525],
zoom: 5,
baseLayer: new maptalks.TileLayer('base', {
// urlTemplate: 'https://{s}.basemaps.cartocdn.com/dark_all/{z}/{x}/{y}.png',
urlTemplate: 'https://{s}.basemaps.cartocdn.com/light_all/{z}/{x}/{y}.png',
subdomains: ['a', 'b', 'c', 'd'],
})
});
fetch('data.json')
.then(res => res.json())
.then(res => {
const windLayer = new MaptalksWind.WindLayer('wind', res, {
windOptions: {
// colorScale: (m) => {
// // console.log(m);
// return '#fff';
// },
colorScale: [
"rgb(36,104, 180)",
"rgb(60,157, 194)",
"rgb(128,205,193 )",
"rgb(151,218,168 )",
"rgb(198,231,181)",
"rgb(238,247,217)",
"rgb(255,238,159)",
"rgb(252,217,125)",
"rgb(255,182,100)",
"rgb(252,150,75)",
"rgb(250,112,52)",
"rgb(245,64,32)",
"rgb(237,45,28)",
"rgb(220,24,32)",
"rgb(180,0,35)"
],
// velocityScale: 1 / 20,
// paths: 5000,
frameRate: 16,
maxAge: 60,
globalAlpha: 0.9,
velocityScale: 1 / 30,
// paths: 10000,
paths: () => { // can be number or function
const zoom = map.getZoom();
return zoom * 1000;
},
},
});
console.log(map, windLayer);
map.addLayer(windLayer);
});
</script>
</body>
</html>文档请移步 正在完善中......
天气数据由全球预报系统(GFS)生成, 由美国国家气象局管理。 预测每天产生四次,并可用于 从NOMADS下载。 这些文件位于GRIB2 格式并包含超过300条记录。 我们只需要这些记录中的一小部分就可以在特定的等压线上可视化风资料。 下面的命令下载 1000 hPa风向量,并使用grib2json将它们转换为JSON格式。
YYYYMMDD=<a date, for example: 20140101>
curl "http://nomads.ncep.noaa.gov/cgi-bin/filter_gfs.pl?file=gfs.t00z.pgrb2.1p00.f000&lev_10_m_above_ground=on&var_UGRD=on&var_VGRD=on&dir=%2Fgfs.${YYYYMMDD}00" -o gfs.t00z.pgrb2.1p00.f000
grib2json -d -n -o current-wind-surface-level-gfs-1.0.json gfs.t00z.pgrb2.1p00.f000
cp current-wind-surface-level-gfs-1.0.json <earth-git-repository>/public/data/weather/current
对于 2.x 版本的数据格式我们可以使用 https://github.com/sakitam-gis/raster-process 来生成所需要的瓦片和单张图片。
- https://github.com/cambecc/earth
- http://earth.nullschool.net
- https://github.com/Esri/wind-js
- https://github.com/danwild/wind-js-leaflet
- https://github.com/IHCantabria/Leaflet.CanvasLayer.Field
- https://github.com/mapbox/webgl-wind
- https://github.com/astrosat/windgl

![dependabot[bot] avatar](https://avatars.githubusercontent.com/in/29110?v=4 "dependabot[bot]")

![github-actions[bot] avatar](https://avatars.githubusercontent.com/in/15368?v=4 "github-actions[bot]")