Comments (19)
 sakitam-fdd
commented on May 9, 2024
sakitam-fdd
commented on May 9, 2024
@ranmao 收到,能否提供一下范围和原始数据
from wind-layer.
 ranmao
commented on May 9, 2024
ranmao
commented on May 9, 2024
@sakitam-fdd sakitam-fdd 这个问题是原始数据问题,已经解决。
但是现在出现另外的问题。
我使用netcdf文件直接使用matplotlib和zyGrib软件绘制出来的风场图的方向和js绘制出来的方向完全不一样,我对比了生成的json和NC文件的lon,lat,U、V数据是一致的,但是前台js绘制就乱了。
如果方便可以联系我[email protected]。
后端matplotlib绘制的

zyGrib绘制的

前端JS渲染的

原始文件和绘制代码
素材.zip
from wind-layer.
sakitam-fdd
commented on May 9, 2024
@ranmao 收到,我先查一下
from wind-layer.
ranmao
commented on May 9, 2024
@sakitam-fdd 有点奇怪,用你官网的json文件,正常显示,我抓了真气网的json,显示就和它不一致了。
from wind-layer.
ranmao
commented on May 9, 2024
问题找到了,你js代码里面 获取原生数据网格的下标取反了
from wind-layer.
sakitam-fdd
commented on May 9, 2024
@ranmao 能具体说一下嘛,谢谢,或者你可以在 0.1.x 给一个具体的 pull request,我们可以讨论它
from wind-layer.
ranmao
commented on May 9, 2024
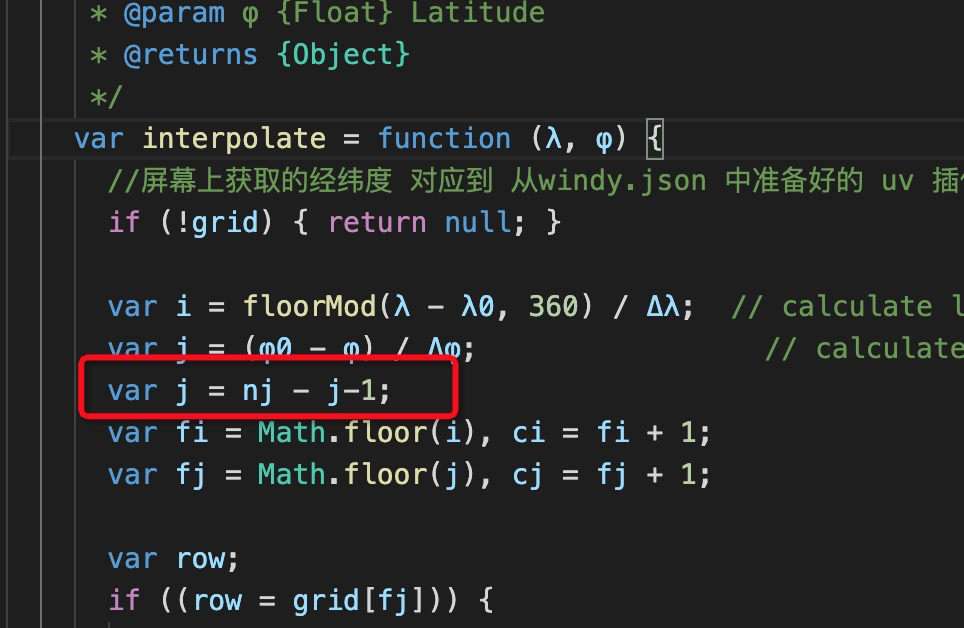
@sakitam-fdd 就是这里,获取维度的网格值这里,修正后就和后端绘图结果一致了
from wind-layer.
sakitam-fdd
commented on May 9, 2024
const λ0 = header.lo1;
const φ0 = Math.max(header.la2, header.la1);  // the grid's origin (e.g., 0.0E, 90.0N)

const Δλ = header.dx;
const Δφ = header.dy;    // distance between grid points (e.g., 2.5 deg lon, 2.5 deg lat)

const ni = header.nx;
const nj = header.ny;    // number of grid points W-E and N-S (e.g., 144 x 73)

const grid = [];

var interpolate = function (λ, φ) {
  const lon = λ; // 经度
  const lat = φ; // 纬度

  if (!grid) return null;
  // 主要用于查找对应经纬度对应格点数据的位置(网格值)
  const i = floorMod(lon - λ0, 360) / Δλ;  // calculate longitude index in wrapped range [0, 360)
  const j = (φ0 - lat) / Δφ;                 // calculate latitude index in direction +90 to -90
  // j = nj - j - 1; 理论来讲这个地方是将位置翻转,但是我猜测应该是生成数据的纬度方向值反了
  // 可看做以下代码
  // let i = floorMod(lon - this.xmin, 360) / this.deltaX;
  // let j = (this.ymax - lat) / this.deltaY;

  const fi = Math.floor(i);
  const ci = fi + 1;
  const fj = Math.floor(j);
  const cj = fj + 1;

  // var row;
  // if ((row = grid[fj])) {
  //   var g00 = row[fi];
  //   var g10 = row[ci];
  //   if (isValue(g00) && isValue(g10) && (row = grid[cj])) {
  //     var g01 = row[fi];
  //     var g11 = row[ci];
  //     if (isValue(g01) && isValue(g11)) {
  //       // All four points found, so interpolate the value.
  //       return builder.interpolate(i - fi, j - fj, g00, g10, g01, g11);
  //     }
  //   }
  // }
  // return null;
};
我看了一下你的数据,你现在对代码做翻转应该是对的

我这边使用的是这个 java 的一个jar包做的解析 https://github.com/cambecc/grib2json ,具体源码我没看过,可能他内部做了什么处理
from wind-layer.
ranmao
commented on May 9, 2024
我也是使用的grib2json这个开源软件,所以解析出来的数据都是一样的;另外我将grib2json生成的json 数据,copy到matplotlib中进行绘制和直接读取nc文件绘制的结果是一样的。结论应该是有个维度反了吧
from wind-layer.
sakitam-fdd
commented on May 9, 2024
@ranmao 对比了一下数据,发现同样程序抓取的grib文件一个是去年十一月份抓取的数据(右侧),一个是今天抓取的数据(左侧),结果差异比较大:
- 数据精度没有之前精细
- 整体图像需要旋转360度才是正确的
猜测可能是数据有变动

from wind-layer.
ranmao
commented on May 9, 2024
@sakitam-fdd 你绘制的这个rgb 图是用什么工具?我一直在模仿windy.com,他是后端传递的颜色图,前端插值渲染的,你这个图很像windy后端生成的图像,这是什么技术生成的呢?他这个图片顶部还加了经纬度,采集时间这些信息的

from wind-layer.
sakitam-fdd
commented on May 9, 2024
@ranmao 这个node的 pngjs、sharp, python 的 rasterio都可以做这个,简单来讲就是图片一般有四个通道 r/g/b/a 向不同的通道存值就行了,具体可以看下 mapbox/webgl-wind, 而且不用去仿windy,他的技术方案并没有做到最优,还有不少问题,用合适的方案解决自己对应场景就行了
from wind-layer.
ranmao
commented on May 9, 2024
@sakitam-fdd 我这块不仅仅是风场,还有温度,辐射等数据,如果后台绘制原始数据的rgb图片,前端js进行插值,绘制,原理和风场一样,根据屏幕分辨率进行插值计算绘制,后端服务器压力要小,数据传输效率也挺高的。我现在就是后端绘制插值后的高清图,后端绘制时间长,文件大,传输到web端直接显示,但是传输效率低,后端生成效率低。
from wind-layer.
sakitam-fdd
commented on May 9, 2024
@ranmao 这块数据传输可以考虑切片,参考windy。数据处理这块可以看下webworker和gpu.js,渲染这块可以直接上webgl了,纹理渲染这块不是很复杂,或者插值也可以放到shader里,仅供参考
from wind-layer.
ranmao
commented on May 9, 2024
@sakitam-fdd 大神,这个图片用什么具体的工具或者是类库来生成的?我用下载了全球的数据,matplotlib imshow,直接崩溃了,我现在想做一些验证,需要对比,能否告诉我?

from wind-layer.
sakitam-fdd
commented on May 9, 2024
@ranmao 使用node或者python都可以做,目前没有最小范例哈,等过几天闲下来我写一个
from wind-layer.
 luqinghui
commented on May 9, 2024
luqinghui
commented on May 9, 2024
@sakitam-fdd 小白提问,大神用的这个软件叫什么啊,谢谢

from wind-layer.
sakitam-fdd
commented on May 9, 2024
@link https://github.com/sakitam-fdd/wind-layer/tree/master/py-server
from wind-layer.
 huashengmingtian
commented on May 9, 2024
huashengmingtian
commented on May 9, 2024
移动地图时 风向动画展示的非常混乱,需等待一会儿才能正常,请问有知道这个问题怎么解决的吗
from wind-layer.
Related Issues (20)
- maptalks-wind adding gl rendering mode HOT 1
- 色斑图必须采用图片吗? HOT 4
- OpenLayers 绘制色斑图 HOT 2
- 风流场渲染之后,其他的交互会导致其重新渲染,底图加载也是如此😂😂😂😂 HOT 4
- ol-wind, setData报错 HOT 2
- The mapbox-wind cannot be rendered using 'jsonArray'. HOT 4
- maptalks版本依赖问题 HOT 1
- The mapbox-wind's particles and scalarFill layer cannot overlap with each other HOT 3
- wind layer bounds decrease as zoom increases HOT 8
- 色斑图错位 HOT 7
- 气象上的windbarb是否支持 HOT 1
- When mapbox loads windlayer, it ends at 180 degrees east longitude HOT 1
- ol-wind加载流场 在隐藏图层/显示图层 后流场的流动效果停止 HOT 2
- 粒子绘制过程中会产生轨迹残留,影响视觉效果,如何解决呢。求助,急!!! HOT 1
- 移动端没有适配 HOT 1
- openlayers 叠加色斑图 HOT 1
- 风场在跨东经180度时断开 HOT 1
- 高德api2.0版本报错 HOT 1
- 高德地图报错
- 高德2.0报错,什么时候更新对2.0的支持?报错信息如下: HOT 3
Recommend Projects
-
 React
React
A declarative, efficient, and flexible JavaScript library for building user interfaces.
-
Vue.js
🖖 Vue.js is a progressive, incrementally-adoptable JavaScript framework for building UI on the web.
-
 Typescript
TypeScript is a superset of JavaScript that compiles to clean JavaScript output.
-
TensorFlow
An Open Source Machine Learning Framework for Everyone
-
Django
The Web framework for perfectionists with deadlines.
-
 Laravel
A PHP framework for web artisans
-
D3
Bring data to life with SVG, Canvas and HTML. 📊📈🎉
-
Recommend Topics
-
javascript
JavaScript (JS) is a lightweight interpreted programming language with first-class functions.
-
web
Some thing interesting about web. New door for the world.
-
server
A server is a program made to process requests and deliver data to clients.
-
Machine learning
Machine learning is a way of modeling and interpreting data that allows a piece of software to respond intelligently.
-
Visualization
Some thing interesting about visualization, use data art
-
Game
Some thing interesting about game, make everyone happy.
Recommend Org
-
Facebook
We are working to build community through open source technology. NB: members must have two-factor auth.
-
Microsoft
Open source projects and samples from Microsoft.
-
Google
Google ❤️ Open Source for everyone.
-
Alibaba
Alibaba Open Source for everyone
-
D3
Data-Driven Documents codes.
-
Tencent
China tencent open source team.
from wind-layer.