Code Monkey home page Code Monkey logo

hhs_dashboard's Introduction

Household Survey (HHS) Dashboard

The HHS Dashboard is an R package called { rarehhs }

To install for development

  1. Make sure you have { devtools } installed
  2. Use git to pull the repository
  3. In RStudio you can use CMD-SHIFT-L or devtools::load_all() to load the package
  4. Then use run_app() to launch the app (note, do not use runApp() use run_app())

To install for use

Since this is a private repository, the user will need an auth_token from https://github.com/settings/tokens.

remotes::install_github("Rare-Technology/HHS_Dashboard", auth_token = '')

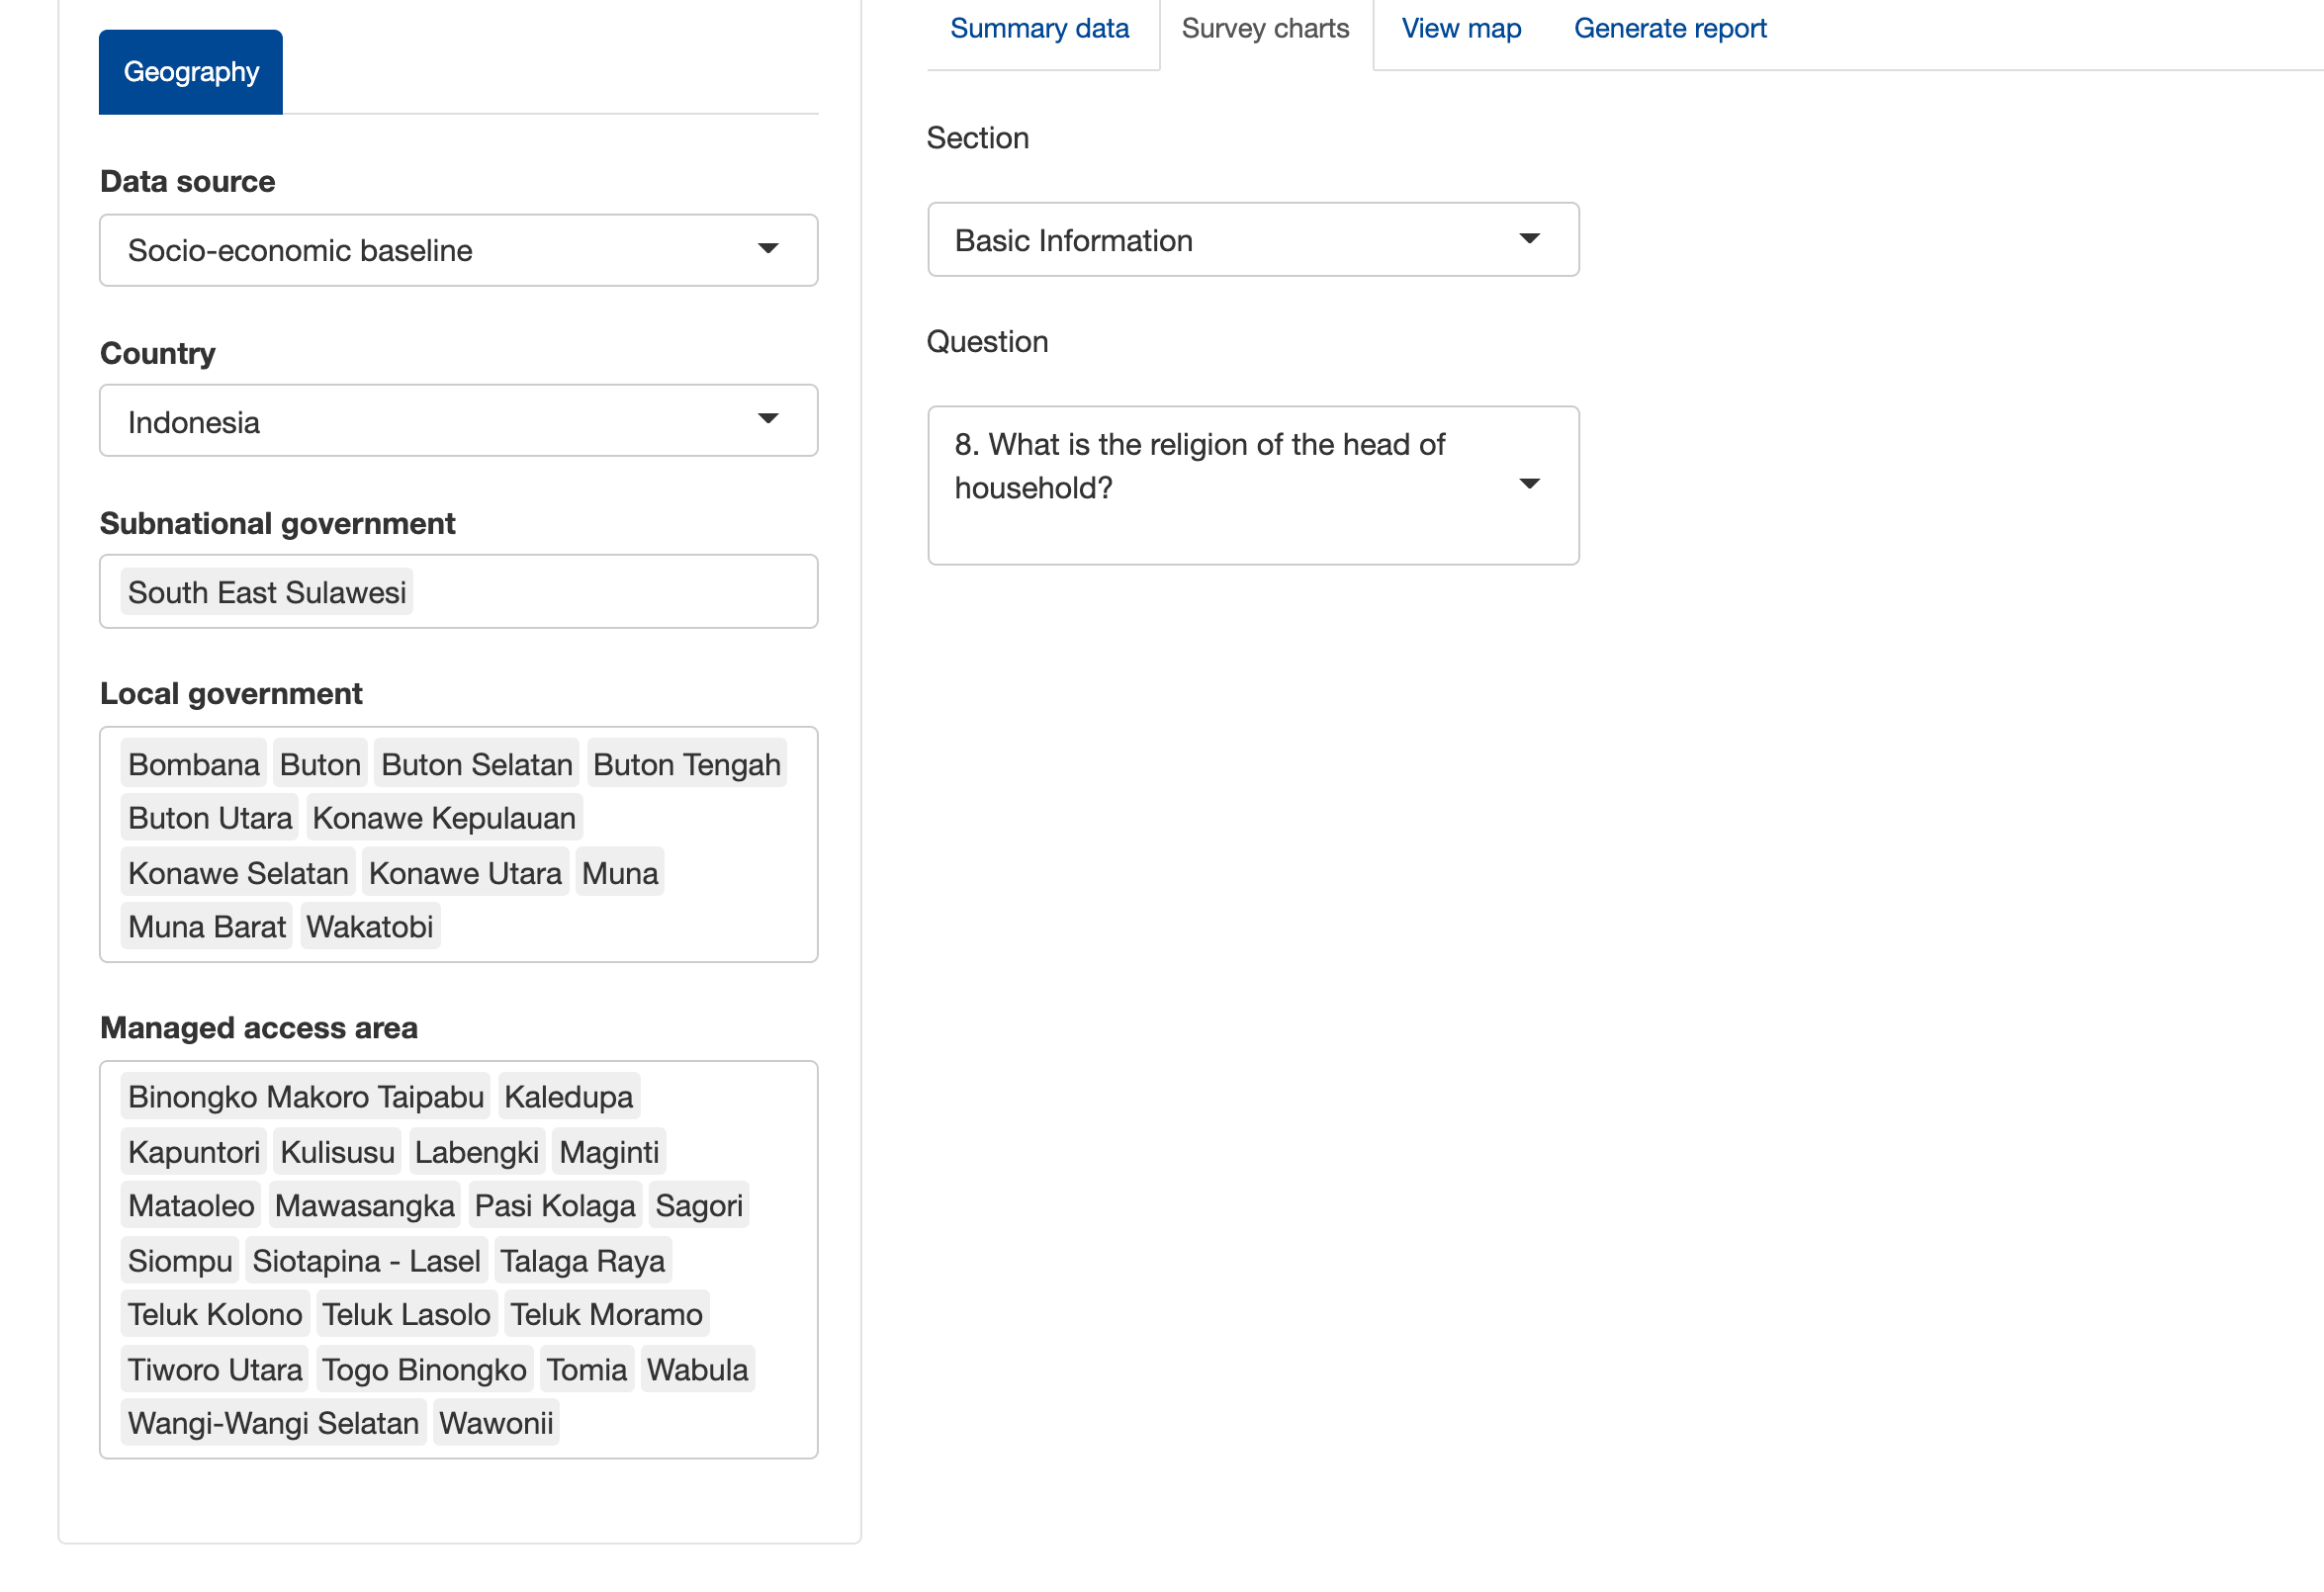
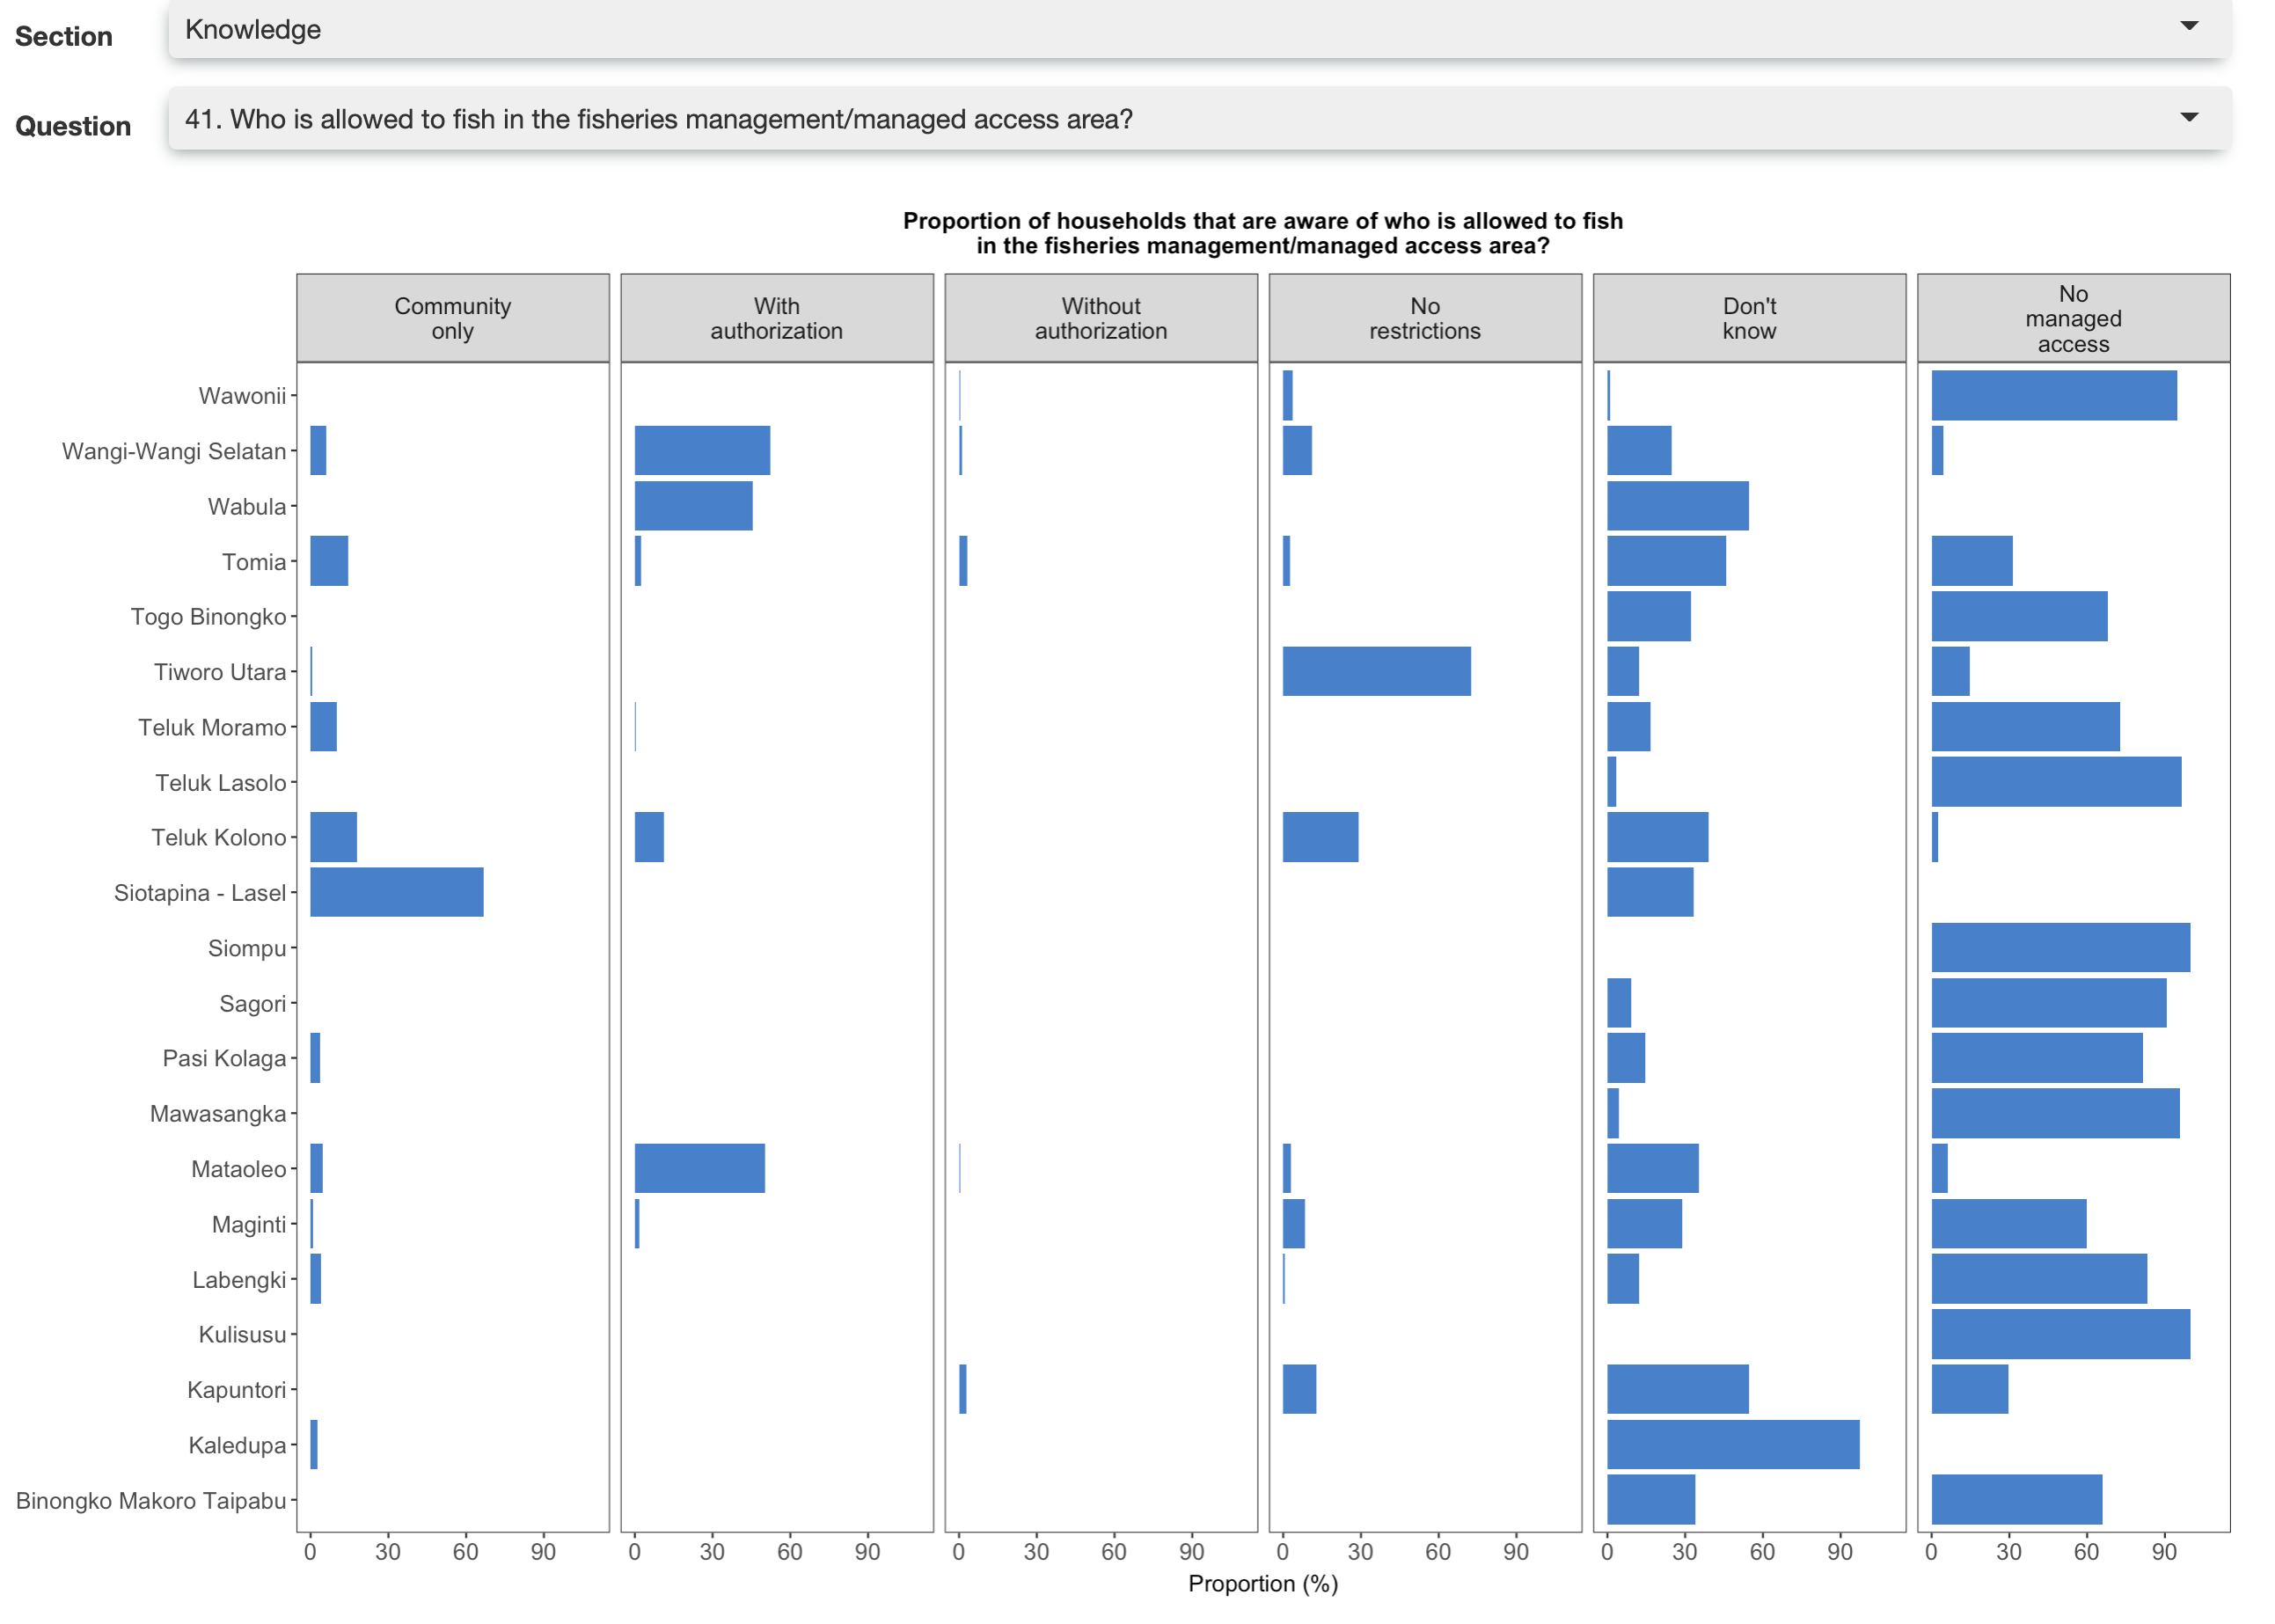
https://portal.rare.org/en/tools-and-data/household-survey-data/

Note on original app version

The original app created by Abel is in an unrelated branch called abels_original_app

hhs_dashboard's People

Contributors

ibidyouadu avatar saradelessio avatar zross avatar

Watchers

 avatar

Forkers

marianoviz

hhs_dashboard's Issues

Make the selectors inline with label

@SaraDeLessio can you give me the CSS to make the labels inline with the selectors, make the text the same font as the selectors and make the selectors go the full width of the page (perhaps the first selector will look odd full-width) but let's see.

Unless you have a better idea

image

Plots 61 are off by one correct?

@abelvaldivia starting with 61e the else if part of your code does not match your selected variable. Below is an example. You can see else if refers to 61e but the variable selected is 61f. Is this a mistake?

If it's a mistake, there there is one plot missing. 61e is not there since it jumps to 61f.

      else if (input$hhs_question == "61e. Please state your level of agreement with the following statement: Access rights to the managed access area have been distributed fairly to fishers") {
         
         hhs_Q61f <- selectedData()[,c("ma_name", "61f_rights_distribution_fair")] %>%
                           filter(`61f_rights_distribution_fair` %in% c(1:5)) %>%
                              rbind(c(NA,1),c(NA,2),c(NA,3),c(NA,4),c(NA,5))

How to handle 15_activity for plotting?

@Court78 I'm working on #12 but each question probably needs its own issue. I'm starting with 15.

In 15_activity there are 1678 different activities. In many cases "different" activities are just spelling or punctuation differences. Below are a few examples.

You requested that I use "multi answer, bar, mean" but I'm not sure what this means. In looking at the data I wonder if the following would be best:

  1. Make everything lower case
  2. Identify the top 5 activities
  3. Create a faceted bar plot where the facets are the 5 activities

Below I'm showing the top 10 (lower case) activities to give you a sense.

 [987] "memasak"                                                                                   
 [988] "Memasak"                                                                                   
 [989] "MEMASAK"                                                                                   
 [990] "memasak dan mencuci"                                                                       
 [991] "memasak ikan"                                                                              
 [992] "memasak keluarga"                                                                          
 [993] "memasak untuk karyawan koperasi"                                                           
 [994] "memasak untuk keluara"                                                                     
 [995] "memasak untuk keluarga"                                                                    
 [996] "Memasak untuk keluarga"
 1 memasak                      157
 2 keeping the house            138
 3 cooking for family           128
 4 berkebun                     127
 5 farming                      126
 6 agricultura                  116
 7 menjual ikan                 116
 8 merawat anak                 106
 9 caring for children           91
10 labor                         87

Remove invalid ages

@Court78 in the queries for 7_age you should remove invalid ages. I'm handling this in the app right now so no hurry. There are values of 1975, 2001 etc, I assume these are birth years.

Consistency of HHS data, variable 70_hh_average_income

@abelvaldivia I'm creating a spec for the input HHS data and am moving away from factors, partly as a way to drop all the as.numeric(as.character calls.

For variable 70_hh_average_income I'm seeing that it's treated as a factor by data.table but that nearly all the values are numbers. And in the app you call as.numeric(as.character.

There are values in one file (HND) like "2500-5000 L". I'm not seeing these handled any special way so it seems that about half of HND values are become NA. Is this the way it should be?

Plots not being used?

@abelvaldivia I'm seeing a few plots from the old app that are not in the hhs questions file. Like q45 about leadership positions and two numbered 44 about meetings. Should these be dropped?

Q18 Mozambique

Repeats in answer choices. For instance, 3-4 per week and 3-4 times per week.

Renaming geo levels?

@abelvaldivia in the FMA app I used the geographic renaming below so it's clearer what they are, but I'm wondering if perhaps this is a bad idea and I should avoid for HHS? Opinion?

    country,
    iso3 = country_code,
    subnational = level1_name,
    subnational_id = level1_id,
    local = level2_name,
    local_id = level2_id,
    maa = ma_name,
    maa_id = ma_id,

How to handle 20_gear for plotting

@Court78 related to the new plot for question 20. There are 7 gear-related questions. I think what I should do is:

  1. For each of the MAA/gear types tally the total number of responses
  2. Compute the proportion of responses that used that gear
  3. Show a faceted plot with each facet being one of the 7 gear types

So an example would be for "gear hand" for Melekeok, I would tally the total number of non-NA responses (so how many 0 or 1) for the denominator. Then tally the number of 1 values and use this as the numerator.

Do I have this correct?

"20a_gear_hand"                    "20b_gear_stationary_net"         
"20c_gear_mobile_net"              "20d_gear_stationary_line"        
"20e_gear_mobile_line"             "20f_gear_explosives"             
"20g_gear_other"  

Make plots static and add numbers to plots where it makes sense

@Court78 all the plots in HHS are interactive. I think this is useful but makes styling significantly harder due to the way they are made interactive. Plotly takes a ggplot2 plot and tries to make it interactive and there are some things this transition does not do well. For example, the strip labels do not look good and it will take work to make them look good.

If we used static plots we could use the same style as FMA for the plots and it's easier to make them look good.

But I don't know how important it is to users for it to be interactive.

When I re-wrote the app, I made it so I can change interactive to static for all plots at once changing one FALSE to TRUE so I could let you take a look if you wanted.

Data on fish sold has changed?

I'm seeing what appear to be outliers in the old data that do not show up in the new. I assume these are fixes and not issues with the new data. This results in a different looking plot in the new app and I'm going to assume this is correct.

# Old app
dplyr::filter(hhs_Q68, ma_name == "Kaledupa") %>% 
  dplyr::arrange(dplyr::desc(`68_fish_sold`))

# A tibble: 247 x 3
   ma_name  `68_fish_eaten` `68_fish_sold`
   <fct>              <int>          <int>
 1 Kaledupa              10        1000000
 2 Kaledupa              15         500000
 3 Kaledupa               5         200000
 4 Kaledupa              25            500
 5 Kaledupa              10            200
 6 Kaledupa              20             85
 7 Kaledupa              30             80
 8 Kaledupa              45             80
 9 Kaledupa              40             80
10 Kaledupa              25             65

But in the "new" app I'm seeing the same query yield

# New app
# A tibble: 247 x 3
   maa      `68_fish_eaten` `68_fish_sold`
   <chr>              <dbl>          <dbl>
 1 Kaledupa             100            500
 2 Kaledupa              10            200
 3 Kaledupa              10            100
 4 Kaledupa              20             85
 5 Kaledupa              45             80
 6 Kaledupa              40             80
 7 Kaledupa              30             80
 8 Kaledupa              25             65
 9 Kaledupa              25             60
10 Kaledupa              29             60

Add new plots from questions that are not mapped yet

@zross There are at least 17 HHS questions that are still not in the app. These questions should be included and are:
Q7, Q15, Q20, Q21, Q30e-Q30i, Q35, Q48, Q49, Q50, Q57, Q58, Q62, Q69, Q71, Q74, Q75, Q76. In the hhs_questions file, these questions are under the column "question_no_included". To add the question to the select menu in the UI, just move the question from the "question_no_included" column to the "question" column. For each question, a code should be written to get the summary plot and summary table.

Set consistent title length

In old app there is a line break manually inserted. This should be replaced with a max title width before wrapping.

Error in calculations for 59?

@abelvaldivia in number Q59, I think there is an error in the field renaming. Do you agree? Can you give me the crosswalk for names from Q59_summary to the names you want that I should be using?

The Q59_summary looks like this:

                   MA name    N   Certain Confident.not High.chance  Uncertain Very.confident.not
1  Binongko Makoro Taipabu  270         0          87.8         0.7        8.1                3.3
2                 Kaledupa  280       1.4          55.4        25.4       13.9                3.9
3                Kapuntori  277      14.1          58.5         0.7        2.9               23.8
4                 Kulisusu  276         0          77.2         0.4         21                1.4
5                 Labengki  237       1.3          54.4         5.9       34.2                4.2
6                  Maginti  280      19.6          37.5        19.6       20.4                2.9

But then you rename with:

       colnames(Q59_summary) <- c("MA name", "N", 
                                    "Not very confident",
                                    "Not confident",
                                    "Uncertain",
                                    "Confident", 
                                    "Very confident")

FULL CODE

         hhs_Q59 <- selectedData()[,c("ma_name","59_food_procurement")] %>%
                        filter(`59_food_procurement` != "") %>%
                           rbind(c(NA, "Confident not"), 
                                 c(NA, "Uncertain"),
                                 c(NA, "High chance"),
                                 c(NA, "Very confident not"),
                                 c(NA, "not Certain")) %>%
                           droplevels()
        
         Q59_summary <- proportion (hhs_Q59$`59_food_procurement`,
                                     hhs_Q59$ma_name,
                                     3,5)
         colnames(Q59_summary) <- c("MA name", "N", 
                                    "Not very confident",
                                    "Not confident",
                                    "Uncertain",
                                    "Confident", 
                                    "Very confident")

Why are there separate datasets?

@abelvaldivia can you explain why Q14, Q15, Q44 etc are their own datasets rather than being additional columns in the ALL_hhs? It's intensive having to filter each of these when the user makes changes to geography and it's a bit of a pain to use multiple datasets.

Would a single question selector be preferable?

@Court78 personally I find it a bit cumbersome to try and guess what category a question will fall under and often have to hunt and peck.

A possible alternative would be a single selector with a text divider. In the image below you can see that this is partly implemented already, a single selector would look like the "Question" selector but would have all questions.

But I'm not sure if this would be worse or better for you and your users. To get to question, say, 70, you would need to scroll through them all which is a separate possible annoyance.

It would take an hour or two to implement.

image

Q40

When I select Q40 it makes me reload the app...

Currently App on server is not working correctly ... very slow

@zross The app is not working correctly on the server, even though it works fine when I run it locally. This start happening after I updated my Mac to the new OS (BigSur). I haven't figured out where the issue is. I am updating the OS again, it looks like Apple just release another OS update, but I am not even sure this is the root of the problem

Aggregate by MA

Add option to show mean and standard error across MA areas selected

Proposal, alternative with data and chart tab

@abelvaldivia I'm changing my mind about the collapses and I think an approach like this is better for a couple of reasons:

  1. It's confusing that the household data summary is not really a question and all the others show charts.
  2. With the collapses it might become confusing what is selected if you close the collapse you're working with
  3. I think a user might want to jump between the data summary and a chart.

The design here is not great, but what do you think of this instead? A separate tab for the data and then for the charts. There are no selects on the data tab.

image

Reverse order of maa

@Court78 I'm not sure if having the y-axis start with the last maa alphabetically was deliberate. I'm guessing no. I reversed it. If this is OK please close this.

Add live search

Maybe for geo selectors but definitely for question selector

Recommend Projects

  • React photo React

    A declarative, efficient, and flexible JavaScript library for building user interfaces.

  • Vue.js photo Vue.js

    ๐Ÿ–– Vue.js is a progressive, incrementally-adoptable JavaScript framework for building UI on the web.

  • Typescript photo Typescript

    TypeScript is a superset of JavaScript that compiles to clean JavaScript output.

  • TensorFlow photo TensorFlow

    An Open Source Machine Learning Framework for Everyone

  • Django photo Django

    The Web framework for perfectionists with deadlines.

  • D3 photo D3

    Bring data to life with SVG, Canvas and HTML. ๐Ÿ“Š๐Ÿ“ˆ๐ŸŽ‰

Recommend Topics

  • javascript

    JavaScript (JS) is a lightweight interpreted programming language with first-class functions.

  • web

    Some thing interesting about web. New door for the world.

  • server

    A server is a program made to process requests and deliver data to clients.

  • Machine learning

    Machine learning is a way of modeling and interpreting data that allows a piece of software to respond intelligently.

  • Game

    Some thing interesting about game, make everyone happy.

Recommend Org

  • Facebook photo Facebook

    We are working to build community through open source technology. NB: members must have two-factor auth.

  • Microsoft photo Microsoft

    Open source projects and samples from Microsoft.

  • Google photo Google

    Google โค๏ธ Open Source for everyone.

  • D3 photo D3

    Data-Driven Documents codes.