Code Monkey home page Code Monkey logo

q2-composition's Introduction

qiime2 (the QIIME 2 framework)

Source code repository for the QIIME 2 framework.

QIIME 2™ is a powerful, extensible, and decentralized microbiome bioinformatics platform that is free, open source, and community developed. With a focus on data and analysis transparency, QIIME 2 enables researchers to start an analysis with raw DNA sequence data and finish with publication-quality figures and statistical results.

Visit https://qiime2.org to learn more about the QIIME 2 project.

Installation

Detailed instructions are available in the documentation.

Users

Head to the user docs for help getting started, core concepts, tutorials, and other resources.

Just have a question? Please ask it in our forum.

Developers

Please visit the contributing page for more information on contributions, documentation links, and more.

Citing QIIME 2

If you use QIIME 2 for any published research, please include the following citation:

Bolyen E, Rideout JR, Dillon MR, Bokulich NA, Abnet CC, Al-Ghalith GA, Alexander H, Alm EJ, Arumugam M, Asnicar F, Bai Y, Bisanz JE, Bittinger K, Brejnrod A, Brislawn CJ, Brown CT, Callahan BJ, Caraballo-Rodríguez AM, Chase J, Cope EK, Da Silva R, Diener C, Dorrestein PC, Douglas GM, Durall DM, Duvallet C, Edwardson CF, Ernst M, Estaki M, Fouquier J, Gauglitz JM, Gibbons SM, Gibson DL, Gonzalez A, Gorlick K, Guo J, Hillmann B, Holmes S, Holste H, Huttenhower C, Huttley GA, Janssen S, Jarmusch AK, Jiang L, Kaehler BD, Kang KB, Keefe CR, Keim P, Kelley ST, Knights D, Koester I, Kosciolek T, Kreps J, Langille MGI, Lee J, Ley R, Liu YX, Loftfield E, Lozupone C, Maher M, Marotz C, Martin BD, McDonald D, McIver LJ, Melnik AV, Metcalf JL, Morgan SC, Morton JT, Naimey AT, Navas-Molina JA, Nothias LF, Orchanian SB, Pearson T, Peoples SL, Petras D, Preuss ML, Pruesse E, Rasmussen LB, Rivers A, Robeson MS, Rosenthal P, Segata N, Shaffer M, Shiffer A, Sinha R, Song SJ, Spear JR, Swafford AD, Thompson LR, Torres PJ, Trinh P, Tripathi A, Turnbaugh PJ, Ul-Hasan S, van der Hooft JJJ, Vargas F, Vázquez-Baeza Y, Vogtmann E, von Hippel M, Walters W, Wan Y, Wang M, Warren J, Weber KC, Williamson CHD, Willis AD, Xu ZZ, Zaneveld JR, Zhang Y, Zhu Q, Knight R, and Caporaso JG. 2019. Reproducible, interactive, scalable and extensible microbiome data science using QIIME 2. Nature Biotechnology 37:852–857. https://doi.org/10.1038/s41587-019-0209-9

q2-composition's People

Contributors

brett-van-tussler avatar cherman2 avatar chriskeefe avatar david-rod avatar ebolyen avatar eldeveloper avatar gregcaporaso avatar hagenjp avatar jairideout avatar jiung-wen avatar lizgehret avatar mortonjt avatar nbokulich avatar oddant1 avatar q2d2 avatar thermokarst avatar valentynbez avatar

Stargazers

 avatar  avatar  avatar  avatar

Watchers

 avatar  avatar  avatar  avatar  avatar  avatar  avatar  avatar  avatar  avatar  avatar  avatar

q2-composition's Issues

BUG: `statistical-test` methods don't all work

This came up on the forum in 2017.6/2017.7 release cycles.

mannwhitneyu: Plugin error from composition:
alternative should be None, ‘less’, ‘greater’ or ‘two-sided’

wilcoxon: Plugin error from composition:
Zero method should be either ‘wilcox’ or ‘pratt’ or ‘zsplit’

kruskal: Plugin error from composition:
All numbers are identical in kruskal

expand unit tests

  • include other values for pseudocount
  • tests of the ancom visualizer. confirm that all expected files exist and have file size greater than zero, and confirm some specific results in the csv file. See here for an example of how to test a visualizer.

embed volcano plot in index.html

I think this would be nicer than having it on a separate page.

Also, is it possible to have an 'export (or download) as SVG' option for the plot?

BUG: chosen intercept column in metadata but not table will default to alphabetical order

Bug Description
When a reference level is chosen that is a column within the metadata, but the associated IDs are not in the feature table, no error is raised - ANCOM-BC just defaults back to alphabetical order for the intercept column. We should raise an error for this, as it produces results that aren't accurate to the user for their provided inputs.

Example Metadata File:

sample-id         Column1           Column2          Column3
S001              group1            Test1            1823
S002              group2            Test2            2843
S003              group3            Test3            9972

Example Feature Table:

sample-id      feature1      feature2
S002           10            25
S003           2             14 

Example Command:

qiime composition ancombc /
--i-table table.qza / 
--m-metadata-file sample-md.tsv /
--p-formula Column1 /
--p-reference-level 'Column1::group1' /
--o-differentials ancombc-diffs.qza

In this example, Column1::group1 was chosen as the reference level, but the sample ID S001 is not included in the feature table, and is thus not included in the actual analysis. This causes the reference level behavior to default back to alphabetical order for the chosen formula column, meaning that group2 is selected as the intercept (i.e. reference level) instead of group1. This would produce the following differential table:

id           (Intercept)       Column1group3
feature1      0.004            0.0005
feature2      0.352            0.00478

This produces a confusing output for users because they are expecting the (Intercept) column to be group1 and for there to be two additional columns (group2 and group3 from Column1). It is unclear from these results which column is used as the intercept (i.e. reference level) and why one of the columns seemingly disappeared.

We should raise an error if the chosen reference level has IDs that are not included in the feature table (even if they are included in the metadata. cc: @cherman2 as she discovered this error while we were running ANCOM-BC on one of her datasets.

FEAT: new visualization for ancombc results

Add bar plot for visualizing lfc for different groups with respect to the chosen intercept that includes error bars for the standard error. One plot per each reference column. Either entire table, or filtered by a list of feature_ids provided as input (metadata viewable), or some q-value threshold of significance (on either end).

Example shown below taken from ANCOM-BC paper figure 6.

Screen Shot 2023-02-07 at 10 20 21 AM

FEAT: Add a classic CLR transform

Addition Description
It would be nice to have way to perform a centered-log ratio transform within QIIME 2 for downstream analyses, visualizations, and just having around in general.

Current Behavior
There's an rclr-transformation function in gemelli which is slightly different due to the way it handles zeros.

Proposed Behavior
It would be nice to have a function with a classic CLR with either a pseudocount or low zero substitution option. I'm not sure what people would do with it downstream, but it would be nice to have, since we already have ILR in gneiss and ALR in qurro.

References
This is partially inspired by https://forum.qiime2.org/t/obtain-normalized-data-ancom/22021

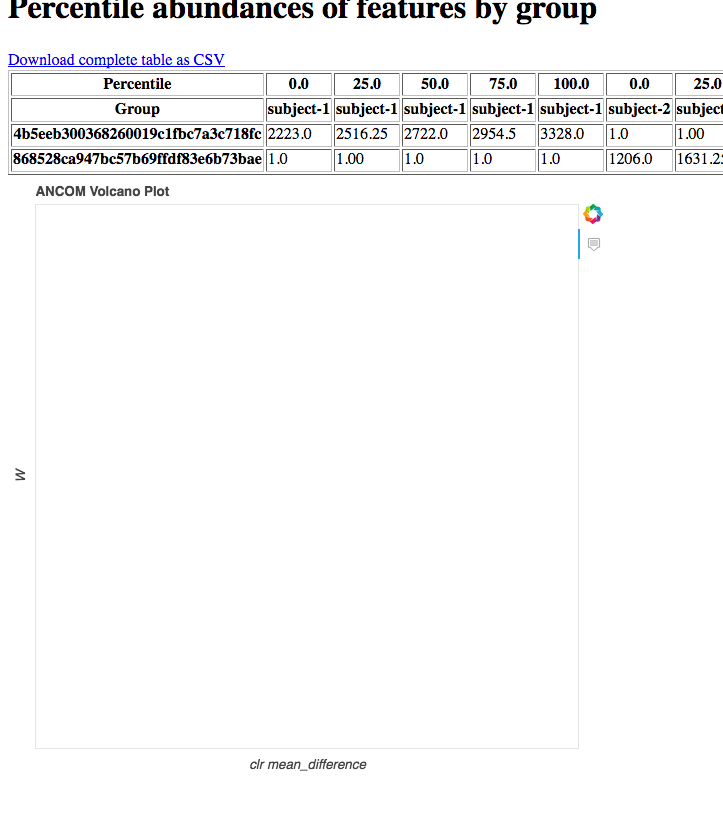
Bokeh plot appears to be broken

Description
The bokeh plots embedded in the viz appear to be broken - the console warning says "[bokeh] could not set initial ranges".

Steps to reproduce the behavior

  1. Open this example plot
  2. Open browser's developer console.

Expected behavior
The Bokeh plot should be present and not empty. There should be no errors in the dev console.

Screenshots
screen shot 2018-07-17 at 5 59 01 am

Computation Environment

  • OS: Darwin & Linux (example viz above created by Busywork)
  • QIIME 2 Release 2018.6

References

  1. Original forum post
  2. Second forum post

Update Ancom Plots to Vega 5

Bug Description
Somewhere along the line updates to vega broke our vega visualizations. This includes ancom plots.

Comments
For now it looks like we're going to remove the ability to open them in the vega editor as a band aid, but at some point we'll need to update the plot to work properly with the updated editor.

The F-score appears to be missing

Bug Description

In this post, it appears that the F-score was replaced by clr, but the x label doesn't suggest this. If the F-test is going to be used, the F-score should be clearly labeled in the x-axis

IMP: add character escaping in formula/group parameters for ancombc

The formula parser within ancombc currently doesn't treat (+-/*) as regular characters, because the formula needs to handle those characters as operators. This can be inconvenient for users who have metadata columns that contain those characters, since those characters will act as term separators and will unintentionally split up metadata column names.

Example from @gregcaporaso:

I have a metadata column called "health-status". If it provide that in my forumla, it treats the - as a minus sign (and fails, because I don't have a column called "health"). the full command i'm trying to run is:

qiime composition ancombc
--i-table table-mf10000.qza
--m-metadata-file sample-metadata.tsv
--p-formula "health-status"
--o-differentials health-status-ancombc.qza

Character escaping would be nice to add, but not sure if this is possible through the current formula parser. I am currently looking into this and will aim to add this to our 2022.11 patch release if there is a way to handle with current machinery.

failure when running on a category with more than two values

using the test artifacts that I sent to @mortonjt by email, i get the following for a category with three values:

$ qiime composition ancom --i-table composition-table.qza --m-metadata-file sample-metadata.tsv --m-metadata-category treatment-group --o-visualization ancom-out && qiime tools view ancom-out.qzv
Traceback (most recent call last):
  File "/Users/caporaso/miniconda3/envs/qiime2-dev/bin/qiime", line 11, in <module>
    load_entry_point('q2cli', 'console_scripts', 'qiime')()
  File "/Users/caporaso/miniconda3/envs/qiime2-dev/lib/python3.5/site-packages/click/core.py", line 716, in __call__
    return self.main(*args, **kwargs)
  File "/Users/caporaso/miniconda3/envs/qiime2-dev/lib/python3.5/site-packages/click/core.py", line 696, in main
    rv = self.invoke(ctx)
  File "/Users/caporaso/miniconda3/envs/qiime2-dev/lib/python3.5/site-packages/click/core.py", line 1060, in invoke
    return _process_result(sub_ctx.command.invoke(sub_ctx))
  File "/Users/caporaso/miniconda3/envs/qiime2-dev/lib/python3.5/site-packages/click/core.py", line 1060, in invoke
    return _process_result(sub_ctx.command.invoke(sub_ctx))
  File "/Users/caporaso/miniconda3/envs/qiime2-dev/lib/python3.5/site-packages/click/core.py", line 889, in invoke
    return ctx.invoke(self.callback, **ctx.params)
  File "/Users/caporaso/miniconda3/envs/qiime2-dev/lib/python3.5/site-packages/click/core.py", line 534, in invoke
    return callback(*args, **kwargs)
  File "/Users/caporaso/Google Drive/code/qiime2/q2cli/q2cli/commands.py", line 154, in __call__
    results = self.action(**arguments)
  File "<decorator-gen-191>", line 2, in ancom
  File "/Users/caporaso/Google Drive/code/qiime2/qiime2/qiime/core/callable.py", line 238, in callable_wrapper
    output_types, provenance)
  File "/Users/caporaso/Google Drive/code/qiime2/qiime2/qiime/core/callable.py", line 438, in _callable_executor_
    ret_val = callable(output_dir=temp_dir, **view_args)
  File "/Users/caporaso/Google Drive/code/qiime2/q2-composition/q2_composition/_ancom.py", line 71, in ancom
    transform_function, difference_function)
  File "/Users/caporaso/Google Drive/code/qiime2/q2-composition/q2_composition/_ancom.py", line 112, in _volcanoplot
    fold_change = transformed_table.apply(difference_function, axis=0)
  File "/Users/caporaso/miniconda3/envs/qiime2-dev/lib/python3.5/site-packages/pandas/core/frame.py", line 4061, in apply
    return self._apply_standard(f, axis, reduce=reduce)
  File "/Users/caporaso/miniconda3/envs/qiime2-dev/lib/python3.5/site-packages/pandas/core/frame.py", line 4157, in _apply_standard
    results[i] = func(v)
  File "/Users/caporaso/Google Drive/code/qiime2/q2-composition/q2_composition/_ancom.py", line 109, in <lambda>
    difference_function = lambda x: _d_func(*[x[metadata==c] for c in cats])
TypeError: ('<lambda>() takes 1 positional argument but 3 were given', 'occurred at index GCAAGCGTTAATCGGAATTACTGGGCGTAAAGCGCACGCAGGCGGTTTGTTAAGTCAGATGTGAAATCCCCGGGCTCAACCTGGGAACTGCATCTGATACTGGCAAGCTTGAGTCTCGTA')

IMP: tabulate viz additions

A few nice-to-haves in composition's tabulate visualization:

  1. Description on log-fold change positive vs. negative meaning (enriched vs. depleted relative to the chosen intercept i.e. reference level(s))
  • ln(A/B) = ln(B) - ln(A)

  • A > B -> + (enriched)

  • A < B -> - (depleted)

  1. Description with: what W score is (lfc/se), what the chosen reference level is (i.e. intercept)

Filter out samples with missing values

@valentynbez created a PR #82 which supports this feature, however we really want to create a new flag, such as: filter_missing: bool = False which, when true, would not raise an error when samples have missing values in their metadata, instead filtering them out.

As @valentynbez mentions:

During the analysis, I had some missing metadata values. To counter it I had to:

revert to a feature-table step
filter it, filter than collapse it
add_pseudocount
filter metadata
finally run ancom

Missing values in metadata are human-introduced errors, they appear quite often. This is an inconvenient workflow for the user.

General behavior and tests are already written in the above PR, we just need to adapt it to use a flag instead of always filtering.
(Please rebase the commit history such that it includes their commit(s) if you adapt the above PR, that way @valentynbez get's proper attribution.)

BUG: remove neg-lb param

--p-neg-lb param should be removed because there is no functionality when struc_zero is set to FALSE (which will always be true since this isn't exposed in the QIIME 2 implementation).

incorporate taxonomic information into ANCOM output

Improvement Description
Accept an optional FeatureData[Taxonomy] artifact. If input, add taxonomy metadata to features (and generates cladogram?).

Alternatively, add lefse visualizer to q2-composition?

Better yet, create a separate visualizer that takes a list of hierarchical features (e.g., significant features from ANCOM or other composition methods) and generates a lefse-like dendrogram.

References
forum xref

BUG: ANCOM-BC help text updates

ANCOM-BC's CLI help text includes a couple of bugs:
Screen Shot 2023-02-03 at 11 51 32 AM
General description needs to be added, and the --i-table description should be changed to ANCOM-BC.

plot issues

The plots have a lot of whitespace underneath them - so much that if your browser window isn't large enough, you might not notice the tables:

screenshot 2016-09-28 11 13 17

Also, the mouseover labels go outside of the left edge of the browser:

screenshot 2016-09-28 11 16 22

improvements to ancom qzv

Improvement Description

  • title of page is volcano plot - should be something else
  • merge the two tables (conditionally, if they both exist)
  • sort tables by W (if that makes sense to do)
  • abundance table columns contain different numbers of digits (probably coming from pandas)

Upgrade to ANCOM-BC

Improvement Description
I think rather than upgrading from ANCOM, it might make sense to upgrade to ANCOM-BC, although I'm open to both. Having been through the ANCOM-BC paper once, I think it will be the next big method and its worth figuring out how to integrate it in qiime2.

Current Behavior
Currently, qiime2 uses the scikit-bio implementation of ANCOM I with a pseudocount of 1

Proposed Behavior
An Implementation of ANCOM-BC separating out the zero substitution step and introducing the statistical test. I'd love to see the test separated from visualization and/or the ability to extract the full results table programatically. (Actually, this is a behavior I'd like to see on a lot of the visualizers).

References
This is semi an update/response to #48. I think @mortonjt mentioned at one point that he was interested if he could figure out the table transformation, but I'm happy to collaborate on it

Order of each group value in metadata randomly changed when rerun ancom

Bug Description

The order of each group value in metadata randomly changed when rerun ancom.
As a result, the positive and negative of the clr values were randomly reversed.

Expected behavior

This order of group values should be reorder axis by first unique appearance of each group value in metadata.
As a result, the positive and negative of the clr values shoud be consistent when rerun ancom.

da-barplot does not handle spaces in metadata values

Bug Description
Da-barplot visualization in qiime2 view is not able to open subplots if there are spaces in the metadata value.

For example:
metadata column has a value "Donor A", the html that brings up this code breaks and you are not able to view the subplot.

Computation Environment
This happens on view.qiime2.org on Chrome, Firefox and Safari

BUG: tabulate viz does not handle single reference level values or default dummy coding

Bug Description
When running ancombc in q2-composition, if the --p-reference-levels parameter includes only a single column::value pair, or is left blank, the tabulate visualizer produces undesirable behavior.

For the single column::value pair, the paragraph tag that contains the following text: 'Groups use to define the intercept: ...etc' produces a column separated split string for the column::value pair. Screenshot example:

Screen Shot 2023-04-05 at 11 32 10 AM

For the case where --p-reference-levels is left blank, the default dummy coding column::value pair is not included in the 'Groups used to define the intercept...' tag, it is just left blank. Screenshot example:

Screen Shot 2023-04-05 at 11 32 20 AM

Steps to reproduce the behavior
The example data can be used for qiime composition ancombc (single and multi formula group data can be used, the table and metadata files are the same).

To produce the examples above, either of these configurations for ancombc can be run (for single and missing reference levels, respectively):

  qiime composition ancombc \
    --i-table table.qza \
    --m-metadata-file metadata.tsv \
    --p-formula bodysite \
    --p-reference-levels 'bodysite::tongue'
    --o-differentials dataloaf.qza
  qiime composition ancombc \
    --i-table table.qza \
    --m-metadata-file metadata.tsv \
    --p-formula bodysite \
    --o-differentials dataloaf.qza

Expected behavior
The tabulate visualizer should produce the following format for the chosen reference levels:

  • Single reference level:
    Columns used to calculate the intercept: column1::value1 column2::value2

  • Multiple reference levels:
    Columns used to calculate the intercept: column1::value1 column2::value2

  • No reference level:
    Columns used to calculate the intercept: formulacolumn1::alphabetizedvalue1 formulacolumn2::alphabetizedvalue2

With formulacolumn1 and formulacolumn2 referring to the chosen column(s) from the formula parameter, and alphabetizedvalue1 and alphabetizedvalue2 referring to the default dummy coding intercept within each column (which corresponds to the highest value in alphabetical order for any categorical column).

Computation Environment

  • macOS Monterey
  • QIIME 2 Release: dev (2023.5 dev env install)

improve ANCOM paired testing: add parameter for linking paired samples via metadata

Current Behavior
ancom currently supports paired tests, e.g., with ttest_rel, but it is currently a bit difficult to use (need to order samples in the sample metadata).

Proposed Behavior
It would be ideal to add a parameter that takes a user-defined metadata category (which should contain a "site name" or "subject id" type metadata that links paired samples) to automatically order samples for paired testing, when paired tests are selected.

Comments
I predict that a common error would arise from feature tables or mapping files that are missing paired samples (e.g., when the "subject id" column contains some singleton values or if a sample is missing from a feature table after abundance filtering). Instead of exiting with an error, it would be useful to ignore such samples, and instead print a message to stdout listing missing and unpaired samples.

update to ANCOM 2.0

Improvement Description
The first author of the ANCOM paper, @sidhujyatha, has shared some R code with me which he would like to get wrapped in a QIIME 2 plugin, so we can support the latest version of ANCOM (ANCOM 2.0). This would be great to get in place, but we just need someone to take on wrapping this R script in a QIIME 2 plugin.

IMP: Update --p-reference-levels input type within ANCOM-BC as a Collection

Currently the --p-reference-levels parameter within ANCOM-BC takes strings as input, and splits the column::value pairs on a double colon. While uncommon, this becomes problematic for any users who have double colons in their metadata.

The best solution for this would be to modify this parameter to accept a Collection type, which would then turn this input into a dict of key:value pairs, and there would be no restrictions on any characters included within a user's metadata.

IMP: da-plots should take `FeatureData[Taxonomy]` as optional input

I received a feature request for full taxonomic annotation in the da-plots visualization without collapsing the feature table, which makes sense for maximizing resolution. We should add support for providing FeatureData[Taxonomy] to provide annotation of features in the viz (I imagine this would just show up in the tool tip, for readability - EDIT: After this PR is merged, full feature annotations could be included on y-axis labels, if that's desired).

Empty volcano plot

I'm not sure how this happens exactly, but we found a dataset where no features exceeded the theta threshold for the W score, and the volcano plot didn't show any points. The ancom.csv file looked fine, it was mostly 0s for the W score, but there were a handful of features that had <30 scores.

ANCOM volcano plot missing plot data TSV

Bug Description
ANCOM volcano plot missing plot data TSV.

Steps to reproduce the behavior

  1. Open this viz
  2. Click on "Export as TSV"
  3. Witness the lack of "data.tsv"
  4. Export the QZV
  5. Notice that the data is present in the file "ancom.tsv"

Expected behavior
The TSV should include the values necessary for plotting the scatterplot displayed in this viz - the transform_function, the W score, and the Feature ID.

References

  1. Originating forum post

Recommend Projects

  • React photo React

    A declarative, efficient, and flexible JavaScript library for building user interfaces.

  • Vue.js photo Vue.js

    🖖 Vue.js is a progressive, incrementally-adoptable JavaScript framework for building UI on the web.

  • Typescript photo Typescript

    TypeScript is a superset of JavaScript that compiles to clean JavaScript output.

  • TensorFlow photo TensorFlow

    An Open Source Machine Learning Framework for Everyone

  • Django photo Django

    The Web framework for perfectionists with deadlines.

  • D3 photo D3

    Bring data to life with SVG, Canvas and HTML. 📊📈🎉

Recommend Topics

  • javascript

    JavaScript (JS) is a lightweight interpreted programming language with first-class functions.

  • web

    Some thing interesting about web. New door for the world.

  • server

    A server is a program made to process requests and deliver data to clients.

  • Machine learning

    Machine learning is a way of modeling and interpreting data that allows a piece of software to respond intelligently.

  • Game

    Some thing interesting about game, make everyone happy.

Recommend Org

  • Facebook photo Facebook

    We are working to build community through open source technology. NB: members must have two-factor auth.

  • Microsoft photo Microsoft

    Open source projects and samples from Microsoft.

  • Google photo Google

    Google ❤️ Open Source for everyone.

  • D3 photo D3

    Data-Driven Documents codes.