Code Monkey home page Code Monkey logo

physiozoo / physiozoo Goto Github PK

View Code? Open in Web Editor NEW
29.0 2.0 9.0 431.54 MB

Platform for Heart Rate Variability analysis of human and animal data.

Home Page: https://physiozoo.com

License: GNU General Public License v3.0

MATLAB 14.98% Objective-C 0.01% Makefile 0.01% Python 62.64% C 0.23% HTML 0.04% Tcl 21.77% Lua 0.01% CSS 0.01% Csound Document 0.17% Jinja 0.10% JavaScript 0.05% Sass 0.01%
ecg ecg-qrs-detection signal-processing hrv heart-rate-variability

physiozoo's Introduction

PhysioZoo

Documentation Status

PhysioZoo is a collaborative platform dedicated to the study of the heart rate variability (HRV) from Humans and other mammals’ electrophysiological recordings. The main components of the platform are:

  • Software
    • An open-source algorithmic toolbox for matlab (
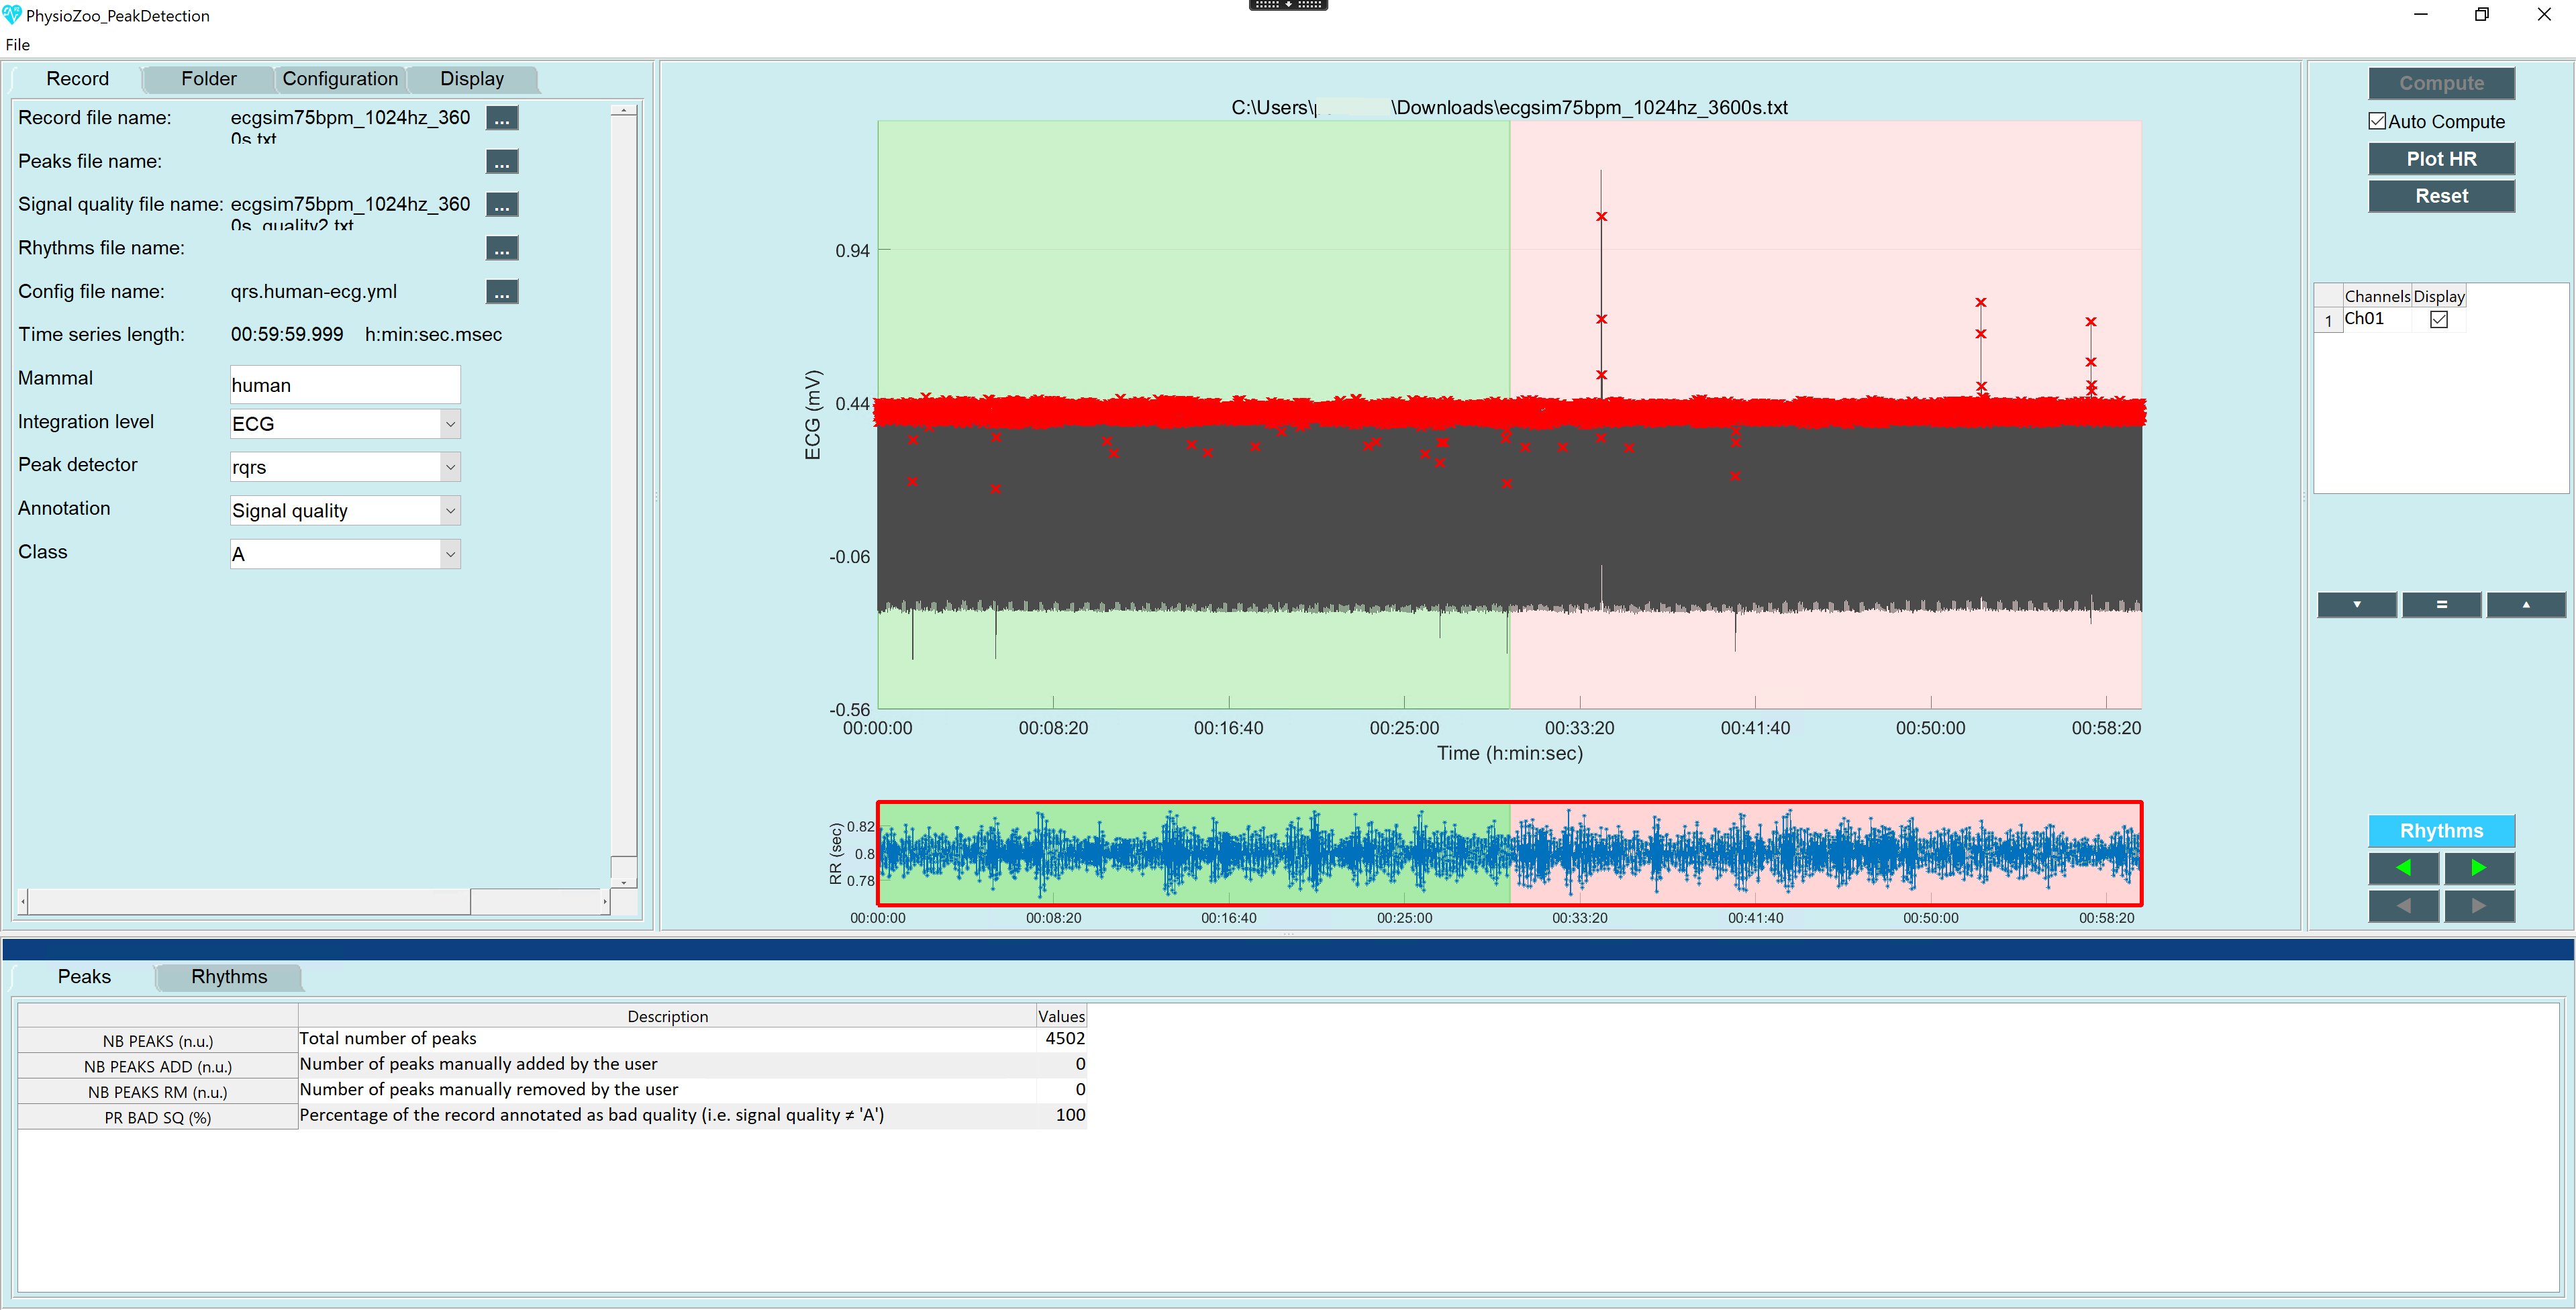
mhrv), which implements all standard HRV analysis algorithms, a selection of peak detection algorithms and prefiltering routines. This can be used within your own data analysis code using the mhrv API.
    • An open-source graphical user interface (
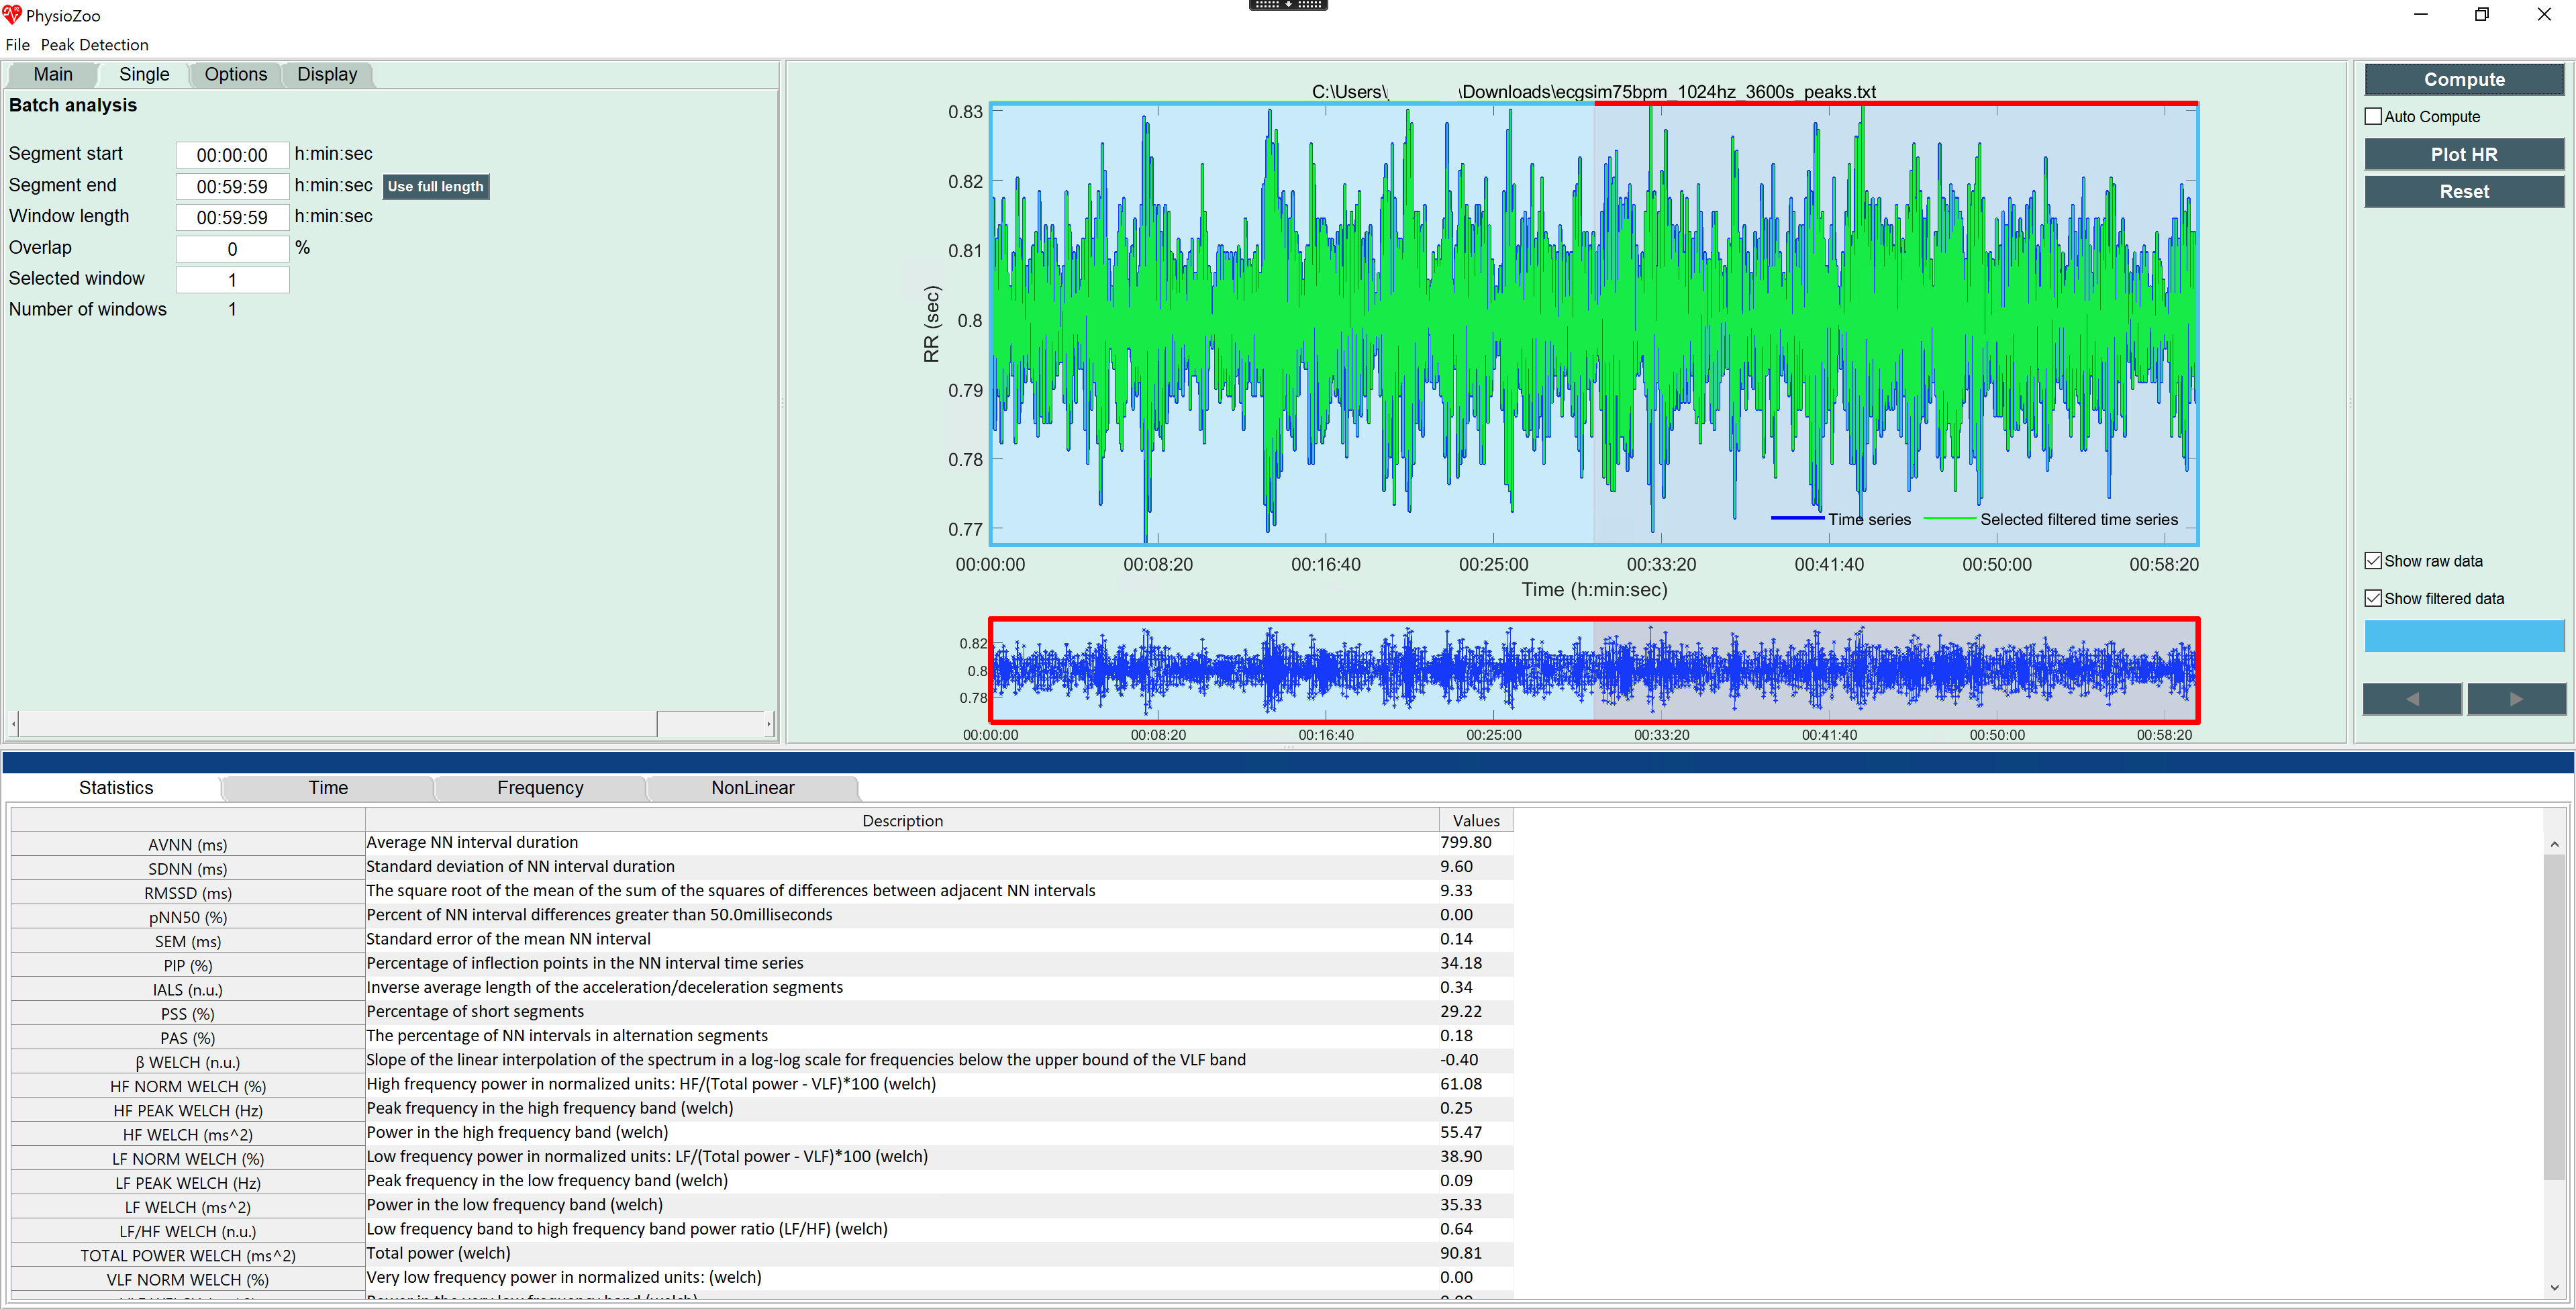
PZ-UI) that provides a user friendly interface for advanced HRV analysis of RR-intervals time series and data visualization tools. This enables easy access to HRV analysis without writing any code.
  • Databases
    • A set of annotated databases (PZ-DB) of electrophysiological signals from different mammals (dog, rabbit and mouse). Available here.
    • Manually audited peak locations and signal quality annotations for each of the recordings.
  • Configuration
    • A set of configuration files that adapt the HRV measures and mhrv algorithms to work with data from different mammals.
    • All HRV measures can be further adapted for the analysis of other mammals by creating simple human-readable mammal-specific configuration files.

The PhysioZoo mission is to standardize and enable the reproducibility of HRV analysis in mammals’ electrophysiological data. This is achieved through its open source code, freely available user interface and open access databases. It also aims to encourage the scientific community to contribute their electrophysiological databases and novel HRV algorithms/analysis tools for advancing the research in the field.

Feedback on how to improve the PhysioZoo platform is welcomed. Do not hesitate to drop us an email at:

[email protected]

Source code, data or interface enhancement contributions are welcome. Look here on how to contribute to PhysioZoo.

Please include the standard citation to PhysioZoo when using the resources available on the platform:

Joachim A. Behar*, Aviv A. Rosenberg*, Ido Weiser-Bitoun, Ori Shemla, Alexandra Alexandrovich, Evgene Konyukhov, Yael Yaniv. 2018. 'PhysioZoo: a novel open access platform for heart rate variability analysis of mammalian electrocardiographic data.' Accepted for publication in Frontiers in Physiology.

*Equal contribution.

physiozoo's People

Contributors

avivrosenberg avatar goldina avatar hackchoc avatar jbehar avatar jeremy-levy avatar shemla avatar

Stargazers

 avatar  avatar  avatar  avatar  avatar  avatar  avatar  avatar  avatar  avatar  avatar  avatar  avatar  avatar  avatar  avatar  avatar  avatar  avatar  avatar  avatar  avatar  avatar  avatar  avatar  avatar  avatar  avatar  avatar

Watchers

 avatar  avatar

physiozoo's Issues

Path problem

In the PhysioZoo module 1 (peak detection), when the path to 'gqrs.exe' contains space, a run error occurs.

It seems, that the problem is in the function 'get_wfdb_tool_path' --> 'escape_spaces'.

Peaks annotated as signal quality C are still used for computations

I am in the process of setting myself up to analyze some existing ECG data. First i want to enhance the preprocessed data by manually correcting some faulty peak detections and marking material with poor signal quality to be excluded from computations. PhysioZoo can be used for this very easily and intuitively. As I was loading my data (peak file) in the HRV module I realized that all the computated values stayed the same before and after loading the quality file which led me to further inspect this behavior.

It seems that the quality file only affects the display of the data but none of the computations. I expected that data annotated with signal quality c is not used for computation, that either some correction algorithms are used, if suitable, or n.a. is returned.

To test this I first created some test data using Python and Neurokit2 (sorry for not using MATLAB):

import neurokit2 as nk
import numpy as np

ecg75 = nk.ecg_simulate(duration=3600, noise=0, heart_rate=75, sampling_rate=1024)
np.savetxt('/tmp/ecgsim75bpm_1024hz_3600s.txt', ecg75, fmt='%-10.10g')

I loaded the file into PhysioZoo, ran a peak detection which ran perfectly as the simulated data contains no noise. I annotated the second half of the data as signal quality C (Neither HRV or morphological analysis is possible). I saved the peaks and the quality file and switched to the HRV module. First I loaded the peaks and ran a one window analysis using the whole data (it should be an hour but it is shown with a length of 0:59:59) resulting in an AVNN of 799.80 for this simulated data set (see image1.png). Now I loaded the the signal quality file and triggered a new computation but all results remained unchanged (see image2.png).

---
type: quality annotation
source file: ecgsim75bpm_1024hz_3600s.txt

---

Beginning       End             Class
1800.000000     3600.000000     C

I then used the whole file length and defined two non-overlapping windows of 0:29:59 and computed results. I expected that only the first window would be computed as the second half is fully annotated as signal quality C. Despite that the computations were done on both windows seemingly ignoring the annotations. Nevertheless the results are helpful as they show that the AVNN for the first half of the data is 799.82 and 799.78 for the second half (see image3.png). The data is simulated but has enough variance for testing.

To test whether annotations are only used when being used on the full data set I declared the first half as signal quality A. When loading this file in the peak detection module the background for the first half of the data is green and the second half has a red background (see image 4). Interessingly the value for "PR bad SQ" first displays 50 for a very short time and then jumps to 100. Switching back to the first file only annotating the second half as C increases "PR bad SQ" to 150, probably similar to issue #15.

---
type: quality annotation
source file: ecgsim75bpm_1024hz_3600s.txt

---

Beginning	End		Class
0.000000	1799.999999	A
1800.000000	3600.000000	C

Loading the file into the HRV module has no effect on the computations, but the whole status bar reflecting data quality is now totally red instead of a green bar for the first half and red for the second half of the data .

Can you please tell whether I proceeded wrongly (and how to proceed properly) or if this is the expected behavior.

I am using (primarly) PhysioZoo Standalone on Windows. I downloaded the 1.5.7-Installer but the installation states version 1.5.5. I replicated all results shown in this issue using MATLAB R2020b Update 3 for Windows using the 1.5.7 source code.

image1
image2
image3
image4

module 1 - remove multiple peaks

When removing multiple peaks with the rectangle in module 1 - remove only peaks which are present in the region of the rectangle, both in the y-axis and in the x-axis. This will make the interface more intuitive, and will help in cases of multiple methodical errors such as T wave false annotations.

Several Issues to solve

Hi,
Several issues have been found:

  1. The program is really long when there are a great number of signal quality events in the file.
  2. The navigation using the Display tab is not available for the first module, i. e. Peak detector.
    Armand

bug: pobm.general

it should be 'from scipy.stats import kurtosis, skew, median_abs_deviation'
not 'median_absolute_deviation'

detrending and DFA

The detrending action should not affect the calculation of the DFA analysis. Instead the DFA should get as input the data before detrending (and after filtering).

Error Message

Screen Shot 2020-08-17 at 11 38 41 AM

I keep getting this error message when I try to do peak detection on the example mouse file that was provided with the software. Does anyone know how to fix the error?

PZ examples

Download examples --> provides an example sets in different formats. EGM is in mat file, dog/rabbit in txt and human in wfdb. This example package should include the examples in all formats or one format that is the same for all species.

Error "gqrs: can't read configuration file C:/users/" Windows user with space in name

I think we found a problem and work around:

When having loaded a file into peak detection window and having clicked 'Okay' to analyze that file, we kept receiving the error message "gqrs: can't read configuration file C:/users/John " where the user profile of this computer was essentially "John Smith". That space after 'John' and the missing 'Smith' was a clue, so when we reinstalled PhysioZoo as a different user or on a different computer when the username was only a single word name (e.g. "JohnSmith") PhysioZoo ran without error. Seems like this is an issue which others will encounter and should theoretically be preventable. Thanks for putting all this together in the first place!

Examples to functions in the documentation

Some of the examples in the the documentation are missing and other need to be updated with the correct function signature.

In addition, when clicking "Edit on GitHub" from the functions page, this does not work. Only when clicking "Edit on GitHub" from the documentation main page or tutorials then that is working.

my_WindowScrollWheelFcn

On laptop mouse-pad, it is possible that the variable VerticalScrollCount will get a value of 0. this case should be understood and dealt with. To date, in the scroll bar (the lower figure of the RR in module 2 or the RR figure in module 1) when scrolling the mouse pad, Matlab returns an error. The GUI isn't interrupted, and the functionality is preserved.

Range filter: RR-min values

The parameter RR-min for the range filter should accept any value bigger or equal to 0 and smaller than RR-max. If RR-min is 0 than the filtering process will filter out only values larger than RR-max.

Input Error

Hi my ECG data seems to successfully upload, but there is no peak detection. I get the following error:
Input Error
OpenFile error: could not find the wfdb tool 'gqrs.exe' Seached in: ......

How can I fix this?

how to change frequency ranges

I was using your software for mice HRV data analyses. We want to change frequency ranges to LF: 0.15-0.60 Hz and HF: 2.5-5 Hz. However, the software won't allow me to do this change. How can we make this happen? Can you help me with this, please? Thanks

Adding RRest

Hi, @peterhcharlton, welcome!

Some issues/questions to address in order to incorporate the RRest code.

  1. Naming. We have an unfortunate naming collision as "RR" is both for “respiratory rate” and also by much of the HRV code to mean R-R intervals. To make it clearer for users, I suggest to put the algorithmic code into two Matlab packages, one for HRV analysis and one for respiratory rate analysis. Then users can call the functions with e.g. mhrv.ecgrr(…) or resp.rrest(…). See below.

  2. Repo organization. How would you like to add your code? Do you want to maintain a separate copy of part of the RRest code within the PZ repo? This is the easiest, but will require you to maintain changes in two repos (your main repo and the PZ repo). For the mhrv library, I have a separate dedicated repo and then I use a feature of git (subtrees) to sync commits from that repo to the PZ repo (this one). It’s possible to start simple (just put some of your code in the PZ repo, maintain it manually) and later on consolidate everything. So, do you want me to just add the .mat files you sent us to this repo?

  3. Documentation. There are some technical issues I need to address to get the documentation generator (Sphinx) to work with both packages. I’ll fix it. In any case, I can create some template files for you to fill in with documentation about your package. The documentation for the functions will be loaded from the code itself, but any other docs require you to manually create them (e.g. tutorials or getting started pages and so on). See for example the sections in the mhrv docs folder. Everything should then be generated together and hosted on the PZ docs site.

To explain the above, the project structure should be something like this:

PZ/
	...
	GUI/	(existing UI code)
	lib/ 	(new top-level folder for libraries used by PZ)
		mhrv/
			docs/
			+mhrv/ 	(this is Matlab package containing HRV code)
				mhrv.m
				mhrv_batch.m
				...
			... 
		resp/
			docs/	(your docs will be here)
			+resp/	(this is Matlab package containing your code)
				rrest.m
				setup_universal_params.m
				...
	...

I would appreciate any feedback or suggestions.

Failed to find an ECG channel in the record human_example

I'm trying to convert some very simple ECG .txt files into the WFDB format, for which I have tried to use the mat2wfdb() function. Using these new WFDB files, I kept getting error messages from rqrs.m saying "failed to find an ECG channel in the record", so I tried calling rqrs.m on the examples of human WFDB that come provided with PhysioZoo and keep getting the same error message.

[ qrs, tm, sig, Fs ] = mhrv.wfdb.rqrs( 'human_example' );
Error using mhrv.wfdb.rqrs (line 82)
Failed to find an ECG channel in the record human_example

if I nonetheless press forward with the empty ECG channel, the same sort of error message comes up later when I call gqrs()
Error using mhrv.wfdb.gqrs (line 89)
can't find ECG signal in record

I need to be able to convert my ECG files into WFDB in order to detect their peaks in a batch process manner. We have too many small recordings to manually beat detect each file, so we'd really like to be able to batch process them. Any help would be greatly appreciated!

Recommend Projects

  • React photo React

    A declarative, efficient, and flexible JavaScript library for building user interfaces.

  • Vue.js photo Vue.js

    🖖 Vue.js is a progressive, incrementally-adoptable JavaScript framework for building UI on the web.

  • Typescript photo Typescript

    TypeScript is a superset of JavaScript that compiles to clean JavaScript output.

  • TensorFlow photo TensorFlow

    An Open Source Machine Learning Framework for Everyone

  • Django photo Django

    The Web framework for perfectionists with deadlines.

  • D3 photo D3

    Bring data to life with SVG, Canvas and HTML. 📊📈🎉

Recommend Topics

  • javascript

    JavaScript (JS) is a lightweight interpreted programming language with first-class functions.

  • web

    Some thing interesting about web. New door for the world.

  • server

    A server is a program made to process requests and deliver data to clients.

  • Machine learning

    Machine learning is a way of modeling and interpreting data that allows a piece of software to respond intelligently.

  • Game

    Some thing interesting about game, make everyone happy.

Recommend Org

  • Facebook photo Facebook

    We are working to build community through open source technology. NB: members must have two-factor auth.

  • Microsoft photo Microsoft

    Open source projects and samples from Microsoft.

  • Google photo Google

    Google ❤️ Open Source for everyone.

  • D3 photo D3

    Data-Driven Documents codes.