Code Monkey home page Code Monkey logo

oxyplot's Introduction

OxyPlot is a cross-platform plotting library for .NET

License Build status

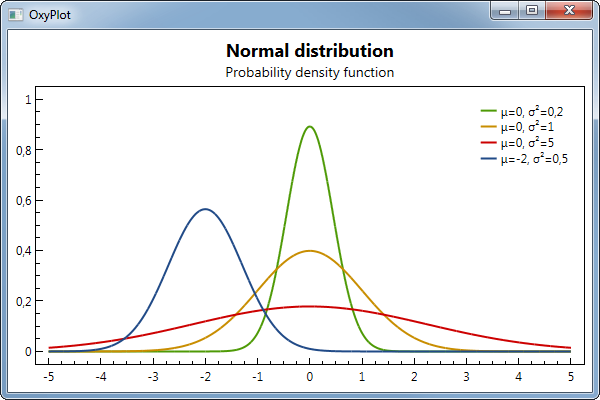
Plot

Getting started

  1. Use the NuGet package manager to add a reference to OxyPlot (see details below if you want to use pre-release packages)
  2. Add a PlotView to your user interface
  3. Create a PlotModel in your code
  4. Bind the PlotModel to the Model property of your PlotView

Examples

You can find examples in the /Source/Examples folder in the code repository.

NuGet packages

The latest pre-release packages are pushed by AppVeyor CI to myget.org. To install these packages, set the myget.org package source https://www.myget.org/F/oxyplot and remember the "-pre" flag.

The stable release packages will be pushed to nuget.org. Note that we have have a lot of old (v2015.*) and pre-release packages on this feed, and sometimes these show up even if they are unlisted.

See the wiki for information about the available packages.

More information

Contribute

See Contributing for information about how to contribute!

oxyplot's People

Contributors

alexeischerbakov avatar archeg avatar bblanchon avatar brannonking avatar cheesebaron avatar dsyme avatar geertvanhorrik avatar havendv avatar isolocis avatar jeremyiverson avatar jonarw avatar kfpulver avatar mattleibow avatar mitch-connor avatar mrtncls avatar objorke avatar olegtarasov avatar peter-b- avatar piotrwarzocha avatar rusamentiaga avatar sevoku avatar shoelzer avatar soarc avatar stefanradolf avatar thealmightybob avatar tibel avatar tr8dr avatar udoliess avatar visualmelon avatar zur003 avatar

Stargazers

 avatar  avatar  avatar  avatar  avatar  avatar  avatar  avatar  avatar  avatar  avatar  avatar  avatar  avatar  avatar  avatar  avatar  avatar  avatar  avatar  avatar  avatar  avatar  avatar  avatar  avatar  avatar  avatar  avatar  avatar  avatar  avatar  avatar  avatar  avatar  avatar  avatar  avatar  avatar  avatar  avatar  avatar  avatar  avatar  avatar  avatar  avatar  avatar  avatar  avatar  avatar  avatar  avatar  avatar  avatar  avatar  avatar  avatar  avatar  avatar  avatar  avatar  avatar  avatar  avatar  avatar  avatar  avatar  avatar  avatar  avatar  avatar  avatar  avatar  avatar  avatar  avatar  avatar  avatar  avatar  avatar  avatar  avatar  avatar  avatar  avatar  avatar  avatar  avatar  avatar  avatar  avatar  avatar  avatar  avatar  avatar  avatar  avatar  avatar  avatar

Watchers

 avatar  avatar  avatar  avatar  avatar  avatar  avatar  avatar  avatar  avatar  avatar  avatar  avatar  avatar  avatar  avatar  avatar  avatar  avatar  avatar  avatar  avatar  avatar  avatar  avatar  avatar  avatar  avatar  avatar  avatar  avatar  avatar  avatar  avatar  avatar  avatar  avatar  avatar  avatar  avatar  avatar  avatar  avatar  avatar  avatar  avatar  avatar  avatar  avatar  avatar  avatar  avatar  avatar  avatar  avatar  avatar  avatar  avatar  avatar  avatar  avatar  avatar  avatar  avatar  avatar  avatar  avatar  avatar  avatar  avatar  avatar  avatar  avatar  avatar  avatar  avatar  avatar  avatar  avatar  avatar  avatar  avatar  avatar  avatar  avatar  avatar  avatar  avatar  avatar  avatar  avatar  avatar  avatar  avatar  avatar  avatar  avatar  avatar  avatar  avatar

oxyplot's Issues

Tracker: add mode that tracks intersections

Imported from http://oxyplot.codeplex.com/workitem/10017

objo 2012-11-06 20:08
Create a "tracker mode" property

NearestPoint - as today

VerticalIntersect - find all intersections with the vertical line of the tracker

HorizontalIntersect - find all intersections with the horizontal line of the tracker

AngleIntersect/MagnitudeIntersect - for polar plots

note: a series may have multiple intersections...

Plot bounds change as plot is resized

Imported from http://oxyplot.codeplex.com/workitem/9981

tevo 2012-08-16 19:13
Steps to reproduce:

  1. Create a small plot.
  2. Plot a step function such as [0.0, 0.0, 1.0, 1.0].
  3. Set axis min/max to min/max values of the data.
  4. Note that all data is visible in the plot.
  5. Resize the plot to be very large.

Expected result: All data points should still be visible in the plot.

Observed result: Not all data points are visible. The plot bounds are slightly smaller than expected, so some data points are outside the plot bounds.

Set hatch pattern for area series

Imported from http://oxyplot.codeplex.com/workitem/9968

mohitvashistha 2012-07-25 12:36
Can we have support to have hatch fill for the area series and rectangular series.

objo 2012-08-09 09:15
It is a challenge to support hatch patterns on all platforms, I think the implementations will be quite different...

Maybe it is possible to implement a subset of the hash styles in the System.Drawing2D.HatchStyle enumeration:

http://msdn.microsoft.com/en-us/library/system.drawing.drawing2d.hatchstyle.aspx

I also understand from the books of Edward Tufte and Stephen Few that using hatch patterns is not really recommended...

ShowTracker should fire an event with the TrackerHitResult

Imported from http://oxyplot.codeplex.com/workitem/9979

drobson 2012-08-13 21:40
First off, thanks for your awesome work. This plotting library has been extremely useful.

I'm building a kind of "master details" gui where the user can explore a plot with the Tracker and see live updates in an associated details view. This was pretty easy once I added an event to OxyPlot.Wpf.Plot...

public event EventHandler TrackerUpdated;

public class TrackerEventArgs : EventArgs {

public TrackerHitResult Data { get; private set; }
public TrackerEventArgs(TrackerHitResult data) {
    Data = data;
}

}

... and updated the code in ShowTracker(...)

if (this.currentTracker != null) {

this.currentTracker.DataContext = trackerHitResult;
if (TrackerUpdated != null)
    TrackerUpdated(this, new TrackerEventArgs(trackerHitResult));

}

Any chance something like this could be added to the official code?

Thanks,

Drew

DateTimeAxis auto tick intervals

Imported from http://oxyplot.codeplex.com/workitem/7988

objo 2011-01-26 19:32
Improve the automatic tick intervals of the DateTimeAxis.

brantheman 2012-06-05 19:15
My fork (OxyPlotTickFixes) now contains a fix to make the DateTimeAxis go down to second resolution instead of minute resolution. I think that should cover the majority of complaints here.

RuslanBek 2014-03-17 19:56
Hello All,

i have reworked DateTimeAxis implementation to correctly work with all types of intervals (starting from seconds). Ticks for resolutions of days / months / years account for time zone and should correctly start at day / month / year break. Decision on size
of major / minor steps is also somewhat more intelligent than it was before.

For adjusted DateTimeAxis.cs see attachment

RuslanBek 2014-03-17 20:02
Some notes:

One should leave interval types to Auto to be able to zoom in/out correctly

DST change between ticks can result in irregularly-sized intervals

Replaced custom DateTime<->double conversion by ToOADate() and FromOADate() methods

objo 2014-03-17 21:24
RuslanBek: that's great work, but I can't get it to compile. Are you using some methods that are not available in portable class libraries? Also, we need unit tests and/or examples before any changes to the DateTimeAxis can be accepted! Please create a
fork and make a pull request when the feature is working.

RuslanBek 2014-03-18 20:47
Sorry, but i do not have PCL target installed (VS2013 express) and therefore cannot test it.

RuslanBek 2014-04-25 11:44
Here is updated version which does not use ToOADate() and is supported by PCL. It builds fine and i tested it with examples.

Support for selection

Imported from http://oxyplot.codeplex.com/workitem/8193

objo 2011-03-03 13:34
Selectable objects:

  • Series
  • Items of DataPointSeries
  • Axes
  • Annotations
  • Title/Subtitle
  • Legend box

Should support both single or multiple selection

Highlighting:

Clicking on a series or a legend should highlight the series, the legend and the current axes used by the series

Index out of bound in ContourSeries

Imported from http://oxyplot.codeplex.com/workitem/10004

mmickael 2012-09-08 15:26
Version 4.13.1

Not sure about the issue. Conrec.cs / public static void Contour(...) crashes with index out of bound in the following section.

// The indexing of im and jm should be noted as it has to

                                    // start from zero
                                    h[m] = d[i + im[m - 1], j + jm[m - 1]] - z[k];
                                    xh[m] = x[i + im[m - 1]];
                                    yh[m] = y[j + jm[m - 1]];

Specific line is

xh[m] = x[i + im[m - 1]];

Seems like x and y coming into the function are reversed but not sure.

Did not encounter this problem with the same data in 4.12.1 or previous versions.

Will try to create a clear test case and post it here.

Support scale break on axes

Imported from http://oxyplot.codeplex.com/workitem/8903

waist24 2011-07-07 15:35
Support scale break on axes

objo 2011-07-08 11:01
Thanks for a good feature request. I see devexpress have implemented this nicely.

http://documentation.devexpress.com/#XtraCharts/clsDevExpressXtraChartsScaleBreaktopic

I am not sure how to implement this yet - I guess it is necessary to make changes to both the transforms and the auto tick number algorithm.

Are scale breaks on log axes also needed? Multiple scale breaks? Is it ok to limit to the same scaling of the axis on each side of the break? Should it be possible to set the position of the break (as a fraction of the axis length)?

The easiest solution is probably to use multiple axes and let e.g. the LineSeries select which x/y axis to use depending on the x/y value.

Scatterplot series not responsive to Mouse Events

Imported from http://oxyplot.codeplex.com/workitem/9960

pcttechnical 2012-05-24 09:50

How to recreate:

(Using WPF)

In the OxyPlot.WPF Example Browser alter the 'Mouse Events > LineSeries and PlotModel MouseDown event' example in the 'MouseDownEvent()' method by adding the following code:

        // Add a scatter series
        var s2 = new ScatterSeries("LineSeries1")
        {
            MarkerType = MarkerType.Circle,
            MarkerSize = 6,
            MarkerStroke = OxyColors.White,
            MarkerFill = OxyColors.Black,
            MarkerStrokeThickness = 1.5
        };
        s2.Points.Add(new DataPoint(10, 10));
        s2.Points.Add(new DataPoint(20, 40));
        s2.Points.Add(new DataPoint(50, 20));
        s2.Points.Add(new DataPoint(70, 30));
        model.Series.Add(s2);
        s2.MouseDown += (s, e) =>
        {
            Console.WriteLine("s2 Mouse down"); //<<== this line will never be hit
        };

Clicking the new scatter points will not fire the mouse event.

The reason appears to be that the 'GetNearestPoint' method in ScatterSeries.cs is always called with a value of True for the boolean variable 'interpolate'. This is called from the 'HitTest' method in Series.cs.

Solution:

I don't understand the implications properly but one possible solution would be to change the line :

if (interpolate)

to:

if (interpolate && this.CanTrackerInterpolatePoints)

in method 'GetNearestPoint' of ScatterSeries.cs and then set CanTrackerInterpolatePoints = false for the scatter series.

Complete XAML support

Add XAML support for all types of annotations, axes and series for

  • WPF
  • UWP
  • Xamarin Forms
  • Avalonia

Include all properties.

Create a tool that generates this code automatically.

Zooming/panning on axis not working with AutoAdjustPlotMargins = false

Imported from http://oxyplot.codeplex.com/workitem/9595

objo 2011-11-18 06:23
bug introduced with implementation of PositionTier

anomistu 2011-11-24 14:07
Other issues with AutoAdjustPlotMargins = false (you probably know about) are overlapping of tiers and axis title displayed within the plot area.

joemoorhouse 2012-07-14 22:47
Seems to be just that the AdjustPlotMargins method of PlotModel does not get called with AutoAdjustPlotMargins = false. This should be called in the Render method (in PlotModel.Rendering.cs) in order to set PositionTierMinShift etc (which are ultimately
required for zooming and panning). I tried rewriting the method slightly so that these properties can be set without adjusting the margin and it seems to do the trick. I now need to create a branch and figure out how to run tests to make sure all is well.

sub/superscript in Axis titles doesn't work

Imported from http://oxyplot.codeplex.com/workitem/10018

tan_force_dk 2012-11-23 07:58
Here:
http://oxyplot.codeplex.com/wikipage?title=Superscript%20and%20subscript it is explained how to use super/subscript in titles, but at least for Axis titles it doesn't work.

objo 2012-12-16 10:11
this is related to
http://oxyplot.codeplex.com/workitem/7717

objo 2013-02-02 19:10
It now works for horizontal titles. Issue #7717 must be solved before it works on vertical titles.

Issue #9972 is also related to this.

ResetAllAxes does not take into account AbsoluteMinimum and AbsoluteMaximum of Axis

Imported from http://oxyplot.codeplex.com/workitem/9969

ishanSaxena 2012-07-26 14:52
I like OxyPlot very much. But I am finding it hard, when I want to zoom to full extents of the plot using ResetAll Axes() function and just want to clip some portion of the plot. It seems like ResetAllAxes ignores AbsoluteMinimum and AbsoluteMaximum of
Axis and applies zoom extents as per the series data. Can you please suggest how I can restrict ResetAllAxes function to zoom to the AbsoluteMaximum and AbsoluteMinimum of the Axes.

mohitvashistha 2012-07-27 08:14
To achieve the above mentioned zoom extent behavior you need to set Maximum and Minimum along with the AbsoluteMaximum and AbsoluteMinimum properties of the Axis.

Logarithmic axis tick intervals

Imported from http://oxyplot.codeplex.com/workitem/8772

objo 2011-06-09 09:51
improve the algorithm that calculates tick intervals when the ratio between Maximum and Minimum is small.

Example: an axis from 13 to 18 could show major ticks at 13, 14, 15, 16, 17, 18.

major ticks: tick line + number

minor ticks: small tick line only

mwas 2011-06-23 14:05
To improve on the current situation how about?

double axisMin = Math.Pow(10.0, Math.Floor(Math.Log10(min)));

double axisMax = Math.Pow(10.0, Math.Ceiling(Math.Log10(max)));

This would allow at least one cycle if the minimum/maximu values were very close.

objo 2011-06-23 22:39
yes, I think this is how Excel does it in its 'Auto' mode. If you have two values 13 and 18, you will get a log axis from 1 to 100. Tick labels will be at 1, 10 and 100.

We could implement this code as an alternative to the Oxyplot default behaviour, but this will give a lot of empty area below and above the curve!

And this does still not solve the problem when the user has zoomed in around 13 to 18... What is mostly needed is an algorithm to find nice major tick values.

(ps. try setting min/max manually in Excel, and you will see Excel has the same problem - only the minimum value 13 will be shown on the axis!)

OxyPlot is currently using the actual min/max of the data values as limits for the axis (and possibly adding some 'padding'). That means that the actual min/max of the axis will be approx. 12.95 and 18.05 with padding 1%.

These min/max values could also be the case if you have zoomed/panned an axis!

I would like an algorithm that finds nice intervals for both major and minor ticks.

One idea is to use linear intervals if log intervals results in 0 or 1 major ticks.

Here are some more test cases (Base=10):

Min = 13, Max = 18 => Major ticks at 13, 14, 15, 16, 17, 18 (linear)

Min = 13.1, Max = 13.2 => Major ticks at 13.1, 13.12, 13.14, 13.16, 13.18, 13.2 (linear)

Min = 8, Max = 110 = > Major ticks at 8,9,10,20,30,40,50,60,70,80,90,100,110 ? (linear+linear)

Min = 8, Max = 310 = > Major ticks at 8,10,20,40,60,80,100,200,300 ? (linear+linear+linear)

Min = 3, Max = 30 => Major ticks at 3,4,5,6,7,8,9,10,20,30 ? (linear+linear)

objo 2011-06-24 20:39
I added the padding code in 68113! It can be controlled by the "PowerPadding" property (by default it is on) (suggestions for better name of the property is welcome!) This seems to work well as long as you not zoom/pan...

I also changed the tick interval algorithm - it will use the linear algorithm when less than two ticks are generated by the log algorithm. This is not the optimal solution, but at least you will always get at least two numbers on the axis.

I keep the issue open as I would like to see a better solution.

Position of axis title

Imported from http://oxyplot.codeplex.com/workitem/9594

objo 2011-11-18 06:22
Wrong position of axis title when angle is != 0.

brantheman 2012-05-30 22:46
I agree. The titles are centered, when I think an angled label is expected to be mid-left oriented such that the text starts aligned with the column bar. And we don't want the text on the graph itself. Even moving it down still leaves the text way too
far left.

brantheman 2012-05-30 23:30
I thought at first that this text was being rendered by the ColumnSeries RenderLabel method. That's nice because I could override that method (and use an ugly hack to get at the internal ValidItemsIndexInversion). However, that method is not hit. Rather
it appears that the text is rendered in the HorizontalAndVerticalAxisRenderer class, and I have no way to inject my inheritor of that class. (And that class is not modular enough to overload in a decent fashion.) In general, I think OxyPlot could benefit a
lot from an IoC approach to overriding the rendering.

brantheman 2012-05-31 00:25
I attempted to find all children TextBlock objects and update their transform. However, the chart is rendered in the CompositeTarget.Rendering method. I have no way to know when that is done processing. There's not a single virtual method in PlotModel
(period) that I can override to determine when the rendering is done. Somebody throw me a bone...

objo 2012-06-04 22:25
I guess you mean the axis values (numbers, category name, date, time), not the titles?

And this is only a problem on horizontal axes?

I tried the following model:

    [Example("Angled axis numbers")]
    public static PlotModel AngledAxisNumbers()
    {
        var model = new PlotModel("Angled axis numbers");
        model.Axes.Add(new LinearAxis(AxisPosition.Bottom, -1, 1, "Bottom axis") { Angle = 45 });
        model.Axes.Add(new LinearAxis(AxisPosition.Left, -1, 1, "Left axis") { Angle = 45 });
        model.Axes.Add(new LinearAxis(AxisPosition.Top, -1, 1, "Top axis") { Angle = 45 });
        model.Axes.Add(new LinearAxis(AxisPosition.Right, -1, 1, "Right axis") { Angle = 45 });
        return model;
    }

Is this reproducing your issue properly?

We should correct the bug on the horizontal alignment for the rotated values.

Can also make more of the rendering virtual as you suggest, that is probably a good idea!

brantheman 2012-06-05 19:10
Yes, the axis values should not be centered when using the Angle feature. I made a fork entitled OxyPlotTickFixes that now contains some virtual methods. Using those I was able to work around this issue with my own inheritor of CategoryAxis like this:

private class SlantCategoryAxis: CategoryAxis

{

public SlantCategoryAxis(): base(AxisPosition.Bottom)
{
    Angle = 25;
    IsTickCentered = false;
    AxisTickToLabelDistance = 0;
}

private class SlantRenderer: HorizontalAndVerticalAxisRenderer
{
    public SlantRenderer(IRenderContext rc, PlotModel plot) : base(rc, plot) { }

    protected override void GetAxisLabelRotatedAlignments(double angle, HorizontalTextAlign defaultHorizontalAlignment, VerticalTextAlign defaultVerticalAlignment, out HorizontalTextAlign ha, out VerticalTextAlign va)
    {
        ha = HorizontalTextAlign.Left;
        va = VerticalTextAlign.Middle;
    }
}

public override AxisRendererBase CreateRenderer(IRenderContext rc, PlotModel model)
{
    return new SlantRenderer(rc, model);
}

}

EvaldsUrtans 2013-10-18 11:38
You can also make some changes in HorizontalAndVerticalAxisRenderer class

If you have code:

CategoryAxis categoryAxis = new CategoryAxis 
{ 
    Position = AxisPosition.Bottom,
    AxislineStyle = LineStyle.Solid,
    TickStyle = TickStyle.None,
    IsPanEnabled = false,
    IsZoomEnabled = false,
    Angle = 45,
    IsTickCentered = false,
    AxisTickToLabelDistance = 10
};

You can add these lines in Oxyplot\Render\HorizontalAndVerticalAxisRenderer.cs:

var pt = new ScreenPoint();
var ha = HorizontalAlignment.Right;
var va = VerticalAlignment.Middle;
switch (axis.Position)
{
    case AxisPosition.Left:
        pt = new ScreenPoint(axisPosition + a1 - axis.AxisTickToLabelDistance, transformedValue);
        this.GetRotatedAlignments(
            axis.Angle, HorizontalAlignment.Right, VerticalAlignment.Middle, out ha, out va);
        break;
    case AxisPosition.Right:
        pt = new ScreenPoint(axisPosition + a1 + axis.AxisTickToLabelDistance, transformedValue);
        this.GetRotatedAlignments(
            axis.Angle, HorizontalAlignment.Left, VerticalAlignment.Middle, out ha, out va);
        break;
    case AxisPosition.Top:
        pt = new ScreenPoint(transformedValue, axisPosition + a1 - axis.AxisTickToLabelDistance);
        this.GetRotatedAlignments(
            axis.Angle, HorizontalAlignment.Center, VerticalAlignment.Bottom, out ha, out va);
        break;
    case AxisPosition.Bottom:
        pt = new ScreenPoint(transformedValue, axisPosition + a1 + axis.AxisTickToLabelDistance);
        this.GetRotatedAlignments(
            axis.Angle, HorizontalAlignment.Center, VerticalAlignment.Top, out ha, out va);
        break;
}

//Add following block
if(axis is CategoryAxis)
{
    if(axis.Angle != 0.0)
    {
        ha = HorizontalAlignment.Left;
        va = VerticalAlignment.Middle;
    }
}

objo 2014-07-10 12:15
Please create a pull request including an example!

BoxPlotSeries Tracker info

Imported from http://oxyplot.codeplex.com/workitem/10005

kelvinlaw 2012-09-12 16:02
Tracker information for the Box Plot Series does not use the X Axis title:

  • Scatter plot: "{X axis title} : {X value} ..."
  • Box plot: "X : {X Value}"

Should the format string force the format of the values as well?

Potiential solution:

this.TrackerFormatString = "{7}: {1:0.00}\nUpper Whisker: {2:0.00}\nThird Quartil: {3:0.00}\nMedian: {4:0.00}\nFirst Quartil: {5:0.00}\nLower Whisker: {6:0.00}";

this.OutlierTrackerFormatString = "{3}: {1:0.00}\n{4}: {2:0.00}";

GetNearestPoint() {

...

        var xaxisTitle = this.XAxis.Title ?? "X";
        var yaxisTitle = this.YAxis.Title ?? "Y";

...

        result.Text = StringHelper.Format(
                        this.ActualCulture, 
                        ...
                        outlier,
                        xaxisTitle,
                        yaxisTitle);

}

Strange zooming behavior when resizing winform

Imported from http://oxyplot.codeplex.com/workitem/9955

wvd_vegt 2012-04-21 10:48
Hi,

I compiled the WindowsFormsDemo and zoomed a litte in with the scroll wheel of my mouse (sofar so good).

But if you resize the window a couple of time by dragging it larger and smaller again the graph starts shrinking as the axes min.max keep growing faster and faster. Just tried it without zooming firts and then it also happens!

Btw nice OxyPlot produces very nice looking graphs.

wvd_vegt

objo 2012-04-21 13:17
I think this is related to an error when using PlotType=Cartesian. Try the example browser - do you see this behaviour in other plots?

wvd_vegt 2012-04-22 11:46
Hi

It's only the Cartesian plot type as far as I can tell. The example in the example browser has the same bug.

wvd_vegt

WPF clipboard copy does not work with transparent background

Imported from http://oxyplot.codeplex.com/workitem/9958

objo 2012-05-10 23:24
Clipboard.SetImage does not seem to work with transparent BitmapSources. Using pixel format Pbgra32 does not help.

Work-around: set a background color

tibel 2014-03-22 11:22
This is a WPF bug, so OxyPlot can't do more than the actual workaround.

objo 2014-03-23 07:33
Can other formats than BMP be used? e.g setting the data object and not the bitmap on the clipboard.

tibel 2014-03-23 08:38
Maybe there is a way. Check following links:

Semi-circle polar plots

Imported from http://oxyplot.codeplex.com/workitem/9997

objo 2012-08-29 06:39
Create polar plot using a semi circle (the arc angle could be a property).

See http://oxyplot.codeplex.com/discussions/393407

aec 2012-08-30 19:11
Here, it would beo more flexible to have a start and a stop angle.

objo 2012-09-02 23:13
Yes, start and stop angle should be defined. I think a small challenge is to find the origin point of the polar plot in this case - need to find the bounding rectangle for a polar "pie slice".

objo 2012-10-21 23:05
Added StartAngle and EndAngle properties. Reversed angle direction. For semi-circles we also need to change the midpoint of the plot.

Recommend Projects

  • React photo React

    A declarative, efficient, and flexible JavaScript library for building user interfaces.

  • Vue.js photo Vue.js

    ๐Ÿ–– Vue.js is a progressive, incrementally-adoptable JavaScript framework for building UI on the web.

  • Typescript photo Typescript

    TypeScript is a superset of JavaScript that compiles to clean JavaScript output.

  • TensorFlow photo TensorFlow

    An Open Source Machine Learning Framework for Everyone

  • Django photo Django

    The Web framework for perfectionists with deadlines.

  • D3 photo D3

    Bring data to life with SVG, Canvas and HTML. ๐Ÿ“Š๐Ÿ“ˆ๐ŸŽ‰

Recommend Topics

  • javascript

    JavaScript (JS) is a lightweight interpreted programming language with first-class functions.

  • web

    Some thing interesting about web. New door for the world.

  • server

    A server is a program made to process requests and deliver data to clients.

  • Machine learning

    Machine learning is a way of modeling and interpreting data that allows a piece of software to respond intelligently.

  • Game

    Some thing interesting about game, make everyone happy.

Recommend Org

  • Facebook photo Facebook

    We are working to build community through open source technology. NB: members must have two-factor auth.

  • Microsoft photo Microsoft

    Open source projects and samples from Microsoft.

  • Google photo Google

    Google โค๏ธ Open Source for everyone.

  • D3 photo D3

    Data-Driven Documents codes.