Code Monkey home page Code Monkey logo

live-charts's Introduction


This project will continue in another repo, please see LiveCharts2 for more info

LiveCharts 1.0 is coming soon (ETA AprilSeptember 2018)!

We are doing a full rewrite of the library with all the learned lessons, the new version is focused on:

* If you own the Geared package the new high performance version is already yours! thank you very much for all your support!

* Portability: In version 0.x it was hard keep WPF, UWP and Winforms versions up to date, in the new version we extracted all the math to a dotnet core project, then we are working on 4 different platfomrs WPF, Xamarin, UWP and the new high performance package.

* Performance: when the library started, performance was not the target, as the library community grow, the Geared package was released (the current high performance version), and it works for many cases, but we want LiveCharts to be the fastest library out there, in the new high performance package we are scaping from WPF performance limitations and drawing everything using DirectX with the well know SharpDx package.

* 3d: 0.x layout was not designed to draw 3d plots, version 1.0 is really flexible and lucky we will be on 3d soon. * Keep it easy!: Even somethings might change, the idea of the library is the same, we only want to add support for the missing features and/or a better code quality so we can fix issues faster for all the platforms, all the samples will be updated with the new version.

Check out our progress at v1.0 branch.

GitHub license AppVeyor GitHub issues Gitter Average time to resolve an issue Percentage of issues still open

  • Get Started Here, this repository has many examples also.
  • Chat
  • Questions and support?, we are always happy to help you at our chat, if you require so you can also try Stack Overflow.

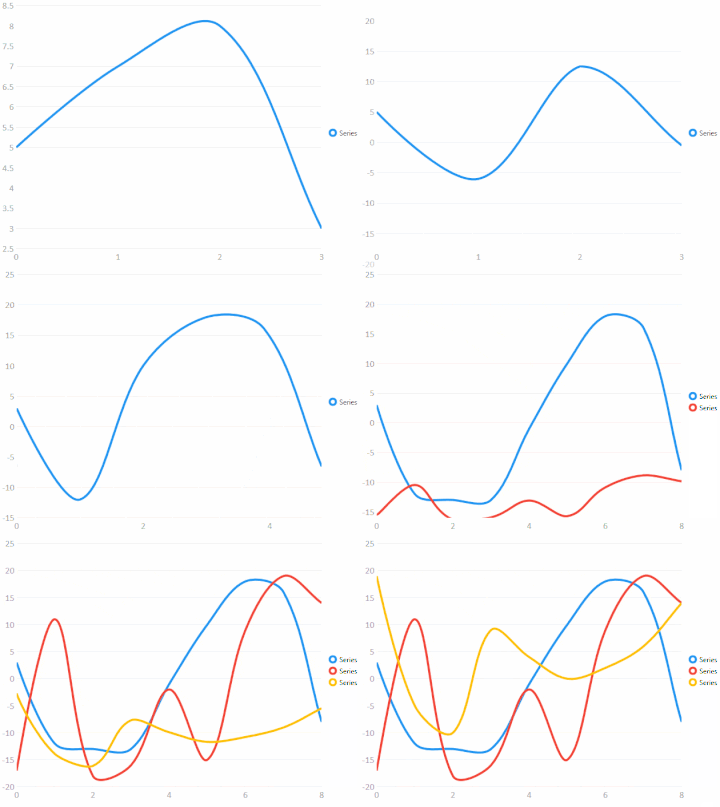
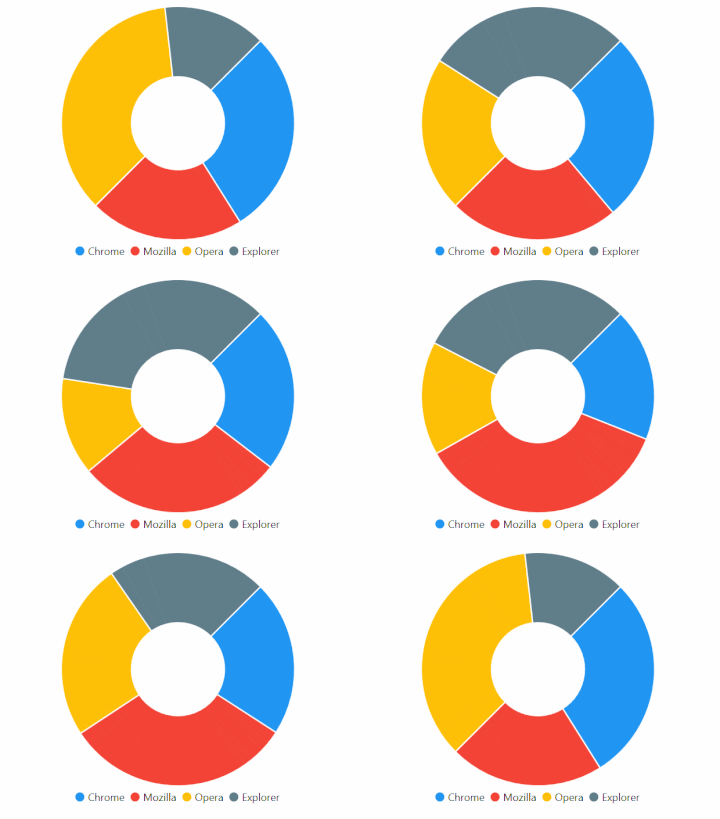
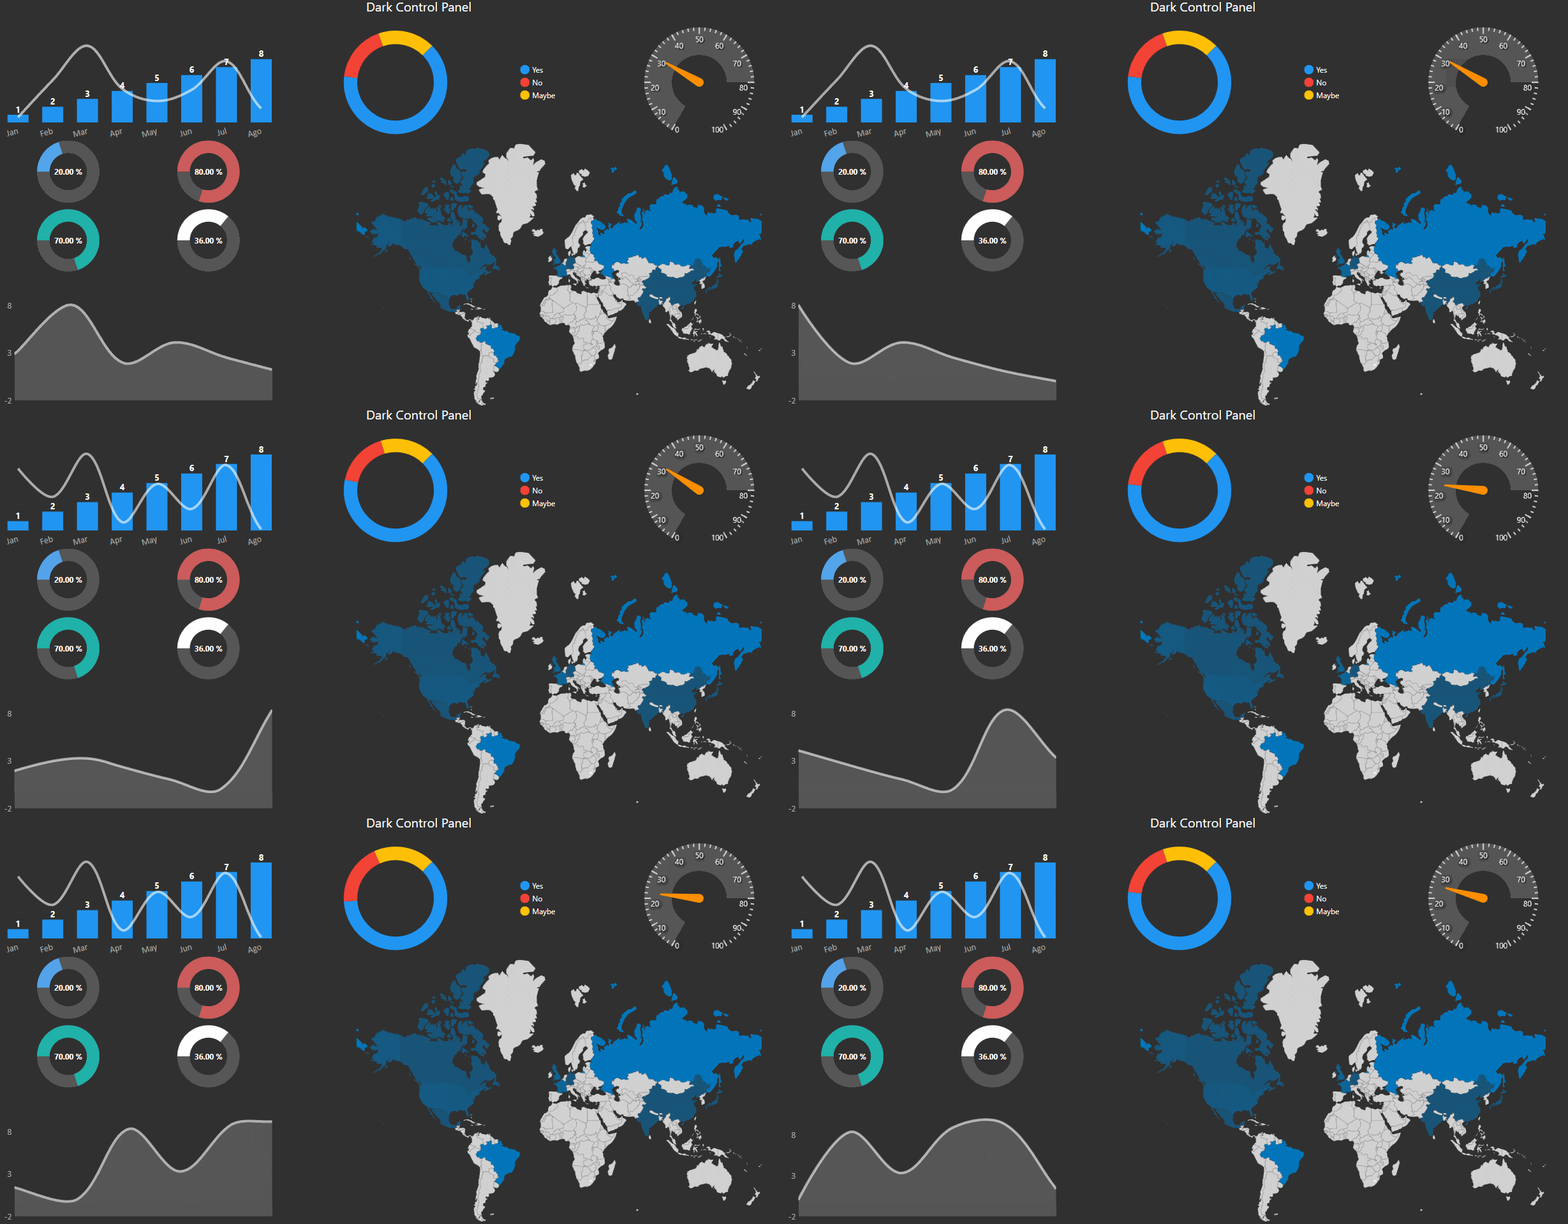
LiveCharts is

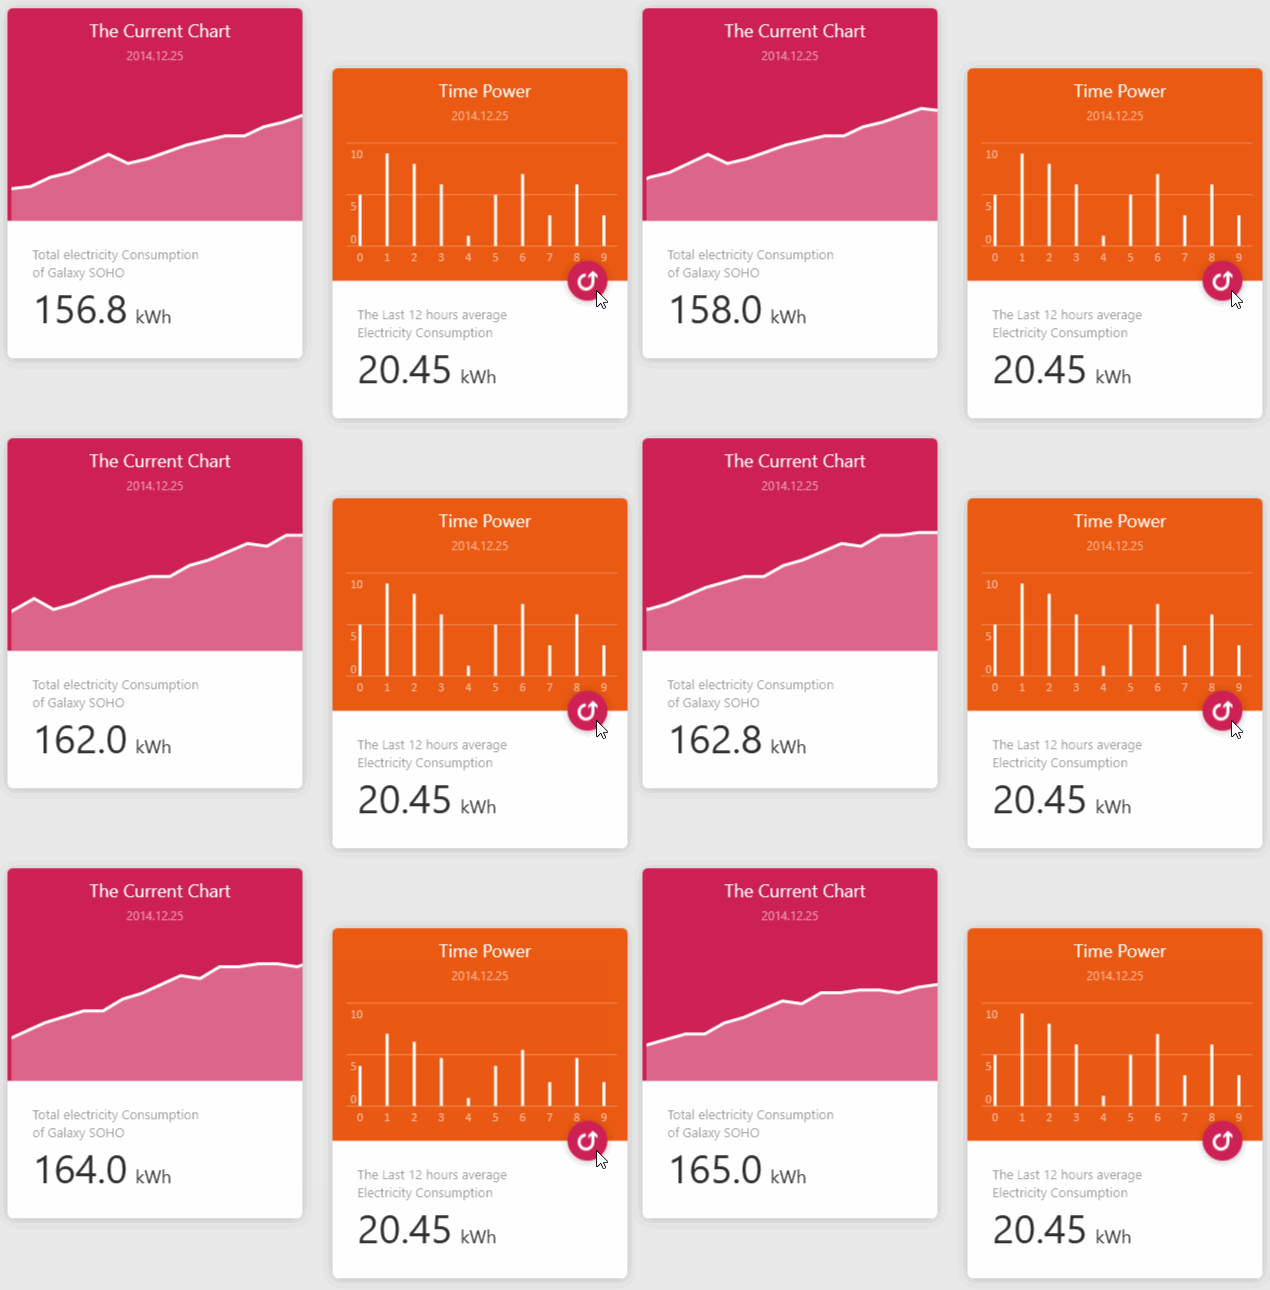
Flexible, Customizable

images in this section are built with LiveCharts, but designed by Kingyo

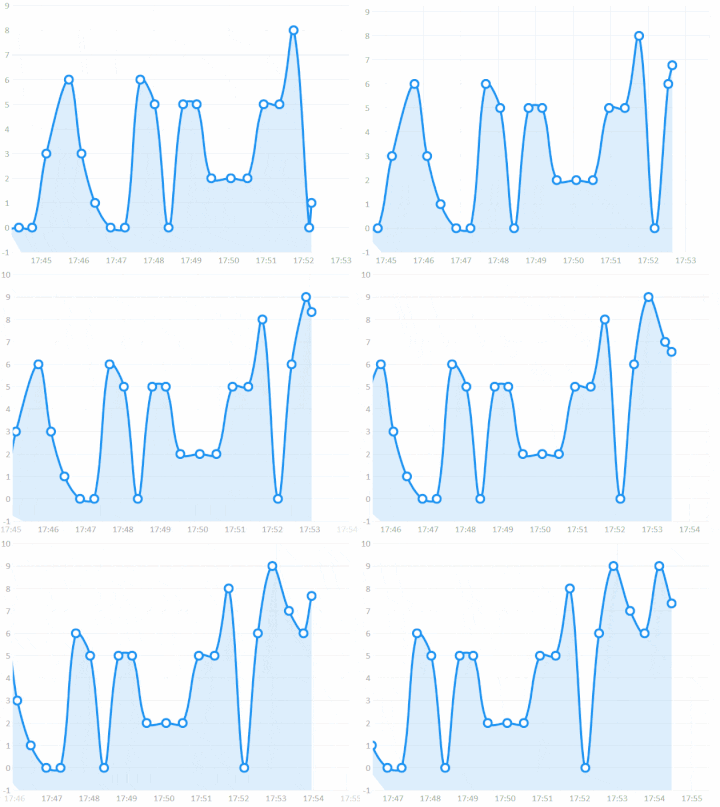
it is also

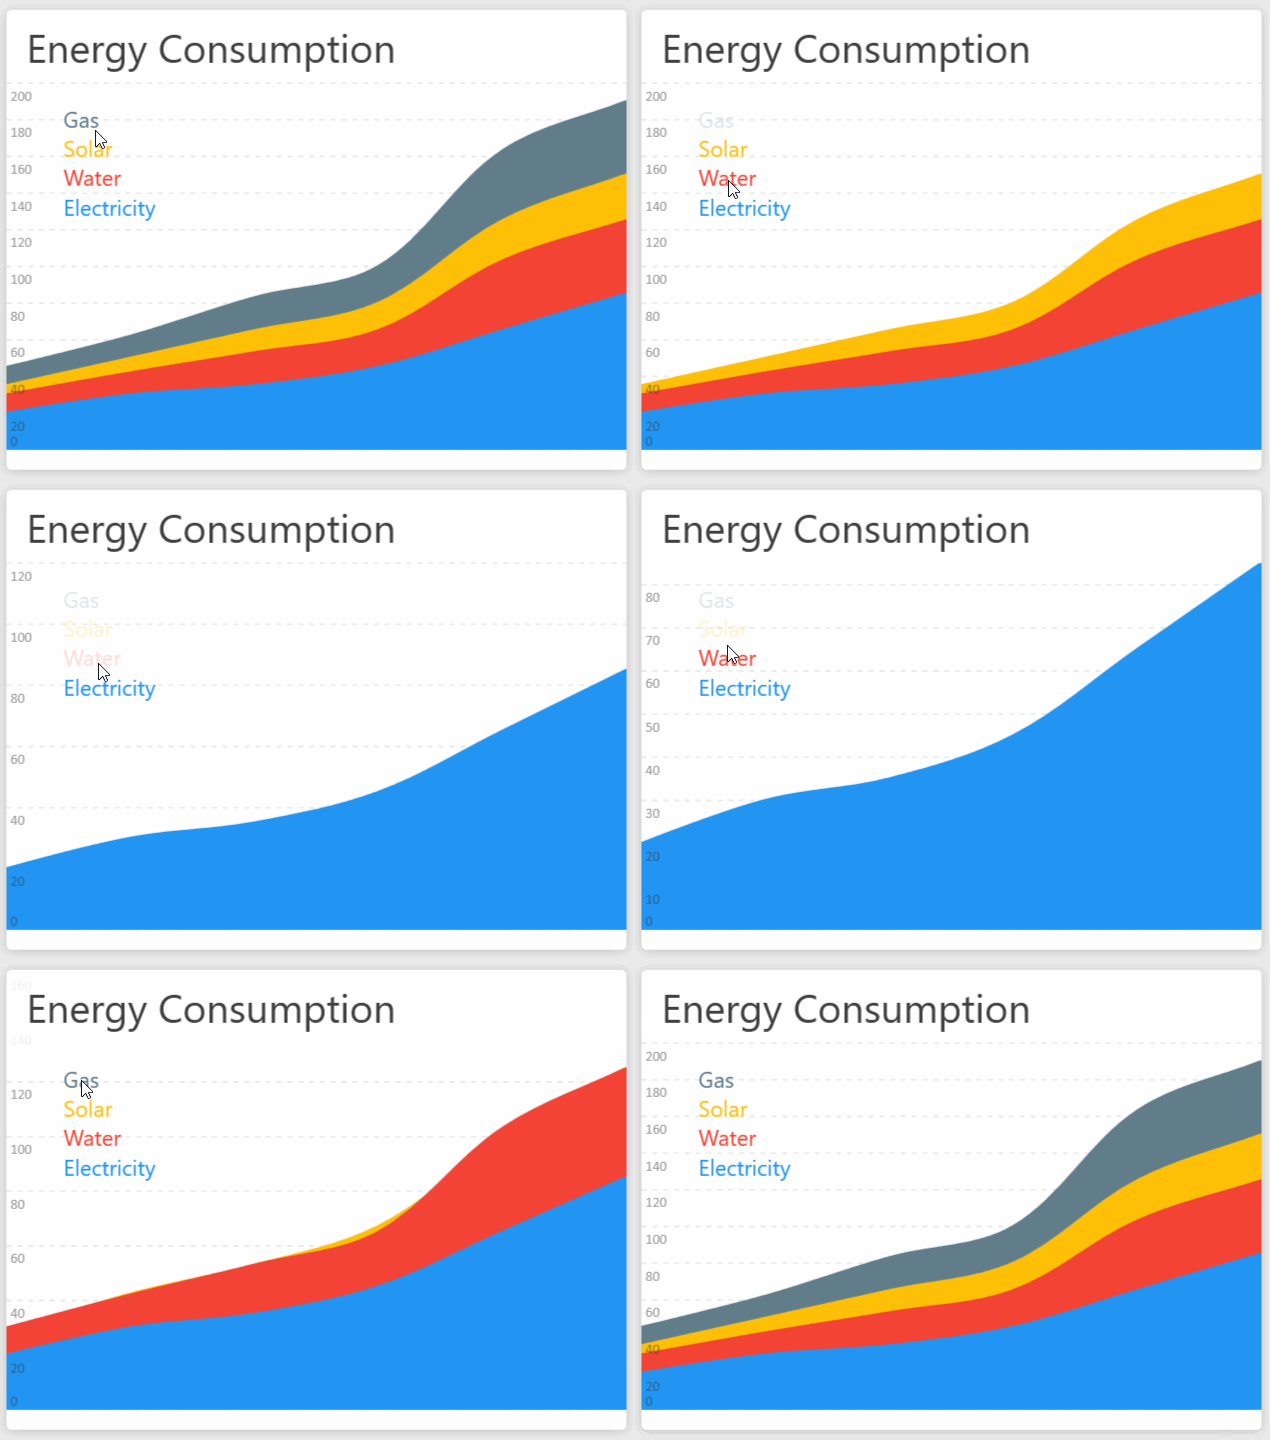
Simple, Interactive

As easy as manipulating any generic list in .Net, LiveCharts updates and animates as your data changes in real time, charts are also sensitive to size changes.

/

and of course it also is

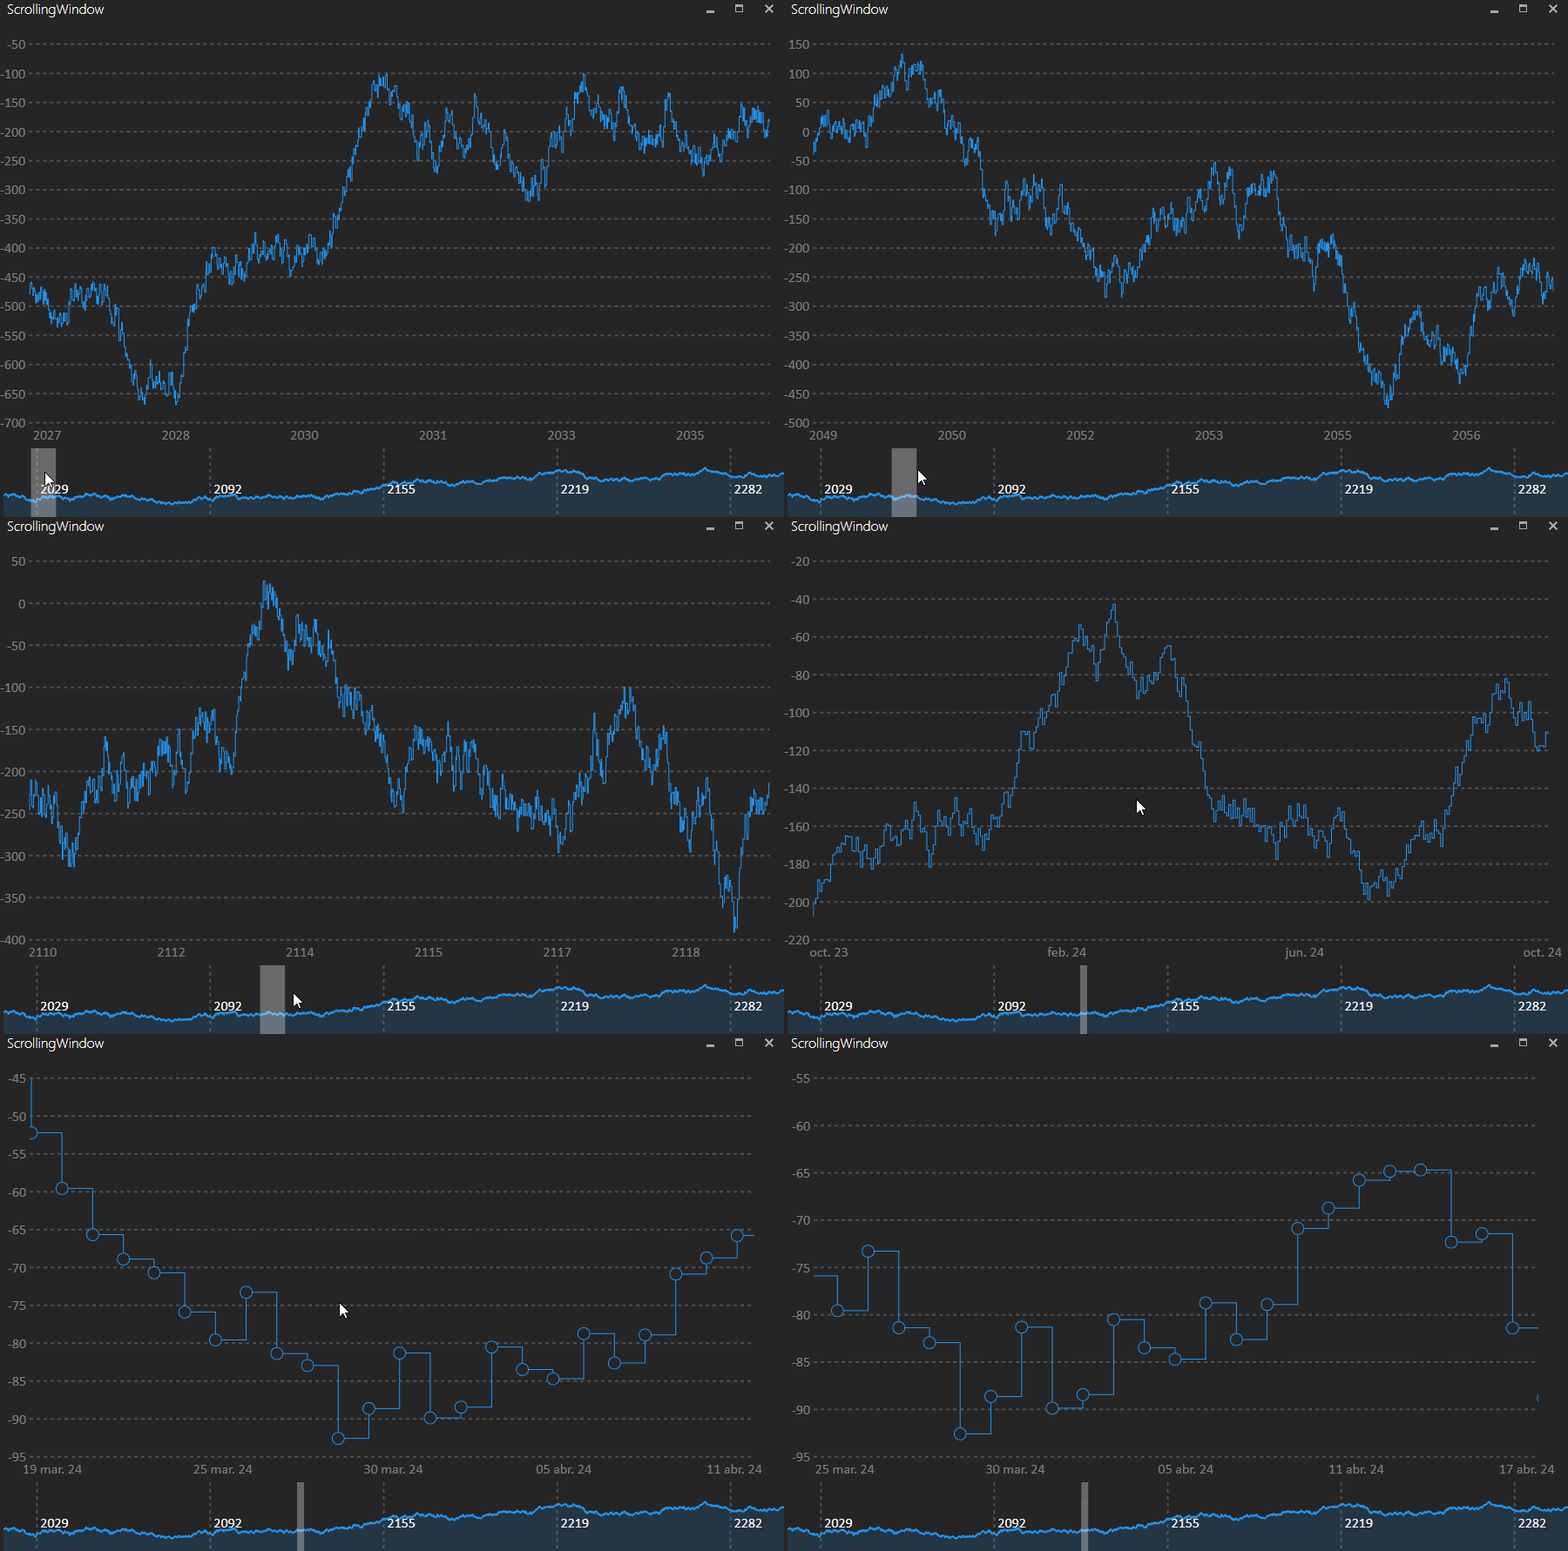
Powerful

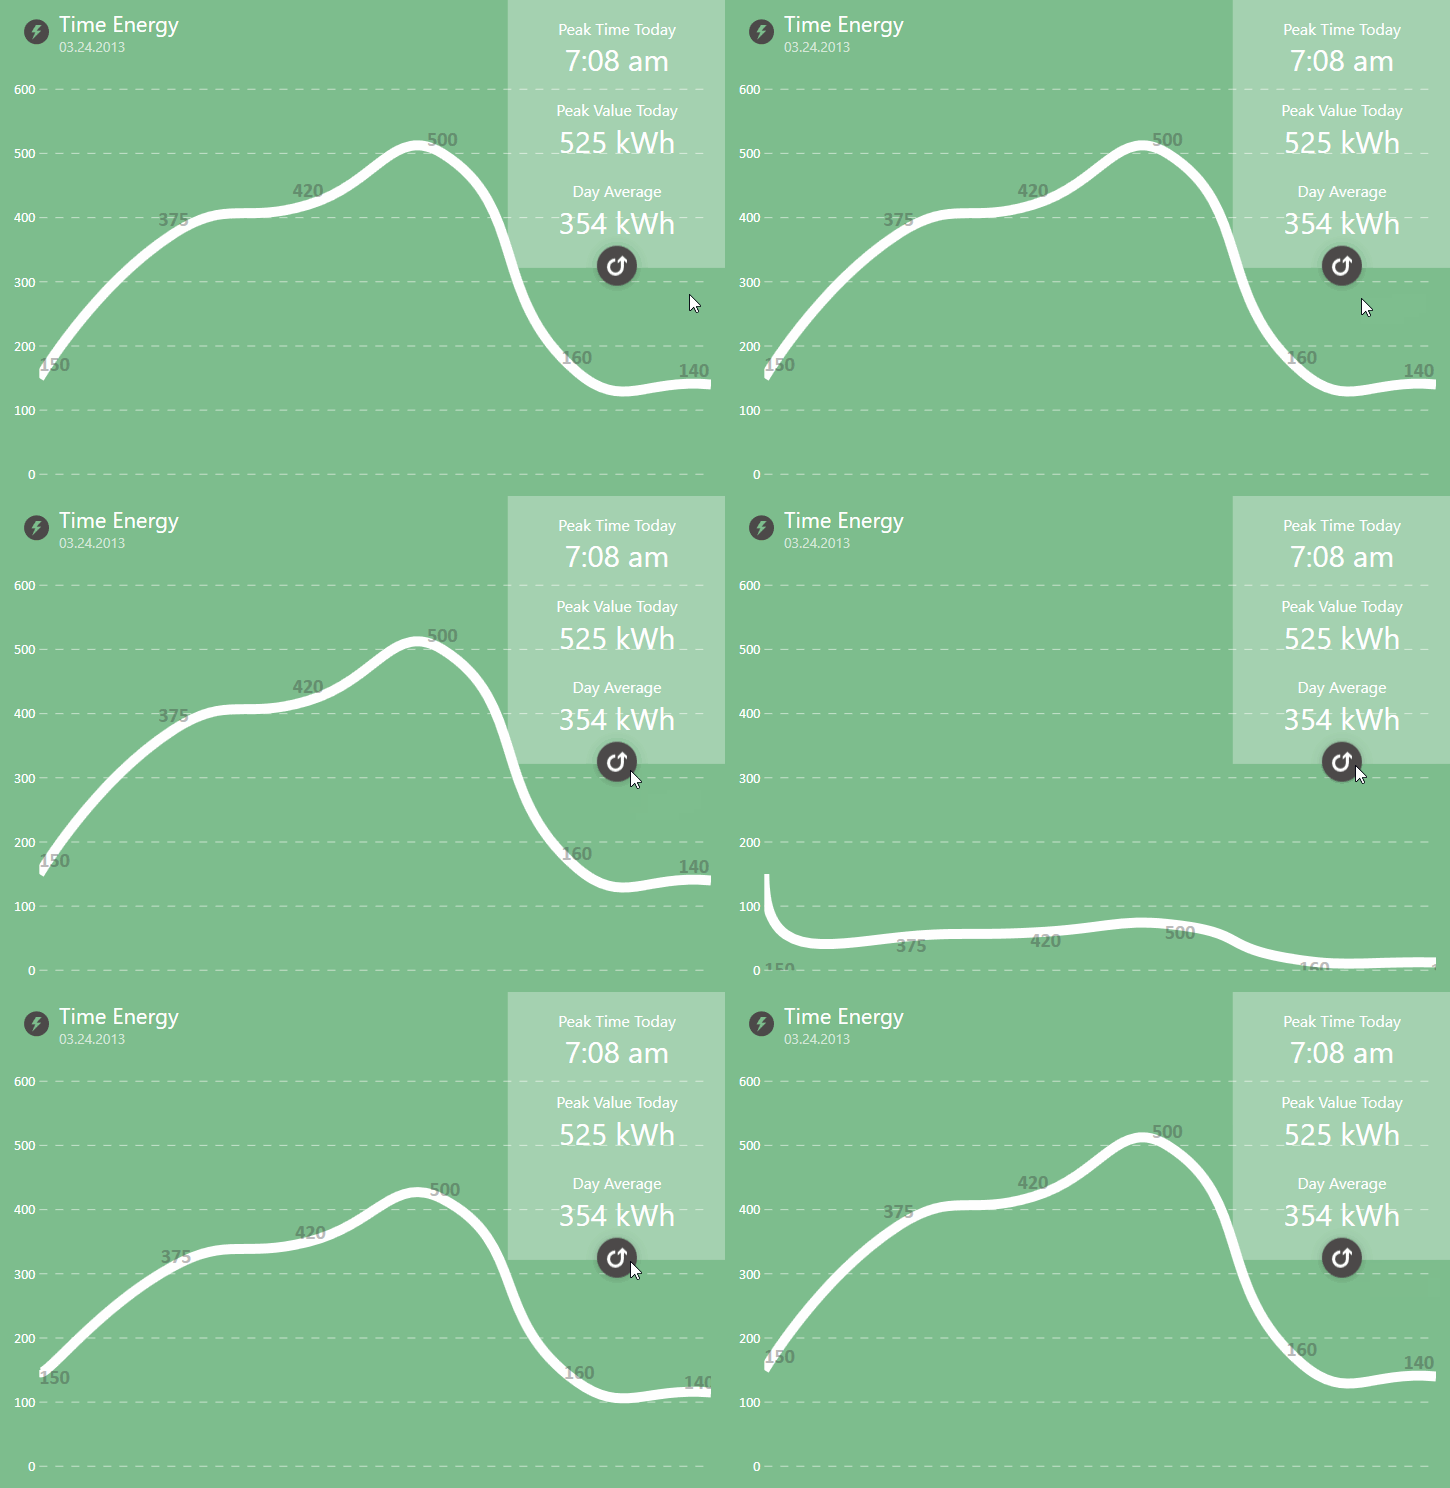
LiveCharts is not just beauty charts, this example contains 100,000 points, and the chart is being refreshed constantly, we support zooming, panning, multiple axes, sections, merged UIelemnts and much more!

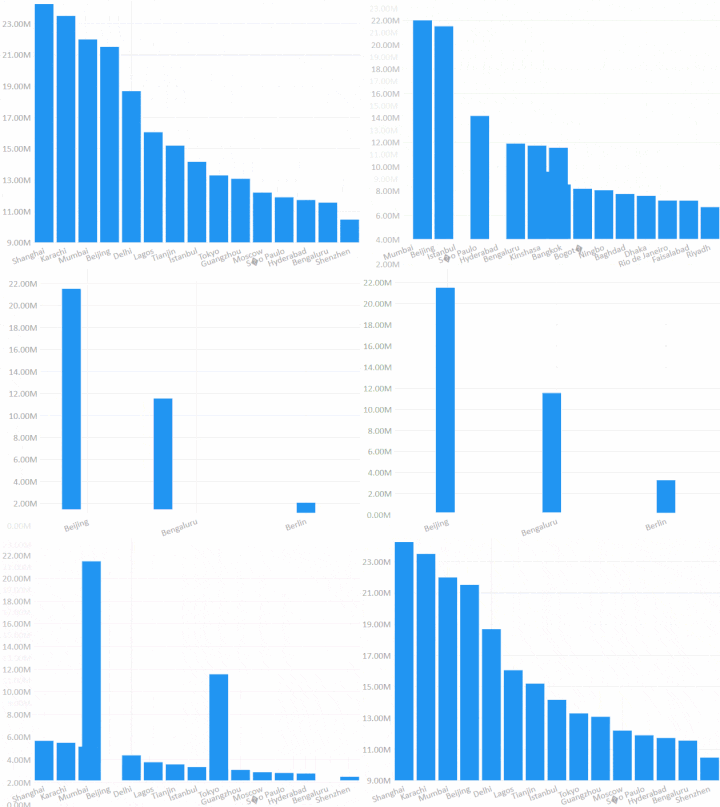
But that is not all, we try to support as many charts as possible, bars, lines, heat maps, gauges, maps:

Road Map

  • Build at least all the features any other charting library does, in WPF and WinForms
  • [In progress] Build High performance algorithms
  • [In progress] Expand the library to:
    • WPF
    • WinForms
    • UWP [In progress]
    • Xamarin
  • Release 1.0 in WPF and WinForms, the other platforms will be beta, in case something went wrong.

Support

WPF and Winforms, currenlty the library is in the process to become a cross net library...

Net Version

.Net 4.0 or greater

Installation

Migrating from older versions?

Please see https://github.com/beto-rodriguez/Live-Charts/releases

How to Contribute

  • Star this repo
  • Try it
  • Report Issues and Improvements
  • Pull request are well received

You can also buy me a beer

[paypal](https://www.paypalobjects.com/en_US/i/btn/btn_donateCC_LG.gif)](https://www.paypal.com/cgi-bin/webscr?cmd=_s-xclick&hosted_button_id=J86WDLSS9PWGL)

Examples?

The web site has a nice set, they are also built in the examples folder up here ^^^^

Special thanks to

live-charts's People

Contributors

ababilone avatar atomski-mrav avatar auroradysis avatar beto-rodriguez avatar bryant1410 avatar btordz avatar buybackoff avatar camou23 avatar deadlyembrace avatar douglasrocha avatar g1ga avatar gitter-badger avatar gregsdennis avatar hulihutu9 avatar ibebbs avatar ippo343 avatar jasonkatz89 avatar jplemieuxcroesus avatar mariozg avatar megadan2 avatar mirthestam avatar obiben avatar philippevialatte avatar philipxyc avatar punker76 avatar teraznie avatar thefirecookie avatar viburnum avatar

Stargazers

 avatar  avatar  avatar  avatar  avatar  avatar  avatar  avatar  avatar  avatar  avatar  avatar  avatar  avatar  avatar  avatar  avatar  avatar  avatar  avatar  avatar  avatar  avatar  avatar  avatar  avatar  avatar  avatar  avatar  avatar  avatar  avatar  avatar  avatar  avatar  avatar  avatar  avatar  avatar  avatar  avatar  avatar  avatar  avatar  avatar  avatar  avatar  avatar  avatar  avatar  avatar  avatar  avatar  avatar  avatar  avatar  avatar  avatar  avatar  avatar  avatar  avatar  avatar  avatar  avatar  avatar  avatar  avatar  avatar  avatar  avatar  avatar  avatar  avatar  avatar  avatar  avatar  avatar  avatar  avatar  avatar  avatar  avatar  avatar  avatar  avatar  avatar  avatar  avatar  avatar  avatar  avatar  avatar  avatar  avatar  avatar  avatar  avatar  avatar  avatar

Watchers

 avatar  avatar  avatar  avatar  avatar  avatar  avatar  avatar  avatar  avatar  avatar  avatar  avatar  avatar  avatar  avatar  avatar  avatar  avatar  avatar  avatar  avatar  avatar  avatar  avatar  avatar  avatar  avatar  avatar  avatar  avatar  avatar  avatar  avatar  avatar  avatar  avatar  avatar  avatar  avatar  avatar  avatar  avatar  avatar  avatar  avatar  avatar  avatar  avatar  avatar  avatar  avatar  avatar  avatar  avatar  avatar  avatar  avatar  avatar  avatar  avatar  avatar  avatar  avatar  avatar  avatar  avatar  avatar  avatar  avatar  avatar  avatar  avatar  avatar  avatar  avatar  avatar  avatar  avatar  avatar  avatar  avatar  avatar  avatar  avatar  avatar  avatar  avatar  avatar  avatar  avatar  avatar  avatar  avatar  avatar  avatar  avatar  avatar  avatar  avatar

live-charts's Issues

Randomize starting color

When you have multiple charts on view, it looks boring that they all have same color, it would be nice to create a property to indicate if chart must use a random starting color index

image

Null separator throws exception.

Tried to do this:

<lc:Axis MinValue="0" Labels="{Binding PrimaryAxisLabels}" Separator="{x:Null}"/>

Got a NullReferenceException.

Feature Request: Support multiple axes

Hello,

it would be great to add multiple y axes (primary axes) für the line series plot. So that you can say, line series 1 and 2 will use primary axis 1 and line serie 3 will have the separate primary axis 2.

Regards

PieCharts disappear

Worked nicely, but there is an issue.

PieChart.Series = new ObservableCollection
{
//if you add more than one serie to pie chart, they will be overridden
new PieSerie
{
PrimaryValues = new ObservableCollection { 8 }, // Only one component
Labels = standardLabels
}
};

=> Then the chart animates and disappears.

Ability to rotate axis labels

I'd like to see the ability to rotate the axis labels so that I can display them veritically or at some arbitrary angle.

Primary axis won't stop going below 0

I am trying to use a line or bar chart to graph a total number of tickets. In this case it doesn't make sense to plot anything below zero but I am unable to control it.

Piechart 0.4 does not hover

Hello dear Rodriguez
First, I want to thank you for this contribution it's very an easy way to create charts

Then, In this new release 0.4 the Piechart does not hover (show tooltip) i tried PieChart.Hoverable=true like the older release but it doesn't work.

Thank you

C#4.0 SUpport

Hello,

it would be great if the library will be supported in C# 4.0.

I changed lines like this one:
var labels = SecondaryAxis.Labels?.ToArray();

in that one:
var labels = SecondaryAxis.Labels != null ? SecondaryAxis.Labels.ToArray() : null;

and then it will compile and work unter C# 4.0

These are not much changes but a few.
Try to compile it with Visual C# 2010 Express for example and yu'll see it.

Regards

Still can't bind some properties

The XAML is a lot cleaner being able to bind most things as of v0.5.6, but I would like to be able to bind the axis label formatter. Can this be updated to a Dep Prop?

Serie.Plot throws null argument exception

When Series is null this exception is thrown, in my case series are not initialized with the the view because they require to request data to the sever, Series.Plot should ignore this if series == null or any of the series in collection is null, maybe its cause becasue labels property is null

Hover doesn't work right on mixed charts

When adding a line series to a bar chart as the first series in the collection, the mouse-over only works on the line chart. It doesn't respond to the mouse being over one of the bars.

With the mouse near the line series point on the bar the mouse is over:

croppercapture 2

With the mouse closer to a line series point for another bar, but still over the same bar:

croppercapture 3

Bar Chart - X-Axis creates unreadable labels

The line chart seems to handle labels for a lot of data better than the bar chart does. I would like if they were setup similar. I attached screenshots showing what I am talking about. These are using the same exact data.

image

image

Smarter Zoom

Zooming works well, but it always zooms according to 0,0 chart point, it would be more user friendly if we move on X and Y according to user position on chart.

Feature Request: Show Axes Titles

Hello,

one more request: It'll be glad to have axes titles at the line series plot.
Like "Time [s]" (horizontally below the secondary x axis) or "Cost [€]" (vertically next to each of the primary y axes).

Regards

Realtime changes on PieChart

Hi, I'm trying to use PieChart and I set
PrimaryValues="{Binding VM.Obj.Prop, UpdateSourceTrigger=PropertyChanged, Mode=OneWay}"

VM.Obj.Prop is a property:
public List Prop
{
get {return _prop;}
set {
_prop = value;
RaisePropertyChanged(() => Prop)
}
}

So in RaisePropertyChanged() I generate PropertyChanged event but chart doesn't change. only If I resize the window it will be redrawn.
Am I doing everything right or I miss smth?

WPFExample doesn't compile

A lot of errors on debugging attempt in "WPFExample" project with 0.5.6 library. Does it really works correctly?

Unable to add text before *Series databinding.

Instead of "Title Value" in the IndexedToolTip, there's no option to add binding text before the Value.

For example:

"High Temp 90 degrees" could be changed to "High Temp Dry 90 degrees", or "Low Temp 30 degrees" could be "Low Temp Frosty 30 degrees".

If there is some kind of overload I can use to add a descriptor before the value, that would be fantastic but I'm not quite sure how to implement it. I'd suffice with the tooltip, but the tooltip doesn't seem to display at all.

Secondary Values duplicating on barchart

So I have a bar chart the following:

Primary Values = Assigned, In Progress
Secondary Values = 876, 119

When I add this to the chart I see this...

image

But I have zoom enabled and when I zoom it changes to this...

image

it does the same thing when zoom is disabled but it will always look like the first screenshot.

Crash

In a piechart, if an observable collection contains only zeros, it crashes.

Candlestick chart

I'd like to add Candlestick chart with the next values on each point: date, time, open, high, low, close, volume. What steps should I do? Make copy of Series class and swith just doubles to candle class with mentioned properties? Then create CandleSeries class inherited from this Series copy and write a logic in Plot methods?

Animate new bar chart point

when adding new point to bar or stacked bar chart new bars do not animate. this is beacause by default it disables animation when charts grows, and this is fine for line chart and some others but not when using bars. It should be a protected variable that handles this behavior.

Feature Request: Support of value "Double.NaN"

Hello,

it would be great that the plot value "Double.NaN" will be supported and will create a "gap" in the Line Series Plot.
I changed your great library quickly and it works, but it not coded well.

Regards

nan_plot

Fixed scale of secondary axis won't work

Hello,

I hope this section here is the right one for such questions. I can't findy any other discussion possibility.

When I set the minimum and maximum of the secondary axis like the following, this axis won't be fixed:
LineChart.SecondaryAxis.MinValue = 0;
LineChart.SecondaryAxis.MaxValue = 1000;
A new added point will be drawn on the right even if I have only 100 points in the chart. I expected that the values will be shown between 0 and 100 of the secondary axis and not over the whole range from 0 to 1000.
What do I need to change to get this behaviour?

Animations from current state

Currently pie animations need to redraw all the chart everytime you make a change, it would be better to start from data is now, to the next state. From #47, This issue also refers to add it to many series as possible

LineSeries fill not used

I set the stroke and fill for a line series in a bar chart.

<lc:BarChart.Series>
    <lc:BarSeries PrimaryValues="{Binding MetricData}" Title="{Binding MetricName}"/>
    <lc:LineSeries PrimaryValues="{Binding GoalData}" Title="{Binding MetricName}"
                   Stroke="Green" Fill="Transparent"/>
</lc:BarChart.Series>

This is the chart I get:

croppercapture 2

Include common label formaters

this library could include a static list of formaters, for example currency, short date, long date, number, upper case, lower case.

Click event for data point

Would like to receive a Click event or equivalent when clicking on a data point. Should indicate which data point was clicked.

Recommend Projects

  • React photo React

    A declarative, efficient, and flexible JavaScript library for building user interfaces.

  • Vue.js photo Vue.js

    🖖 Vue.js is a progressive, incrementally-adoptable JavaScript framework for building UI on the web.

  • Typescript photo Typescript

    TypeScript is a superset of JavaScript that compiles to clean JavaScript output.

  • TensorFlow photo TensorFlow

    An Open Source Machine Learning Framework for Everyone

  • Django photo Django

    The Web framework for perfectionists with deadlines.

  • D3 photo D3

    Bring data to life with SVG, Canvas and HTML. 📊📈🎉

Recommend Topics

  • javascript

    JavaScript (JS) is a lightweight interpreted programming language with first-class functions.

  • web

    Some thing interesting about web. New door for the world.

  • server

    A server is a program made to process requests and deliver data to clients.

  • Machine learning

    Machine learning is a way of modeling and interpreting data that allows a piece of software to respond intelligently.

  • Game

    Some thing interesting about game, make everyone happy.

Recommend Org

  • Facebook photo Facebook

    We are working to build community through open source technology. NB: members must have two-factor auth.

  • Microsoft photo Microsoft

    Open source projects and samples from Microsoft.

  • Google photo Google

    Google ❤️ Open Source for everyone.

  • D3 photo D3

    Data-Driven Documents codes.