Code Monkey home page Code Monkey logo

squarify's Introduction

squarify

Build Status

Pure Python implementation of the squarify treemap layout algorithm.

Based on algorithm from Bruls, Huizing, van Wijk, "Squarified Treemaps", but implements it differently.

Contents

Installation

Compatible with Python 2 and Python 3.

pip install squarify

Usage

The main function is squarify and it requires two things:

  • A coordinate system comprising values for the origin (x and y) and the width/height (dx and dy).
  • A list of positive values sorted from largest to smallest and normalized to the total area, i.e., dx * dy).

The function returns a list of dicts (i.e., JSON objects), each one a rectangle with coordinates corresponding to the given coordinate system and area proportional to the corresponding value. Here's an example rectangle:

{
    "x": 0.0,
    "y": 0.0,
    "dx": 327.7,
    "dy": 433.0
}

The rectangles can be easily plotted using, for example, d3.js.

There is also a version of squarify called padded_squarify that returns rectangles that, when laid out, have a bit of padding to show their borders.

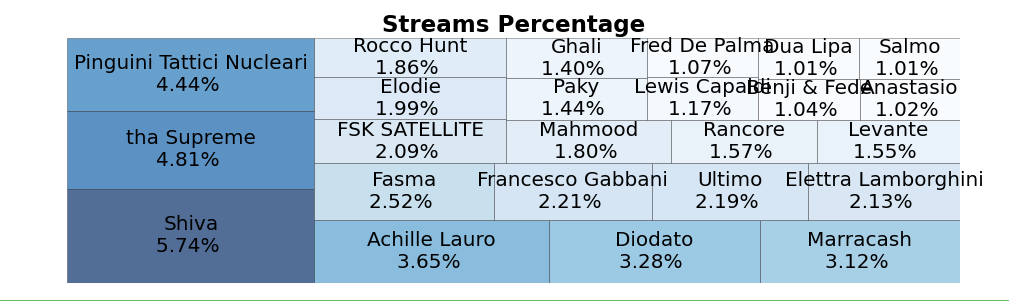
The helper function normalize_sizes will compute the normalized values, and the helper function plot will generate a Matplotlib-based treemap visualization of your data (see documentation).

Example

import squarify

# these values define the coordinate system for the returned rectangles
# the values will range from x to x + width and y to y + height
x = 0.
y = 0.
width = 700.
height = 433.

values = [500, 433, 78, 25, 25, 7]

# values must be sorted descending (and positive, obviously)
values.sort(reverse=True)

# the sum of the values must equal the total area to be laid out
# i.e., sum(values) == width * height
values = squarify.normalize_sizes(values, width, height)

# returns a list of rectangles
rects = squarify.squarify(values, x, y, width, height)

# padded rectangles will probably visualize better for certain cases
padded_rects = squarify.padded_squarify(values, x, y, width, height)

The variable rects contains

[
  {
    "dy": 433,
    "dx": 327.7153558052434,
    "x": 0,
    "y": 0
  },
  {
    "dy": 330.0862676056338,
    "dx": 372.2846441947566,
    "x": 327.7153558052434,
    "y": 0
  },
  {
    "dy": 102.9137323943662,
    "dx": 215.0977944236371,
    "x": 327.7153558052434,
    "y": 330.0862676056338
  },
  {
    "dy": 102.9137323943662,
    "dx": 68.94160077680677,
    "x": 542.8131502288805,
    "y": 330.0862676056338
  },
  {
    "dy": 80.40135343309854,
    "dx": 88.24524899431273,
    "x": 611.7547510056874,
    "y": 330.0862676056338
  },
  {
    "dy": 22.51237896126767,
    "dx": 88.2452489943124,
    "x": 611.7547510056874,
    "y": 410.4876210387323
  }
]

Documentation for Squarify

normalize_sizes(sizes, dx, dy) : Normalize list of values.

Normalizes a list of numeric values so that sum(sizes) == dx * dy.

Parameters

sizes : list-like of numeric values
    Input list of numeric values to normalize.
dx, dy : numeric
    The dimensions of the full rectangle to normalize total values to.

Returns
-------
list[numeric]
    The normalized values.

padded_squarify(sizes, x, y, dx, dy) : Compute padded treemap rectangles.

See squarify docstring for details. The only difference is that the returned rectangles have been "padded" to allow for a visible border.


plot(sizes, norm_x=100, norm_y=100, color=None, label=None, value=None, ax=None, pad=False, bar_kwargs=None, text_kwargs=None, **kwargs) : Plotting with Matplotlib.

Parameters

sizes
    input for squarify
norm_x, norm_y
    x and y values for normalization
color
    color string or list-like (see Matplotlib documentation for details)
label
    list-like used as label text
value
    list-like used as value text (in most cases identical with sizes argument)
ax
    Matplotlib Axes instance
pad
    draw rectangles with a small gap between them
bar_kwargs : dict
    keyword arguments passed to matplotlib.Axes.bar
text_kwargs : dict
    keyword arguments passed to matplotlib.Axes.text
**kwargs
    Any additional kwargs are merged into `bar_kwargs`. Explicitly provided
    kwargs here will take precedence.

Returns

matplotlib.axes.Axes
    Matplotlib Axes

squarify(sizes, x, y, dx, dy) : Compute treemap rectangles.

Given a set of values, computes a treemap layout in the specified geometry using an algorithm based on Bruls, Huizing, van Wijk, "Squarified Treemaps". See README for example usage.

Parameters

sizes : list-like of numeric values
    The set of values to compute a treemap for. `sizes` must be positive
    values sorted in descending order and they should be normalized to the
    total area (i.e., `dx * dy == sum(sizes)`)
x, y : numeric
    The coordinates of the "origin".
dx, dy : numeric
    The full width (`dx`) and height (`dy`) of the treemap.

Returns

list[dict]
    Each dict in the returned list represents a single rectangle in the
    treemap. The order corresponds to the input order.

squarify's People

Contributors

adrianmarkperea avatar angelaheumann avatar carlinmack avatar ecederstrand avatar emilecaron avatar laserson avatar rickardsjogren avatar sergarcia avatar sinhrks avatar

Stargazers

 avatar  avatar  avatar  avatar  avatar  avatar  avatar  avatar  avatar  avatar  avatar  avatar  avatar  avatar  avatar  avatar  avatar  avatar  avatar  avatar  avatar  avatar  avatar  avatar  avatar  avatar  avatar  avatar  avatar  avatar  avatar  avatar  avatar  avatar  avatar  avatar  avatar  avatar  avatar  avatar  avatar  avatar  avatar  avatar  avatar  avatar  avatar  avatar  avatar  avatar  avatar  avatar  avatar  avatar  avatar  avatar  avatar  avatar  avatar  avatar  avatar  avatar  avatar  avatar  avatar  avatar  avatar  avatar  avatar  avatar  avatar  avatar  avatar  avatar  avatar  avatar  avatar  avatar  avatar  avatar  avatar  avatar  avatar  avatar  avatar  avatar  avatar  avatar  avatar  avatar  avatar  avatar  avatar  avatar  avatar  avatar  avatar  avatar  avatar  avatar

Watchers

 avatar  avatar  avatar  avatar  avatar  avatar  avatar  avatar  avatar  avatar  avatar  avatar  avatar

squarify's Issues

Variable text options

Dear all,
Is there a way to adapt the "fontsize" parameter for labels as a function of boxes sizes?

Is subgrouping a feature of squarify?

Hi, I was working on a project where I wanted to use squarify to visualize my dataset. I was wondering if subgrouping is available.

For subgrouping I mean something like this:
image

I can see that we can achieve the first level grouping(GROCERY I, DELI, CLEANING, ...), but it seems that we can't further group items within each category.

Please let me know if I'm understanding this correctly, thanks

Squarify/?Matplotlib plot incorrectly

I am running the code below from the gist "https://gist.github.com/gVallverdu/0b446d0061a785c808dbe79262a37eea":

import matplotlib
matplotlib.use('Agg')
import matplotlib.pyplot as plt
import pandas as pd
import squarify

df = pd.read_csv("C:/PProjects/structure_population.csv", sep=";")
df = df.set_index("libgeo")
df = df[["superf", "p11_pop"]]
df2 = df.sort_values(by="superf", ascending=False)

x = 0.
y = 0.
width = 100.
height = 100.
cmap = matplotlib.cm.viridis

mini, maxi = df2.drop("PAU").p11_pop.min(), df2.drop("PAU").p11_pop.max()
norm = matplotlib.colors.Normalize(vmin=mini, vmax=maxi)
colors = [cmap(norm(value)) for value in df2.p11_pop]

labels = ["%s\n%d km2\n%d hab" % (label) for label in zip(df2.index, df2.superf, df2.p11_pop)]
labels[11] = "MAZERES-\nLEZONS\n%d km2\n%d hab" % (df2["superf"]["MAZERES-LEZONS"], df2["p11_pop"]["MAZERES-LEZONS"])

fig = plt.figure(figsize=(12, 10))
fig.suptitle("Population et superficie des communes de la CAPP", fontsize=20)
ax = fig.add_subplot(111, aspect="equal")
ax = squarify.plot(df2.superf, color=colors, label=labels, ax=ax, alpha=.7)
ax.set_xticks([])
ax.set_yticks([])
ax.set_title("L aire de chaque carre est proportionnelle a la superficie de la commune\n", fontsize=10)

img = plt.imshow([df2.p11_pop], cmap=cmap)
img.set_visible(False)
fig.colorbar(img, orientation="vertical", shrink=.96)

fig.text(.76, .9, "Population", fontsize=10)
fig.text(.5, 0.1,
"Superficie totale %d km2, Population de la CAPP : %d hab" % (df2.superf.sum(), df2.p11_pop.sum()),
fontsize=14,
ha="center")
fig.text(.5, 0.07,
"Source : http://opendata.agglo-pau.fr/",
2 fontsize=14,
ha="center")
plt.savefig('foo.png')
`

If I plot manually using rects coordinates , then it render correctly. Tried on both python 2.7/3/6 , Windows, PyCharm for GUI coding, backend for matplotlib is TkAgg, changing to Agg /creating image did not make difference.

My output plot is below
foo

Label font size adjust?

Treemap is a great package to use.

Is there any way to adjust the font size inside each treemap block?

And is there any way to handle label text outside of the block?

matplotlib `text()` throws error

Using the most recent version, here's a MWE:

import squarify as sq

data = [1, 2, 3]
labels = ["1", "2", "3"]
sq.plot(sizes=data, label=labels)

This throws the error

Traceback (most recent call last):
  File "/Users/nraf1041/Desktop/charting/test/test_competitive.py", line 6, in <module>
    competitive(dpis)
  File "/Users/nraf1041/Desktop/charting/charting/partisan/competitive.py", line 59, in competitive
    sq.plot(sizes=data, label=labels)
  File "/Users/nraf1041/.pyenv/versions/3.8.2/lib/python3.8/site-packages/squarify/__init__.py", line 268, in plot
    ax.text(x + dx / 2, y + dy / 2, l, va=va, ha="center", **text_kwargs)
TypeError: text() missing 1 required positional argument: 's'

Question: Touching bounds

Is it possible to get all boundaries to touch (without padding)? When I round to integers boxes borders are inconsistent.

does sorting of values always permit to predict boxes layout?

A small issue, just to clarify one sentence in the example provided:
I had already made some apparently successful test-plots of unsorted data, before realizing of this sentence in the example provided:

# values must be sorted descending (and positive, obviously)
values.sort(reverse=True)

As my unsorted plot looks OK, I guess that "must" was just a statement of the intended layout for that example (not mandatory for squarify to work properly).

As for my plot layout, I am guessing too that squarify will always create boxes in the provided order, from lower left corner upwards, and them from left to right. Correct? Or may squarify sometimes change that order to achieve the best fit of boxes?

It is interesting to know if our provided order permits to control layout of consecutively generated graphs, with slight differences in values, in order to later generate a nice-looking animated graphs.
This example (historic population comparisons between countries ) illustrates what I mean:

animated_treemap

Taken from https://wilkox.org/treemapify/#animated-treemaps

Maintained?

Hi, some people find your library very useful.

Do you plan to maintain it? i.e. make releases a bit more often?

I found some forks, for instance, the one from @ocket8888 seems to be adding fixes:
https://github.com/Sensibility/squarify

Perhaps it makes sense for you and them to work together in one repo? and help the community along this collaboration ;)

draw tiny boxes borders of a given colour instead of padding

Probably this is not a squarify issue but some matplotlib-related help requests.
As they might be interesting for other squarify-matplotlib new users like me, I dare to ask them here:

(1) When using plot, is it possible to draw boxes with a tiny one pixel border of a chosen contrasting colour (i.e., a black and white dashed or dotted line, so it will be always visible)?

When I run the example below (based in #26), boxes colors are random and I am OK with that ... but sometimes two neighbour colors are so similar I can't tell them apart.
(2) I know I can use padding, but then coloured boxes are not of their real sizes (that is specially relevant for the smallest sized boxes: see E box below, which represents 5 square units but looks like 1-sized in the padded graph). A tiny line showing the real box limits would improve visibility without producing this wrong box size impression.

	import matplotlib.pyplot as plt
	import squarify
	squarify.plot(
		label=["A", "B", "C", "D","E","F","G","H"], # list-like used as label text
		sizes=[25, 13, 22, 35, 5, 250, 650, 24], # sum = 1024
		norm_x=32, norm_y=32,  # product = 1024
		pad=False, # white gap from each rectangle border towards its center
		)
	plt.show()

In my plot, A-B-C-D-E are all drawn in a left column, whereas F-G-H occupy most of the remaining area.
If you run the script several times, there are chances that random colors are too close to each other, so square boundaries in that left column are almost invisible (see B-C-D or F-H boundaries below).

(3) Another question which you can also see in these examples.
I would expect a 32x32 square graphic, but I see rectangles. Looks like axes ratios are being modified somehow. How can I control this?

Thanks a lot for this great package !!
@abubelinha

squarify_example2
squarify_example_pad

TypeError: unsupported operand type(s) for +: 'int' and 'str'

Hello,
With squarify, I try to do an treemap but I have an :

---------------------------------------------------------------------------
TypeError                                 Traceback (most recent call last)
<ipython-input-142-f809b7b5caff> in <module>
     40 
     41 # Plot
---> 42 squarify.plot(sizes='data' , label='labels' , alpha=.7)
     43 plt.axis('off')
     44 plt.show()

/opt/jupyterhub/lib/python3.7/site-packages/squarify/__init__.py in plot(sizes, norm_x, norm_y, color, label, value, ax, pad, bar_kwargs, text_kwargs, **kwargs)
    239         bar_kwargs.update(kwargs)
    240 
--> 241     normed = normalize_sizes(sizes, norm_x, norm_y)
    242 
    243     if pad:

/opt/jupyterhub/lib/python3.7/site-packages/squarify/__init__.py in normalize_sizes(sizes, dx, dy)
    168         The normalized values.
    169     """
--> 170     total_size = sum(sizes)
    171     total_area = dx * dy
    172     sizes = map(float, sizes)

TypeError: unsupported operand type(s) for +: 'int' and 'str'

My code is :

from SPARQLWrapper import SPARQLWrapper, JSON
import pandas as pd
import matplotlib.pyplot as plt
import numpy as np
import re

sparql = SPARQLWrapper("http://isidore.science/sparql")
sparql.setQuery("""
PREFIX sioc: <http://rdfs.org/sioc/ns#>
PREFIX dcterms: <http://purl.org/dc/terms/>
PREFIX foaf: <http://xmlns.com/foaf/0.1/>
PREFIX ore: <http://www.openarchives.org/ore/terms/>
PREFIX skos: <http://www.w3.org/2004/02/skos/core#>
SELECT ?label (count(?documents) as ?count) WHERE {
    <http://isidore.science/collection/10670/2.qfy8eq> ore:aggregates ?documents.
    ?documents sioc:topic ?topic.
    ?topic skos:prefLabel ?label.
    FILTER(lang(?label)="fr")
}
GROUP BY ?label
ORDER BY DESC(?count) LIMIT 10

""")
sparql.setReturnFormat(JSON)
results = sparql.query().convert()
results_df = pd.json_normalize(results['results']['bindings'])
labels = results_df['label.value']
data = results_df['count.value']

# Dataframe
df = pd.DataFrame({'data':data, 'labels':labels})
print(df)

# Tree
squarify.plot(sizes='data' , label='labels' , alpha=.7)
plt.axis('off')
plt.show()

What's wrong with this data in a DataFrame ?
Best,
Stéphane.

Release 0.4 breaks passing matplotlib.plot() kwargs

Release 0.4.0 breaks passing matplotlib.plot() kwargs in the squarify.plot() method.
This worked in v0.3.0.
This feature is mainly useful for plotting squarify output on matplotlib figures.
For instance, in the code example below I use a figure with fixed size to plot a treemap on.

import squarify

def plot_type_treemap_matplot(type_df, fp="type_treemap_matplot.png"):

    type_df["label"] = type_df.apply(lambda x: f"{x.name}\n{x['pct']}% (n={x['n'].astype('int')})", axis=1)

    figsize = [9, 5]
    plt.rcParams["figure.figsize"] = figsize
    cmap = plt.get_cmap("tab20", lut=len(type_df.index))
    # Change color
    fig = plt.figure(figsize=figsize, dpi=300)

    squarify.plot(sizes=type_df["n"], label=type_df["label"],
                  color=cmap.colors, alpha=.4, figure=fig)  # This does not work in v0.4
    plt.title("Distribution of event categories in SENTiVENT English corpus.", fontsize=12, figure=fig)
    plt.axis('off', figure=fig)
    plt.show()
    fig.savefig(fp)

In v0.4.0 this introduced AttributeErrors for the "figure" and "alpha" kwargs, while it produces the expected output in v0.3.0.

Resize/wrap text label

I'm building a simple treemap using the library. Is there a way to automatically resize/wrap the label of the single square?
I'm using the following line of code:
squarify.plot(label=labels,sizes=dataGoals.Streams, color = colors, alpha=.7, bar_kwargs=dict(linewidth=0.5, edgecolor="#222222"),text_kwargs={'fontsize':20})
The fontsize unfortunately is fixed, and my labels will overlap between the smaller squares:
plot

Is there a way to resize the labels?

change the fontsize

is it possible to change the font size of label in every box based on its value?

Can not install using conda

Thank for great library. I was able to install the library using pip, but pip is the default environment, I would like to install it to some environment eg. "myenv" in conda using:
conda install -n myenv -c conda-forge squarify

But, this commands fails.
How to install this package for conda environment?

pad can be changed to a value?

I used the pad =True. But the gap is biger. So, I want to know this parameter kan be changed to a float or int value?

AttributeError: module 'squarify' has no attribute 'plot'

Any idea why I receive the error AttributeError: module 'squarify' has no attribute 'plot'?

import matplotlib.pyplot as plt
import squarify

squarify.plot(
    sizes=[13,22,35,5],
    label=["group A", "group B", "group C", "group D"],
    )
 
plt.axis('off')
plt.show()

Recommend Projects

  • React photo React

    A declarative, efficient, and flexible JavaScript library for building user interfaces.

  • Vue.js photo Vue.js

    🖖 Vue.js is a progressive, incrementally-adoptable JavaScript framework for building UI on the web.

  • Typescript photo Typescript

    TypeScript is a superset of JavaScript that compiles to clean JavaScript output.

  • TensorFlow photo TensorFlow

    An Open Source Machine Learning Framework for Everyone

  • Django photo Django

    The Web framework for perfectionists with deadlines.

  • D3 photo D3

    Bring data to life with SVG, Canvas and HTML. 📊📈🎉

Recommend Topics

  • javascript

    JavaScript (JS) is a lightweight interpreted programming language with first-class functions.

  • web

    Some thing interesting about web. New door for the world.

  • server

    A server is a program made to process requests and deliver data to clients.

  • Machine learning

    Machine learning is a way of modeling and interpreting data that allows a piece of software to respond intelligently.

  • Game

    Some thing interesting about game, make everyone happy.

Recommend Org

  • Facebook photo Facebook

    We are working to build community through open source technology. NB: members must have two-factor auth.

  • Microsoft photo Microsoft

    Open source projects and samples from Microsoft.

  • Google photo Google

    Google ❤️ Open Source for everyone.

  • D3 photo D3

    Data-Driven Documents codes.