Code Monkey home page Code Monkey logo

socviz's Introduction

socviz

R build status

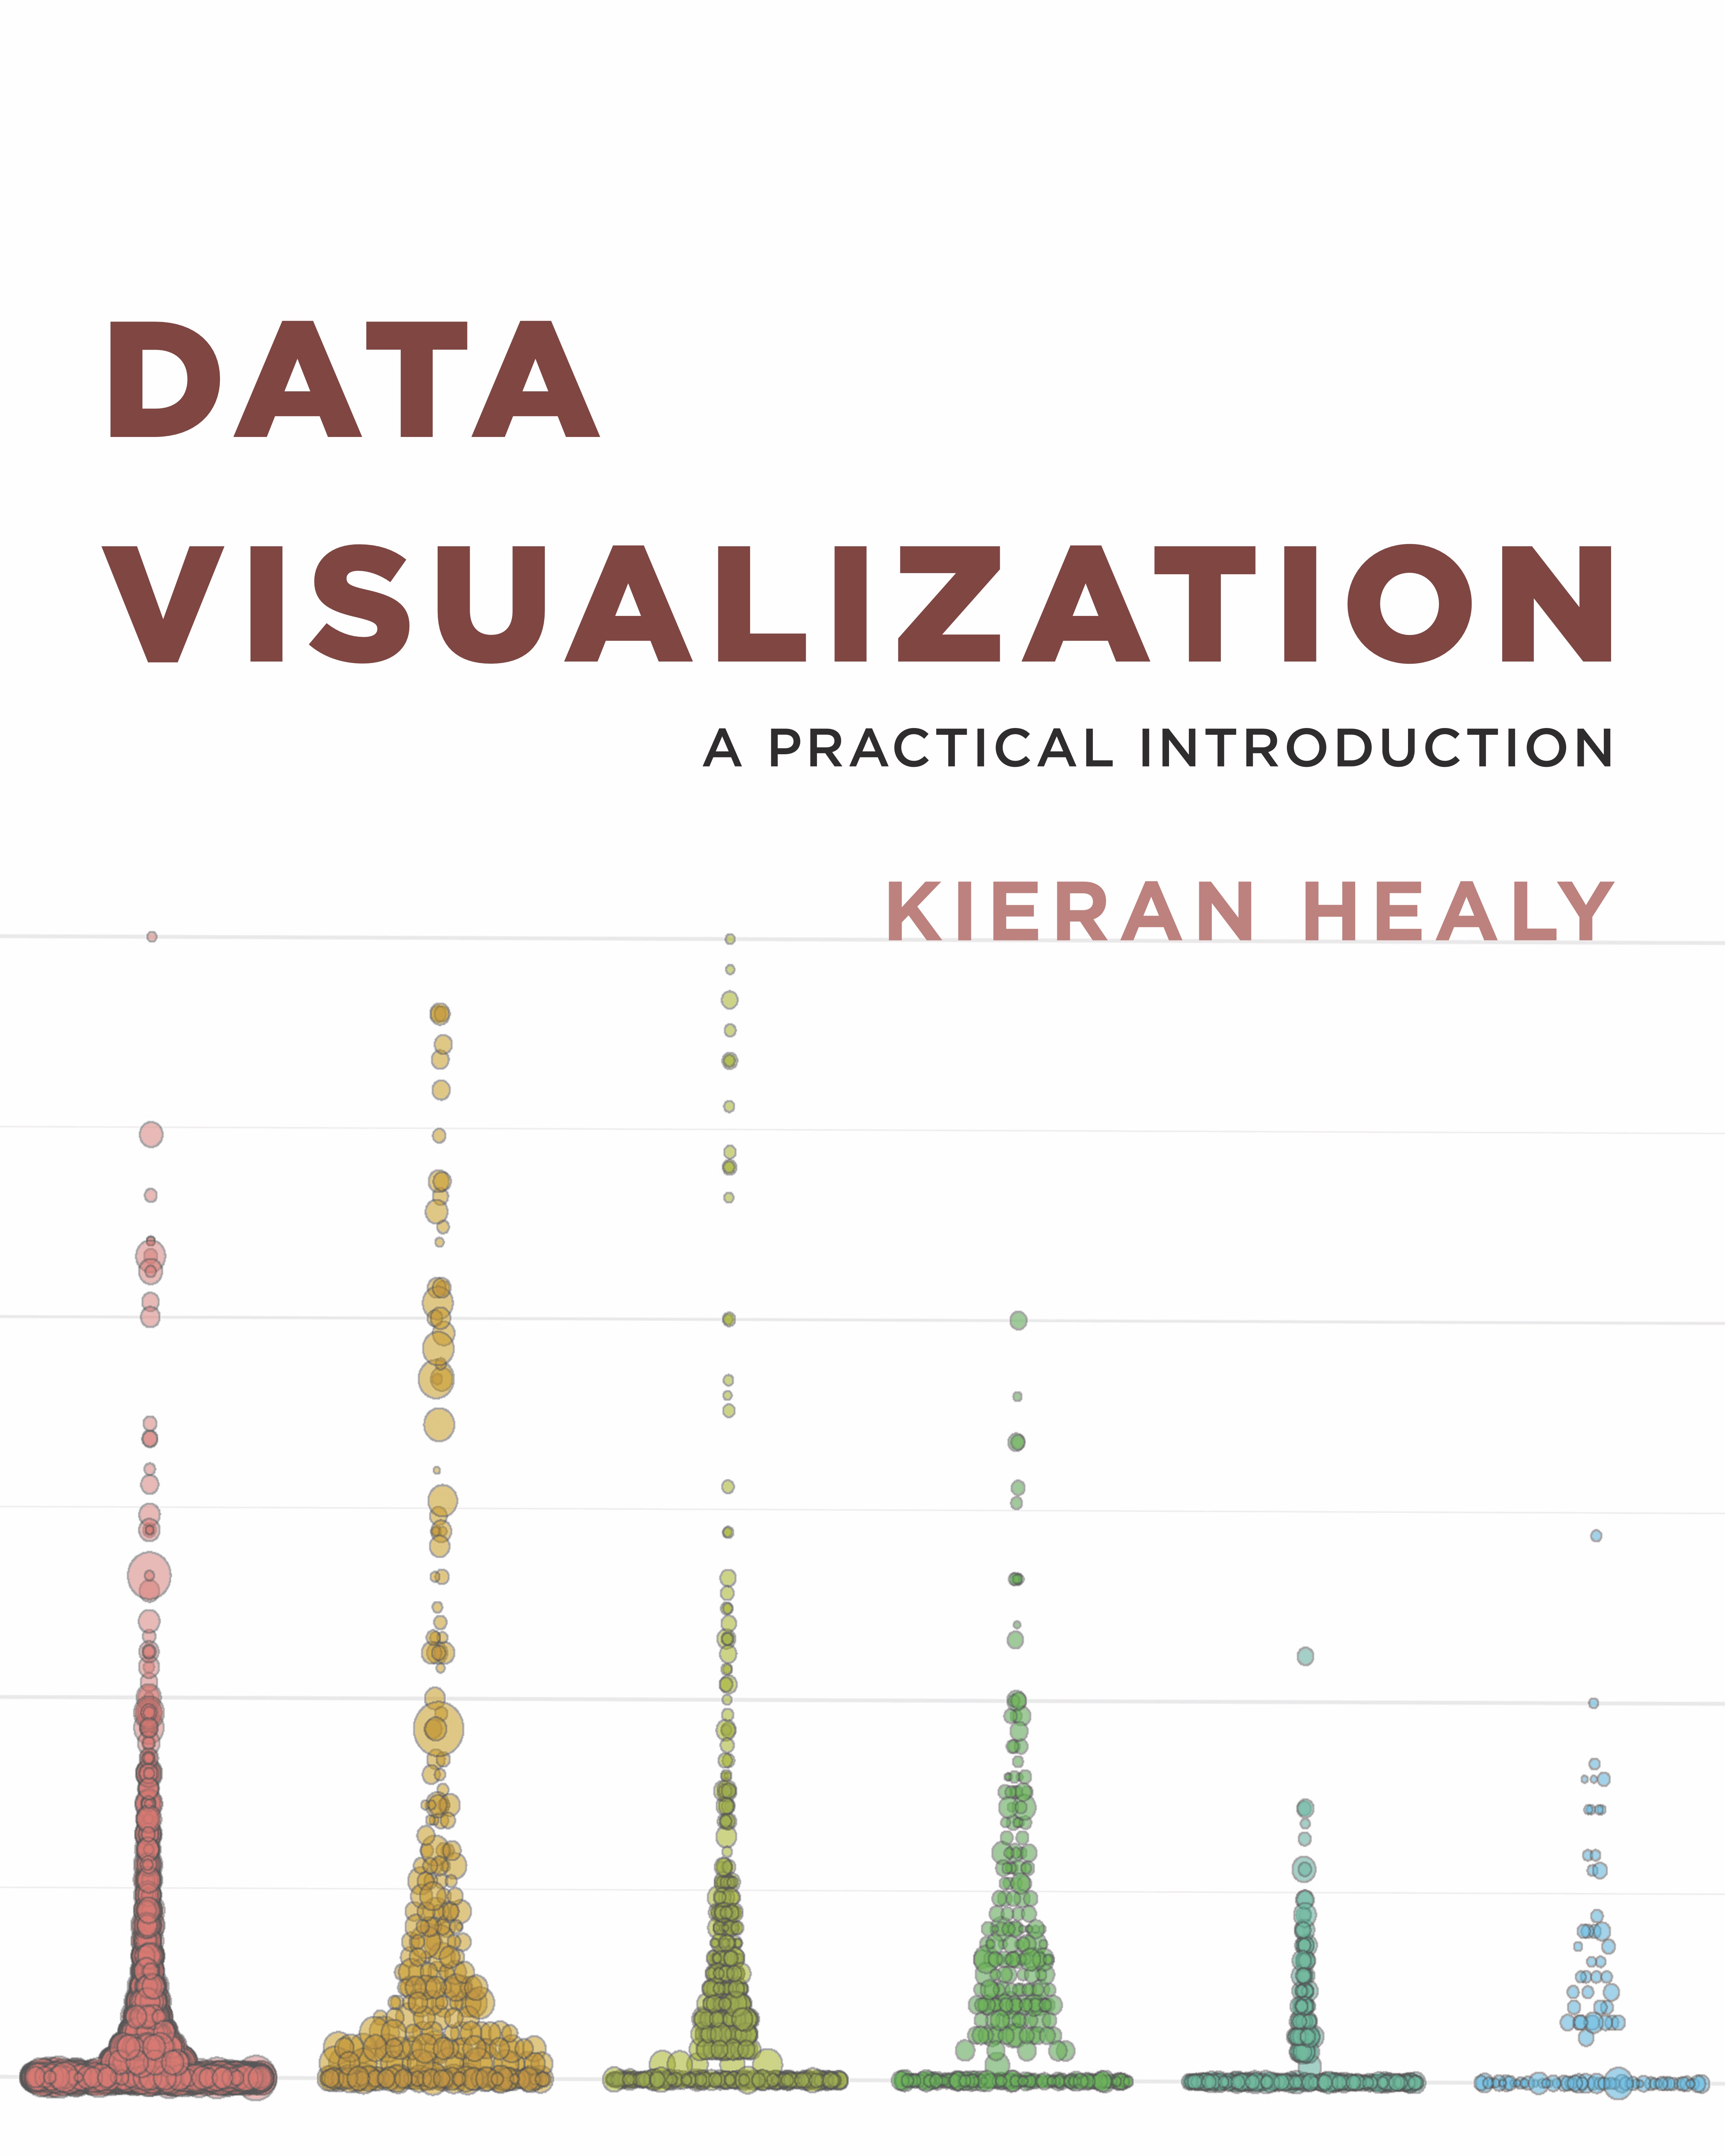
This is an R package of datasets, functions, and course materials to go along with the book Data Visualization: A Practical Introduction (Princeton University Press, 2019).

What's in this Package

The socviz package contains about twenty five datasets and a number of utility and convenience functions. Most of them are used in Data Visualization: A Practical Introduction (http://socviz.co), and there are also a few others as well for self-learners and students to practice their skills on.

A course packet is also included. This is a zipped file containing an R Studio project consisting of a nine R Markdown documents that parallel the chapters in the book. They contain the code for almost all the figures in the book (and a few more besides). Some support files are also included, to help demonstrate things like reading in your own data locally in R.

Installation

To install the package, you can follow the instructions in the Preface to the book. Alternatively, first download and install R for MacOS, Windows or Linux, as appropriate. Then download and install RStudio. Launch RStudio and then type the following code at the Console prompt (> ), hitting return at the end of each line:

my_packages <- c("tidyverse", "fs", "devtools")
install.packages(my_packages)

install.packages("socviz")

To install the development version of socviz, instead of install.packages("socviz") do the following:

devtools::install_github("kjhealy/socviz")

Once everything has downloaded and been installed (which may take a little while), load the socviz package:

library(socviz)

The Course Packet

The supporting materials are contained in a compressed .zip file. To extract them to your Desktop, make sure the socviz package is loaded as described above. Then do something like this:

setup_course_notes(folder = "~/Desktop")

You can choose the destination folder, but you must supply one. Here, the dataviz_course_notes.zip file will be copied to your Desktop, and uncompressed there into a folder called dataviz_course_notes. Open the folder, and double-click the file named dataviz.Rproj to launch the project as a new RStudio session. If you want to uncompress the file somewhere other than your Desktop, e.g. your Documents folder, you can do this:

setup_course_notes(folder = "~/Documents")

More about the Datasets and Functions

The included datasets and functions are documented at http://kjhealy.github.io/socviz/reference/.

socviz's People

Contributors

kjhealy avatar

Stargazers

 avatar  avatar  avatar  avatar  avatar  avatar  avatar  avatar  avatar  avatar  avatar  avatar  avatar  avatar  avatar  avatar  avatar  avatar  avatar  avatar  avatar  avatar  avatar  avatar  avatar  avatar  avatar  avatar  avatar  avatar  avatar  avatar  avatar  avatar  avatar  avatar  avatar  avatar  avatar  avatar  avatar  avatar  avatar  avatar  avatar  avatar  avatar  avatar  avatar  avatar  avatar  avatar  avatar  avatar  avatar  avatar  avatar  avatar  avatar  avatar  avatar  avatar  avatar  avatar  avatar  avatar  avatar  avatar  avatar  avatar  avatar  avatar  avatar  avatar  avatar  avatar  avatar  avatar  avatar  avatar  avatar  avatar  avatar  avatar  avatar  avatar  avatar  avatar  avatar  avatar  avatar  avatar  avatar  avatar  avatar  avatar  avatar  avatar  avatar  avatar

Watchers

 avatar  avatar  avatar  avatar  avatar  avatar  avatar  avatar  avatar  avatar  avatar  avatar  avatar  avatar  avatar

socviz's Issues

Path for election16-county.csv

Thanks for the very interesting text! Working through to section 8.2., I saw:

election_data <- read_csv("data/election16-county.csv")

This data set doesn't seem to exist within the package. I found it at:

https://raw.githubusercontent.com/kjhealy/viz-election/master/election16-county.csv

6.6 Grouped Analysis and List Columns - Problem with "sample_n()

After creating the grouped_df "out_tidy" running "out_tidy %>% sample_n(5)" does not seem to work.

I get the following error message:

"Error in sample_n():
! Problem while computing indices.
ℹ The error occurred in group 1: continent = Africa, year = 1952.
Caused by error:
! size must be less than or equal to 1 (size of data).
ℹ set replace = TRUE to use sampling with replacement.
Run rlang::last_error() to see where the error occurred."

Compatibility problems...

I have trying to install the "socviz" package and, depending on the type of package, I have different errors:

1.- If I try to install the package directly "install.packages("socviz")", R says
Warning in install.packages :
package ‘socviz’ is not available (for R version 3.5.0)

2.- If I try to install the developer version "devtools::install_github("kjhealy/socviz")", R says
Error: object ‘glue_collapse’ is not exported by 'namespace:glue'

I have bought your book and try to follow it. However, I'm stuck just at the beginning because I can not install the packages that you recommend at the preface section of your book.

Could you help me?

gss_sm update?

It looks like the version of gss_sm in the package is different from the one you used in the book. In the version in the package, I find 158 protestants in the Northeast. In the book, you report 123. Would it be possible to update the package with the version you used in the book?

I am using the github version of the package, which I downloaded today, Jan. 29, 2021.

Thanks

socviz not installing

I ran the following code in R as mentioned in the introduction of the book:
devtools::install_github("kjhealy/socviz")

I got this error:
Error: Failed to install 'unknown package' from GitHub: Unsupported proxy 'https://gate-zrh.swissre.com:9443', libcurl is built without the HTTPS-proxy support.

Any help on this please?

“Data Visualization Notes” not showing in the "New File" templates

Hi, following the instructions given at section 2.2.2 of the book, when clicking "From template" at the sidebar, the "Data Visualization Notes" does not appear in the list.

I'm using Version 1.1.463 of RStudio with R version 3.4.4 on Ubuntu MATE 18.04.

Library (socviz) is loaded before the procedure.

I can find the template file in the socviz project folder under templates.

dataset election: Swapped electoral votes?

It seems that the amount of electoral votes of democrats and republicans are swapped:

Documentation says:

ev_dem. Electoral votes for Clinton
ev_rep. Electoral votes for Trump

Data says:

election %>% summarize_if(str_detect(names(.), "ev"), sum)
# A tibble: 1 x 3
  ev_dem ev_rep ev_oth
   <dbl>  <dbl>  <dbl>
1    304    227      7

Recommend Projects

  • React photo React

    A declarative, efficient, and flexible JavaScript library for building user interfaces.

  • Vue.js photo Vue.js

    🖖 Vue.js is a progressive, incrementally-adoptable JavaScript framework for building UI on the web.

  • Typescript photo Typescript

    TypeScript is a superset of JavaScript that compiles to clean JavaScript output.

  • TensorFlow photo TensorFlow

    An Open Source Machine Learning Framework for Everyone

  • Django photo Django

    The Web framework for perfectionists with deadlines.

  • D3 photo D3

    Bring data to life with SVG, Canvas and HTML. 📊📈🎉

Recommend Topics

  • javascript

    JavaScript (JS) is a lightweight interpreted programming language with first-class functions.

  • web

    Some thing interesting about web. New door for the world.

  • server

    A server is a program made to process requests and deliver data to clients.

  • Machine learning

    Machine learning is a way of modeling and interpreting data that allows a piece of software to respond intelligently.

  • Game

    Some thing interesting about game, make everyone happy.

Recommend Org

  • Facebook photo Facebook

    We are working to build community through open source technology. NB: members must have two-factor auth.

  • Microsoft photo Microsoft

    Open source projects and samples from Microsoft.

  • Google photo Google

    Google ❤️ Open Source for everyone.

  • D3 photo D3

    Data-Driven Documents codes.