Code Monkey home page Code Monkey logo

echarts4r's Introduction

Note

The Github version is currently going through the update from ECharts.js version 4 to version 5: feel free to test it but there are some issues. Please use the stable CRAN version otherwise.

Example

Basic example.

library(echarts4r)

e_chart(cars, speed) %>% 
  e_scatter(dist, symbolSize = 10)

Get it

Stable version from CRAN.

install.packages("echarts4r")

The development version from Github.

# install.packages("remotes")
remotes::install_github("JohnCoene/echarts4r")

Code of Conduct

Please note that the echarts4r project is released with a Contributor Code of Conduct. By contributing to this project, you agree to abide by its terms.

echarts4r's People

Contributors

artemklevtsov avatar eaurele avatar etiennebacher avatar hansz00 avatar helgasoft avatar jhk0530 avatar johncoene avatar jonmcalder avatar jpcoene avatar kalganem avatar mathidachuk avatar mkranj avatar mthomas-ketchbrook avatar munoztd0 avatar orchid00 avatar psimm avatar rcura avatar rdatasculptor avatar robert-koetsier avatar shrektan avatar stephlh avatar swsoyee avatar teofiln avatar yihui avatar yogat3ch avatar

Stargazers

 avatar  avatar  avatar  avatar  avatar  avatar  avatar  avatar  avatar  avatar  avatar  avatar  avatar  avatar  avatar  avatar  avatar  avatar  avatar  avatar  avatar  avatar  avatar  avatar  avatar  avatar  avatar  avatar  avatar  avatar  avatar  avatar  avatar  avatar  avatar  avatar  avatar  avatar  avatar  avatar  avatar  avatar  avatar  avatar  avatar  avatar  avatar  avatar  avatar  avatar  avatar  avatar  avatar  avatar  avatar  avatar  avatar  avatar  avatar  avatar  avatar  avatar  avatar  avatar  avatar  avatar  avatar  avatar  avatar  avatar  avatar  avatar  avatar  avatar  avatar  avatar  avatar  avatar  avatar  avatar  avatar  avatar  avatar  avatar  avatar  avatar  avatar  avatar  avatar  avatar  avatar  avatar  avatar  avatar  avatar  avatar  avatar  avatar  avatar  avatar

Watchers

 avatar  avatar  avatar  avatar  avatar  avatar  avatar  avatar  avatar  avatar  avatar  avatar  avatar  avatar  avatar  avatar  avatar  avatar

echarts4r's Issues

How to Customise 3D Axis?(For example, changing the interval)

I know the function e_axis_3d.
However, there is no examples.

v <- LETTERS[1:10]
matrix <- data.frame(
  x = sample(v, 300, replace = TRUE), 
  y = sample(v, 300, replace = TRUE), 
  z = rnorm(300, 10, 1),
  color = rnorm(300, 10, 1),
  size = rnorm(300, 10, 1),
  stringsAsFactors = FALSE
) %>% 
  dplyr::group_by(x, y) %>% 
  dplyr::summarise(
    z = sum(z),
    color = sum(color),
    size = sum(size)
  ) %>% 
  dplyr::ungroup() 
  
matrix %>% 
  e_charts(x) %>% 
  e_scatter_3d(y, z, size, color) %>% 
  e_visual_map(
    size,
    inRange = list(symbolSize = c(1, 30)), # scale size
    dimension = 3 # third dimension 0 = x, y = 1, z = 2, size = 3
  ) %>% 
  e_visual_map(
    color,
    inRange = list(color = c('#bf444c', '#d88273', '#f6efa6')), # scale colors
    dimension = 4, # third dimension 0 = x, y = 1, z = 2, size = 3, color = 4
    bottom = 300 # padding to avoid visual maps overlap
  )

Just consider this situation, HOW to customise Y-asix so that I can see labels : "A, B, C , D , E,..." rather than only "A, C, E ..."

Thanks!

Calendar heatmaps on ShinyProxy

I can’t say confidently that this is a bug. I would rather want to ask for advice. After containerizing and deployment Shiny app on ShinyProxy calendar heatmaps don't work correctly. I need to say that locally all charts work fine and the problem appears only in production and only a few weeks ago because before charts have worked correctly for several months.

So, charts stopped to show change of the color inside of calendar. Nevertheless chart receives the data and shows the maximum and the minimum on the scale. Example.

In some cases the chart even looks like this. Example

What could it be connected with? I’m using versionecharts4r_0.1.2.9000

new theme

Hey @JohnCoene

You've write an awesome package!
I was trying to create my own theme (based on 538 page), but I have no idea how to start.

I can generate my own theme by editing one json that already exists but I don't know how to add this json file in R.

I'm trying with this:

USArrests %>% 
  dplyr::mutate(
    State = row.names(.),
    Rape = -Rape
  ) %>% 
  e_charts(State) %>% 
  e_line(Murder) %>% 
  e_area(Rape, name = "Sick basterd", x.index = 1) %>%  # second y axis
  e_title("Your plot", "Subtext", sublink = "https://john-coene.com") %>% 
  e_x_axis(1, show = FALSE) # hide scond X Axis

but I'm stuck in add my own theme (or edit).
any help will be appreciated!

Only one category on axis

The library demonstrates extremely strange behavior when x or y axis has only one category. I prepared for you several examples to demonstrate it. Besides, please pay attention that I define x axis and y axis properties like plot$x$opts$yAxis$axisLabel$fontSize <- 10. This is necessary measure because functions e_x_axis() and e_y_axis() are not sensitive to this properties.

library(data.table)
library(echarts4r)

dt_1 <- data.table( 
  user = rep("a", times = 3),
  variable = c('anonymous', 'identified', 'unique'),
  value =  c(110, 550, 15)   
)

dt_2 <- data.table( 
  user = rep("all", times = 3),
  variable = c('anonymous', 'identified', 'unique'),
  value =  c(110, 550, 15) 
)

dt_3 <- data.table( 
  user = rep(c("all", "not all"), each = 3),
  variable = rep(c('anonymous', 'identified', 'unique'), times = 2),
  value =  c(110, 550, 15, 140, 88, 17)  
)

{
plot <- dt_1 %>% 
  e_charts(variable) %>% 
  e_heatmap(user, value, label = list(normal = list(show = TRUE))) %>% 
  e_grid(left = '13%', right = '3%', bottom = '10%', top = '15%') %>%
  e_visual_map(value, 
               orient = 'horizontal', calculable = TRUE, left = 'center',
               type = 'continuous', splitNumber = 10)  

plot$x$opts$xAxis$position <- 'top'
plot$x$opts$yAxis$axisLabel$fontSize <- 10
plot

}

{
  plot <- dt_2 %>% 
    e_charts(variable) %>% 
    e_heatmap(user, value, label = list(normal = list(show = TRUE))) %>% 
    e_grid(left = '13%', right = '3%', bottom = '10%', top = '15%') %>%
    e_visual_map(value, 
                 orient = 'horizontal', calculable = TRUE, left = 'center',
                 type = 'continuous', splitNumber = 10)
  
  plot$x$opts$xAxis$position <- 'top'
  plot$x$opts$yAxis$axisLabel$fontSize <- 10
  plot  
}

{
  plot <- dt_3 %>% 
    e_charts(variable) %>% 
    e_heatmap(user, value, label = list(normal = list(show = TRUE))) %>% 
    e_grid(left = '13%', right = '3%', bottom = '10%', top = '15%') %>%
    e_visual_map(value, 
                 orient = 'horizontal', calculable = TRUE, left = 'center',
                 type = 'continuous', splitNumber = 10) 
  
  plot$x$opts$xAxis$position <- 'top'
  plot$x$opts$yAxis$axisLabel$fontSize <- 10
  plot 
}


{
  plot <- dt_2[variable == "anonymous", ] %>% 
    group_by(user) %>%
    e_charts(user) %>% 
    e_bar(value) %>% 
    e_grid(left = '13%', right = '3%', bottom = '10%', top = '15%')
  
  plot  
}

{
  plot <- dt_3[variable == "anonymous", ] %>% 
    group_by(user) %>%
    e_charts(user) %>% 
    e_bar(value) %>% 
    e_grid(left = '13%', right = '3%', bottom = '10%', top = '15%')
  
  plot  
}

Enhance Sunburst chart via allowing specifying itemStyle by each slice

Maybe like below? Didn't get a chance to modify the wrappers.

.build_sun <- function(e, parent, child, value, itemStyle){
  e$x$data %>%
    dplyr::select_(
      parent,
      name = child,
      value = value,
      itemStyle = itemStyle
    ) -> data
  
  d3r::d3_nest(data, value_cols = c("value","itemStyle"), json = FALSE, root = NULL) -> x
  x <- x[["children"]][[1]]
  x$colname <- NULL
  jsonlite::toJSON(x, auto_unbox = T, pretty = FALSE)
}

the picture exceeds the x axis

mtcars %>% group_by(am)%>% e_charts() %>% e_histogram(mpg) %>% e_tooltip(trigger = "axis")

Just run the code, you will see the bug.

Suggests instead of Depends: R (>= 3.4.2)?

Hi,

I'm running on an earlier subversion of 3.4, and I'm pretty sure there will be a couple like my case. Could you change the depends to suggests so that we won't have to upgrade R to try out the package?
Thanks.

Incorrect series name on map

Hi,

Tooltip shows "seies0" when I define the name param in e_map.

library(echarts4r)

sessions <- read.csv(
    paste0("https://raw.githubusercontent.com/JohnCoene/projects/",
           "master/htmlwidgets/echarts/data/sessions.csv")
)
sessions %>% 
    e_country_names(Country, Country, type = "country.name") %>% # helper
    e_charts(Country) %>% 
    e_map(Sessions) %>% 
    e_visual_map(Sessions) %>% 
    e_tooltip()

default

sessions %>% 
    e_country_names(Country, Country, type = "country.name") %>% # helper
    e_charts(Country) %>% 
    e_map(Sessions, name = "Sesions") %>% 
    e_visual_map(Sessions) %>% 
    e_tooltip()

default

Adding measures of uncertainty to charts?

This is a question, but perhaps also an enhancement. There is a demo of building a confidence band on the echarts main site, shown below with a subtitle built in metricsgraphics.js.

image

Is there a means of building this type of plot? Alternatively, a line segement could be used to build a dumbell plot where a point is paired with a vertical line(s) to show uncertainty about an estimate. After reading all of the documentation (great work) I don't see too many options for representing uncertainty. Any thoughts would be appreciated.

If this functionality does not yet exist I would strongly support this type of addition to an already amazing package. Thanks.

custom features "onclick" doesn't work

Hi,

First of all. Thank you for this great package.

I tried to create a custom feature as described at:

https://ecomfe.github.io/echarts-doc/public/en/option.html#toolbox.feature

After creating an echart object "ech" I added the feature:

    myTool1=list(
        show=T
        ,title='custom extension method 1'
        ,icon= 'image://http://echarts.baidu.com/images/favicon.png'
        ,onclick="myfunc()"
    )
    ech$x$opts$toolbox$feature$myTool1=myTool1

After doing so I can see a new icon at the top right corner of the plot, but when I click the button it doesn't work. In the browser's console you can see the error:

VM22989:22 Uncaught TypeError: t.apply is not a function
    at kn.eval (eval at <anonymous> (jquery.min.js:formatted:143), <anonymous>:22:2321)
    at kn.trigger (eval at <anonymous> (jquery.min.js:formatted:143), <anonymous>:22:235920)
    at cw.dispatchToElement (eval at <anonymous> (jquery.min.js:formatted:143), <anonymous>:22:238322)
    at cw.(:8787/p/5397/anonymous function) [as click] (eval at <anonymous> (http://35.195.31.49:8787/p/5397/shared/jquery.min.js:2:2651), <anonymous>:22:239159)
    at Mi.trigger (eval at <anonymous> (jquery.min.js:formatted:143), <anonymous>:22:235920)
    at Mi.Ab.(:8787/p/5397/anonymous function) (eval at <anonymous> (http://35.195.31.49:8787/p/5397/shared/jquery.min.js:2:2651), <anonymous>:22:279275)
    at HTMLDivElement.eval (eval at <anonymous> (jquery.min.js:formatted:143), <anonymous>:22:32377)

note: I get the same error in shiny (chrome and firefox) and in Rstudio native browser

Thank You

Using template variables with formatter in e_tooltip?

Hi, great package, thanks! I was wondering if there's a way to use the echarts template variables in e_tooltip as described here at https://ecomfe.github.io/echarts-doc/public/en/option.html#tooltip.formatter

When I use e_tooltip(formatter = "{c}") in a scatter plot, I get both the x and y values returned in a single comma-separated result like "x,y", such as "100,215". I was wondering if you know whether it's possible to call an individual value such as described in the echarts documentation, using {c0} for the first data value or {c1} for the second? As far as I can see, both {c} and {c0} return the comma-separated x and y values together and {c1} isn't functioning as a template variable. Thanks!

Streamline graphs

Hi John,

Amazing work!

Below is the Van der Pol oscillator:

library(echarts4r)
vectors <- expand.grid(x = -3:3, y = -3:3)
mu <- 1
vectors$sx <- vectors$y
vectors$sy <- mu * (1 - vectors$x^2) * vectors$y - vectors$x
vectors$color <- log10(runif(nrow(vectors), 1, 10))

vectors %>% 
  e_charts(x) %>% 
  e_flow_gl(y, sx, sy, color) %>% 
  e_visual_map(
    min = 0, max = 1, # log 10
    dimension = 4, # x = 0, y = 1, sx = 3, sy = 4
    show = FALSE, # hide
    inRange = list(
      color = c('#313695', '#4575b4', '#74add1', '#abd9e9', '#e0f3f8',
                '#ffffbf', '#fee090', '#fdae61', '#f46d43', '#d73027', '#a50026')
    )
  ) %>% 
  e_x_axis(
    splitLine = list(show = FALSE)
  ) %>% 
  e_y_axis(
    splitLine = list(show = FALSE)
  )   

Besides, please have a look at:

devtools::install_github("mjg211/phaseR")
library(phaseR)
simplePendulum.flowField  <- flowField(simplePendulum, xlim = c(-7, 7),
                                       ylim = c(-7, 7), parameters = 5, points = 19,
									   add = FALSE)
y0                        <- matrix(c(0, 1, 0, 4, -6, 1, 5, 0.5, 0, -3), ncol = 2,
                                    nrow = 5, byrow = TRUE)
simplePendulum.nullclines <- nullclines(simplePendulum, xlim = c(-7, 7),
                                        ylim = c(-7, 7), parameters = 5, points = 500)
simplePendulum.trajectory <- trajectory(simplePendulum, y0 = y0, tlim = c(0, 10),
                                        parameters = 5)

or a shiny app running here

Do you think it's possible to add an arrow function as well as contours like in base R so that I can do classic vector field plots?

Thanks ;)
David

Toolbox tooltip in Chinese

Hi John,

It appears that all tooltip features are in Chinese. Is there a way to toggle it to English? I can help you translate that.

Save echarts4r results to high resolution figures?

Hi John,

So great package you have developed! Well, could we save the results to high-resolution figures? For example, 600dpi PNG or TIF figure, even the pdf format. As you know, many journals require high-resolution figures in papers for publication.

Bests,
Shisheng

Handle selected option in e_pie

Hi,

There are selected option in series-pie.data. How can I use it with echarts4r?

My final attempt:

library(dplyr)
library(echarts4r)

iris %>% 
    group_by(Species) %>% 
    summarise(count = n()) %>%
    mutate(selected = Species == "setosa") %>% 
    e_charts(Species) %>% 
    e_pie(count) %>% 
    e_add(param = "selected", selected) 

Colors of lines doesn't change in the legend and tooltip

Why colors of lines doesn't change in the legend and tooltip? Is it a bug or it is necessary to add some property?

tt <- data.table(
  x = seq(1:15), 
  a = rnorm(15, mean = 10, sd = 5), 
  b = rnorm(15, mean = 5, sd = 3),
  c = rnorm(15, mean = 8, sd = 2)
) 

tt %>%
  e_charts(x, backgroundColor = "#1a1a1a") %>%
  e_line(a, symbol = 'none', smooth = FALSE, lineStyle = list(color = "#00e5ff")) %>%
  e_line(b, symbol = 'none', smooth = FALSE, lineStyle = list(color = "#33ff99")) %>%
  e_line(c, symbol = 'none', smooth = FALSE, lineStyle = list(color = "#ff33b8")) %>%
  e_grid(left = '4%', right = '3%', bottom = '10%', containLabel = TRUE) %>%
  e_tooltip(trigger = "axis") %>%
  e_legend(bottom = 1, textStyle = list(color = "#bdbdbd")) %>%
  e_title(text = "This is title",
          textStyle = list(color = "#bdbdbd", fontWeight = 400,
                           lineHeight = 1.5)) %>%
  e_x_axis(splitLine = list(show = FALSE),
           axisLine = list(lineStyle = list(color = "#bdbdbd")),
           axisLabel = list(color = "#bdbdbd")) %>%
  e_y_axis(axisLine = list(show = FALSE), axisTick = list(show = FALSE),
           axisLabel = list(color = "#bdbdbd"))

Axis was not rendered correctly when distribution is very disperse.

    src  %>% 
      mutate(cut = as.character(cut)) %>% 
      inner_join(bin, by='cut') %>% 
      e_charts(bin) %>% 
      e_bar(count, barWidth = 20, barGap = '100%') %>% 
      e_y_axis(type = 'value',name = '',splitLine = list(show=F), show = F) %>%
      e_x_axis(type = 'value',name = '',splitLine = list(show=F)) %>%
      e_tooltip() %>% 
      e_theme("walden") %>% 
      e_datazoom(x.index = 0) %>% e_toolbox_feature(feature = "restore")

image
image

Is it possible to enhance e_river function so that we can just feed a dimension that has all the individual 'river'

dates <- seq.Date(Sys.Date() - 30, Sys.Date(), by = "day")

river <- data.frame(
  dates = dates,
  apples = runif(length(dates)),
  bananas = runif(length(dates)),
  pears = runif(length(dates))
)

river %>% 
  e_charts(dates) %>% 
  e_river(apples) %>% 
  e_river(bananas) %>% 
  e_river(pears) %>% 
  e_tooltip(trigger = "axis") %>% 
  e_title("River charts", "(Streamgraphs)")

maybe something like
river %>%
e_charts(dates) %>%
e_river(c("apples","bananas","pears") %>%
...

so that we can have a more generic function and not tied to a known data frame for such chart.

funnel chart does not accept nested list parameter

Hi,

Below code will run into error:

funnel %>%
e_charts() %>%
e_funnel(value, stage, legend = F,
label = list(show = T)
)

Warning: 'glue::collapse' is deprecated.
Use 'glue_collapse' instead.
See help("Deprecated") and help("glue-deprecated").
Error: list(show = T) must evaluate to column positions or names, not a list

while level 1 parameters works fine, like below
funnel %>%
e_charts() %>%
e_funnel(value, stage, legend = F,
maxSize = '250%'
)

I have tried similar approach in graph which seems to work well:

    e_charts() %>%
      e_graph(name = 'Diagram', roam = T, nodeScaleRatio = 0.5, layout = 'circular', 
              label = list(show = T, color = '#999', offset = c(20,20)),
              symbolSize = 50, focusNodeAdjacency=T, symbol = 'roundRect')

Removal of annoying behaviour in package installation

Hi,

I found it a bit annoying to see below chain of installations whenever I try to update the package. Could you keep the Import list to essential and move them to suggests? I believe the latter one won't trigger installation of dependent package each time.

d3r/data.tree -> visNetwork -> DiagrammeR

horizontal bar with axis index

I have some trouble with using e_flip_coords() and x.index or y.index. When I use it together I have a blank page. Maybe have another way to build horizontal bar without using e_flip_coords()?

For example:

library(echarts4r)
library(plyr)
library(dplyr)

USArrests %>% 
    mutate(State = rownames(USArrests)) %>%
    slice(1:5) %>%
    e_charts(State) %>%
    e_bar(Murder, y.index = 0) %>%
    e_bar(Rape, y.index = 1) %>%
    e_flip_coords()

Not work, but without e_flip_coords() is working well.

Chain _functions?

Hi,

How to plot when you have a dynamic set of data frame which you don't know how many series you have. Is there a way to do this programmatically instead of a bunch of if else?

df %>%
e_charts(label) %>%
e_bar_("a") %>%
e_bar_("b") %>%
e_bar_("c")

something like lapply(c('a','b','c'),function(x){}) , I don't know the exact implementation

`aes()` function in echarts4r

Thanks for creating such an awesome package!

Recently, I use the echarts4r package to make a line plot in which there are many lines in a plot. However, I find that it is a little difficult to plot multiple series in a single chart using the e_line() function. Here is an example:

library(echarts4r)
USArrests %>% 
  dplyr::mutate(State = row.names(.)) %>% 
  e_charts(Assault) %>% 
  e_line(Murder) %>% 
  e_line(UrbanPop) %>%
  e_line(Rape) %>% 
  e_tooltip(trigger = "axis")

It seems that I need use the e_line() function three times to obtain the desired results. I'm a .newcomer to echarts4r package. I don't know whether there is a more elegant solution to this problem in echarts4r package just like the aes() function in ggplot2.

In particular, I find that the hcaes() function in package highcharter is very handy to use when solving the above problem. Here is an example:

library(dplyr)
library(tidyr)
library(highcharter)
dtemp <- tibble::tibble(
  month = month.abb, 
  tokyo = c(7, 6.9, 9.5, 14.5, 18.2, 21.5, 25.2, 26.5,
            23.3, 18.3, 13.9, 9.6),
  new_york = c(-0.2, 0.8, 5.7, 11.3, 17, 22, 
               24.8, 24.1, 20.1, 14.1, 8.6, 2.5),
  berlin = c(-0.9, 0.6, 3.5, 8.4, 13.5, 17,
             18.6, 17.9, 14.3, 9, 3.9, 1),
  london = c(3.9, 4.2, 5.7, 8.5, 11.9, 15.2, 
             17, 16.6, 14.2, 10.3, 6.6, 4.8)
)
dtemp
dtemp %>% 
  mutate(month = Sys.Date() + 1:12) %>% 
  rename(date = month) %>% 
  gather(key = "City", value = "Temperature", -date) %>% 
  hchart(type = "line",
         hcaes(x = date, y = Temperature, group = City)) %>% 
  hc_title(text = "Avg. Temperature") %>% 
  hc_xAxis(title = list(text = "Month")) %>% 
  hc_yAxis(title = list(text = "Avg. Temperature")) %>% 
  hc_add_theme(hc_theme_monokai())

So would you consider adding eaes() function in the echarts4r package?

Can't wrap e_charts in a function

Hi,

Thanks for this great package, I wanted to play a little bit with it and I came across something odd.
Here is a reprex

library(echarts4r)
set.seed(1)
df <- data.frame(date = c("2018-01-01", "2018-01-02"),
                x = rnorm(n = 2, mean = 4),
                y = rnorm(n = 2, mean = 5))

f <- function(mycolname) {
  df %>%
    e_charts(date) %>%
    e_area(mycolname)
}

f("x")
Error in FUN(X[[i]], ...) : object 'mycolname' not found

mycolname <- "y"
f("x") ## it 'works' but uses the global value ("y") not the one in the function scope "x"

I wanted to know if it's a bug or feature and what's the best way to create wrapper functions.

Thanks again

Session info

Session info ---------------------------------------------------
 setting  value                                      
 version  R version 3.5.0 Patched (2018-04-28 r74669)
 system   x86_64, linux-gnu                          
 ui       X11                                        
 language (EN)                                       
 collate  en_US.UTF-8                                
 tz       Africa/Dakar                               
 date     2018-05-04                                 

Packages -------------------------------------------------------
 package     * version    date      
 assertthat    0.2.0      2017-04-11
 base        * 3.5.0      2018-04-28
 bindr         0.1.1      2018-03-13
 bindrcpp      0.2.2      2018-03-29
 compiler      3.5.0      2018-04-28
 crosstalk     1.0.0      2016-12-21
 datasets    * 3.5.0      2018-04-28
 devtools      1.13.5     2018-02-18
 digest        0.6.15     2018-01-28
 dplyr         0.7.4      2017-09-28
 echarts4r   * 0.0.1      2018-05-04
 glue          1.2.0      2017-10-29
 graphics    * 3.5.0      2018-04-28
 grDevices   * 3.5.0      2018-04-28
 htmltools     0.3.6      2017-04-28
 htmlwidgets   1.2.1      2018-05-02
 httpuv        1.4.2      2018-05-03
 jsonlite      1.5        2017-06-01
 later         0.7.2      2018-05-01
 magrittr      1.5        2014-11-22
 memoise       1.1.0      2017-04-21
 methods     * 3.5.0      2018-04-28
 mime          0.5        2016-07-07
 pillar        1.2.2      2018-04-26
 pkgconfig     2.0.1      2017-03-21
 promises      1.0.1      2018-04-13
 R6            2.2.2      2017-06-17
 Rcpp          0.12.16    2018-03-13
 rlang         0.2.0.9001 2018-04-30
 shiny         1.0.5      2017-08-23
 stats       * 3.5.0      2018-04-28
 tibble        1.4.2      2018-01-22
 utils       * 3.5.0      2018-04-28
 withr         2.1.2      2018-04-29
 xtable        1.8-2      2016-02-05
 yaml          2.1.19     2018-05-01
 source                               
 CRAN (R 3.5.0)                       
 local                                
 CRAN (R 3.5.0)                       
 CRAN (R 3.5.0)                       
 local                                
 CRAN (R 3.5.0)                       
 local                                
 CRAN (R 3.5.0)                       
 CRAN (R 3.5.0)                       
 CRAN (R 3.5.0)                       
 Github (JohnCoene/echarts4r@f19bf67) 
 CRAN (R 3.5.0)                       
 local                                
 local                                
 CRAN (R 3.5.0)                       
 Github (ramnathv/htmlwidgets@e3097fa)
 CRAN (R 3.5.0)                       
 CRAN (R 3.5.0)                       
 CRAN (R 3.5.0)                       
 CRAN (R 3.5.0)                       
 CRAN (R 3.5.0)                       
 local                                
 CRAN (R 3.5.0)                       
 CRAN (R 3.5.0)                       
 CRAN (R 3.5.0)                       
 CRAN (R 3.5.0)                       
 CRAN (R 3.5.0)                       
 CRAN (R 3.5.0)                       
 Github (r-lib/rlang@82b2727)         
 CRAN (R 3.5.0)                       
 local                                
 CRAN (R 3.5.0)                       
 local                                
 Github (jimhester/withr@79d7b0d)     
 CRAN (R 3.5.0)                       
 CRAN (R 3.5.0)                       

arrows question

Hi! Thank you for great package!

Is it possible to draw arrows on the plot? Like in ggplot2 geom_segment?

License question

Hello, can you give more info about the license of the package? Now it is just stated that Baidu Inc. is the copyright holder.
But the code of echarts 4 in the official github repository (https://github.com/apache/incubator-echarts) is now under Apache 2.0 License.

Thanks for good package, I will give it a try.

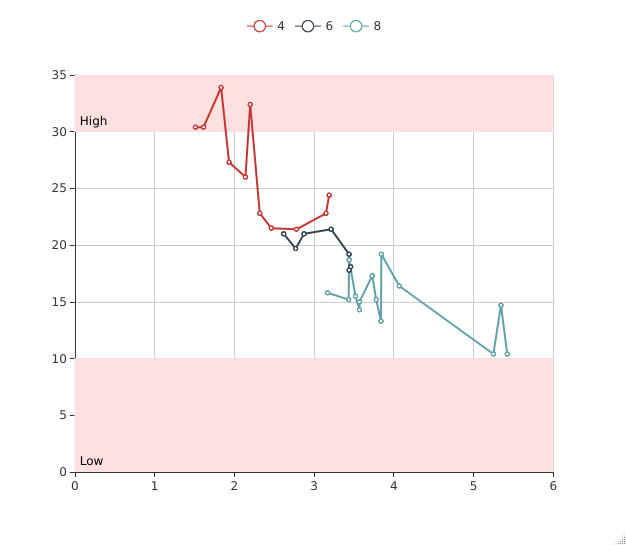
Multple mark area style

Hi,

Thank for this awesome package.

How can I use a multiple mark areas with the separate styles.

Example of code:

mtcars %>% 
  group_by(cyl) %>% 
  e_charts(x = wt) %>%
  e_line(serie = mpg) %>% 
  e_mark_area(
    itemStyle = list(
      normal = list(color = "#ffe0e1")
    ),
    label = list(
      normal = list(position = "insideBottomLeft", color = "#000000")
    ),
    data = list(
      list(yAxis = 30, name = "High"),
      list(yAxis = 35)
    )) %>% 
  e_mark_area(
    itemStyle = list(
      normal = list(color = "#cbffd1")
    ),
    label = list(
      normal = list(position = "insideBottomLeft", color = "#000000")
    ),
    data = list(
      list(yAxis = 10, name = "Low"),
      list(yAxis = 0)
    )) %>% 
  e_tooltip(trigger = "axis")

default

I used CRAN-version.

title of toolbox features in english or custom titles

is it possible to switch language of the toolbox-elements as the default appears to be chinese? Or even name them by being able to pass some sort of title="" argument in the e_toolbox() function? By the way : thanks for your great package.

timeline question

hello,thank you for your contributions to visualization of R,and i want to ask how can i combine timeline with e_pie

support svg render?

Hi,
I have 2 questions about echarts4r.

  1. How to export graph when use echarts4r pakage?
    2.If the picture is enlarged, it will become blurred; and if it is not enlarged, it is often not clear in the word. And Echarts support both svg and canvas now. Could you add svg render support for Echarts in echarts4r pkage?

Thanks

Issues w/ Background Color

Here's an interesting one I'm finding but not really sure of the root cause yet.

mtcars %>%
  e_charts(cyl) %>%
  e_bar(mpg) %>%
  e_theme("westeros") %>%
  e_toolbox_feature(feature = "saveAsImage") %>%
  e_color(background = "red")

It appears that e_color doesn't properly apply the background colors, even without e_theme. What's more, using the "save as image" button saves a png with alpha transparency for the white background. However, if you set e_theme("dark"), the background correctly changes to black, including when using "save as image".

My initial gut feeling here says that it's something to do with how it prints to the RStudio Viewer, which is then transferred to htmlwidgets::saveWidget(). Given htmlwidgets various issues, I'm almost wondering if an echarts4r function to export the plots to html/svg directly would be a good enhancement - I've come across other saveWidget() issues when using renderer="svg".

BoundaryGap

First of all, many thanks for this amazing package!

When creating a line chart, I came across the fact that there is always a gap between the start/end of the line-chart and the x-axis. I found out through Baidu that you can change this by setting boundaryGap to FALSE.

However, I could not get this to work. I tried the following:
mtcars %>% e_charts(wt) %>% e_area(qsec) %>% e_x_axis(boundaryGap = FALSE, min = 1)

Is this not available in the package or did I do something wrong? Thank you!

toolbox (save/join) doesn't work with network diagram

nodes <- data.frame(
    name = sample(LETTERS, 10),
    value = value,
    size = value,
    grp = rep(c("grp1", "grp2"), 5),
    stringsAsFactors = FALSE
)

edges <- data.frame(
    source = sample(nodes$name, 20, replace = TRUE),
    target = sample(nodes$name, 20, replace = TRUE),
    stringsAsFactors = FALSE
)

e_charts() %>%
    e_graph() %>%
    e_graph_nodes(nodes, name, value, size, grp) %>%
    e_graph_edges(edges, source, target) %>% e_toolbox(feature = "saveAsImage", title = "Save As Image")

calendar question

Hi, thx for your work!

It isn't an error but I have a question.
How to make auto-separated years in a calendar?

I try something like that:

dates <- seq.Date(as.Date("2017-01-01"), as.Date("2018-12-31"), by = "day")
values <- rnorm(length(dates), 20, 6)
year <- data.frame(date = dates, values = values)
year %>% 
  e_charts(date) %>% 
  e_calendar(range = "2017",top="40") %>% 
  e_calendar(range = "2018",top="260") %>% 
  e_heatmap(values, coord.system = "calendar") %>% 
  e_visual_map(max = 30) %>% 
  e_title("Calendar", "Heatmap")%>%
  e_tooltip("item")

Is any solution like fill from ggplot?

year %>% 
  e_charts(date) %>% 
  e_calendar(range = fill(year)) %>% 
   e_heatmap(values, coord.system = "calendar") %>% 
  e_visual_map(max = 30) %>% 
  e_title("Calendar", "Heatmap")%>%
  e_tooltip("item")

Expected output : this
Thx for any advice!

e_arrange doesn't work during the shiny session

As I understand e_arrange is a new feature in the latest library. It is written in the documentation that e_arrange may not work properly in the RStudio viewer. But should it work in the shiny session? I have decided to try it instead of grid.

library(shiny)
library(shinydashboard)


ui <- dashboardPage(
  
  dashboardHeader(),
  
  dashboardSidebar(
    
    sidebarMenu(id = "tabs",
                menuItem("Users activity", tabName = "users_activity"))
    
  ),
  
  dashboardBody(
    tabItems(
      tabItem(tabName = "users_activity",
              fluidPage(title = "Users activity",  echarts4rOutput("agg_plot"))
      )
    )
  )
)


server <- function(input, output, session) {
  
  df <- data.frame(
    weekDay = c("Monday", "Tuesday", "Wednesday", "Thursday", "Friday", "Saturday",
                "Sunday"),
    a = rnorm(7, 15, 3),
    b= rnorm(7, 10, 4),
    c = rnorm(7, 8, 5)
  )
  
  output$agg_plot <- renderEcharts4r({
    
    plot_1 <- df %>%
      e_charts(weekDay) %>%
      e_bar(a) %>%
      e_grid(left = '4%', right = '3%', bottom = '10%', containLabel = TRUE) %>%
      e_tooltip(trigger = "axis") %>%
      e_legend(show = FALSE) %>%
      e_title(text = "This is title 1") %>%
      e_color(color = "#00e5ff") %>%  
      e_group("grp") # assign group
    
    plot_2 <- df %>%
      e_charts(weekDay) %>%
      e_bar(b) %>%
      e_grid(left = '4%', right = '3%', bottom = '10%', containLabel = TRUE) %>%
      e_tooltip(trigger = "axis") %>%
      e_legend(show = FALSE) %>%
      e_title(text = "This is title 2") %>%
      e_color(color = "#33ff99")%>%
      e_group("grp") %>%
      e_connect_group("grp")

    plot_3 <- df %>%
      e_charts(weekDay, height = 200, width = "100%") %>%
      e_bar(c) %>%
      e_grid(left = '4%', right = '3%', bottom = '10%', containLabel = TRUE) %>%
      e_tooltip(trigger = "axis") %>%
      e_legend(show = FALSE) %>%
      e_title(text = "This is title 3") %>%
      e_color(color = "#ff33b8") %>%
      e_group("grp") %>%
      e_connect_group("grp")

    plot <- e_arrange(plot_1, plot_2, plot_3, cols = 1, rows = 3)
    plot
    
  })
  
}

shinyApp(ui, server)

Displaying extra variables in tooltips

Hi
I'm trying to make plot with extra variables in tooltips, but can't understand how to make it.
Tutorial from API didn't help me
Example :

library(dplyr)
library(echarts4r)
mtcars %>%  
  tibble::rownames_to_column("model") %>% 
  e_charts(wt) %>% 
  e_scatter(mpg,bind=model) %>%
  e_tooltip(formatter = htmlwidgets::JS("
                                        function(params){
                                        return('<strong>' + params.name + 
                                        '</strong><br />wt: ' + params.value[0] + 
                                        '<br />mpg: ' +  params.value[1] +
                                        '<br />qsec: ' +  this.qsec )   }  "))

expected result something like this:
jbkunst/highcharter#54

gridIndex for more than two charts

Probably the property gridIndex is the closest analog in the library of facet_grid from ggplot2 . For two charts grid works fine. But when there are appear more than two charts top charts just merge with each other. How it can be fixed?

df <- data.frame(
  weekDay = c("Monday", "Tuesday", "Wednesday", "Thursday", "Friday", "Saturday",
              "Sunday"),
  a = rnorm(7, 15, 3),
  b= rnorm(7, 10, 4),
  c = rnorm(7, 8, 5)
)

df %>%
  e_charts(weekDay) %>%
  e_bar(a) %>%
  e_bar(b, x_index = 1, y_index = 1) %>%
  e_bar(c, x_index = 2, y_index = 2) %>%
  e_grid(height = "20%") %>%
  e_grid(height = "20%", top = "35%") %>%
  e_grid(height = "20%", top = "65%") %>%
  e_tooltip(trigger = "axis") %>%
  e_legend(bottom = 1, textStyle = list(color = "#bdbdbd")) %>%
  e_title(text = toupper("Title")) %>%
  e_y_axis(gridIndex = 0) %>%
  e_x_axis(gridIndex = 0) %>%
  e_y_axis(gridIndex = 1) %>%
  e_x_axis(gridIndex = 1) %>%
  e_y_axis(gridIndex = 2) %>%
  e_x_axis(gridIndex = 2) %>%
  e_color(color = c("#00e5ff", "#33ff99", "#ff33b8"))

e_label formatter multiple values

I'm referencing the official documentations here, but I'm not quite sure if the syntax is translating over to echarts4r the same way. It seems to be that this way should work:

  e_labels(show = TRUE,
          position = "insideTopLeft",
          formatter = "{b}\n{c}\n{@relativeValue}",
          fontSize = 10)

...But it doesn't. {b} resolves to the line item name and {c} resolves to the line item first value just fine, but I can't seem to get the third column (relativeValue) to render with {@relativeValue} - it outputs the same as {b}. Particularly, this is the part of the documentation I'm referencing:

{@xxx}: the value of a dimension named'xxx', for example,{@product}refers the value of'product'` dimension

Likewise, referencing this part of the documentation:

{@[n]}: the value of a dimension at the index ofn, for example,{@[3]}` refers the value at dimensions[3].

The below code block should work too, using the index, but it doesn't.

  e_labels(show = TRUE,
          position = "insideTopLeft",
          formatter = "{b}\n{c}\n{@[3]}",
          fontSize = 10)

Add text

Hello
is it possible to add text or labels from another variable to some charts ! And how to add caption under the plot !

Recommend Projects

  • React photo React

    A declarative, efficient, and flexible JavaScript library for building user interfaces.

  • Vue.js photo Vue.js

    🖖 Vue.js is a progressive, incrementally-adoptable JavaScript framework for building UI on the web.

  • Typescript photo Typescript

    TypeScript is a superset of JavaScript that compiles to clean JavaScript output.

  • TensorFlow photo TensorFlow

    An Open Source Machine Learning Framework for Everyone

  • Django photo Django

    The Web framework for perfectionists with deadlines.

  • D3 photo D3

    Bring data to life with SVG, Canvas and HTML. 📊📈🎉

Recommend Topics

  • javascript

    JavaScript (JS) is a lightweight interpreted programming language with first-class functions.

  • web

    Some thing interesting about web. New door for the world.

  • server

    A server is a program made to process requests and deliver data to clients.

  • Machine learning

    Machine learning is a way of modeling and interpreting data that allows a piece of software to respond intelligently.

  • Game

    Some thing interesting about game, make everyone happy.

Recommend Org

  • Facebook photo Facebook

    We are working to build community through open source technology. NB: members must have two-factor auth.

  • Microsoft photo Microsoft

    Open source projects and samples from Microsoft.

  • Google photo Google

    Google ❤️ Open Source for everyone.

  • D3 photo D3

    Data-Driven Documents codes.