insightsengineering / tern Goto Github PK
View Code? Open in Web Editor NEWTable, Listings, and Graphs (TLG) library for common outputs used in clinical trials
Home Page: https://insightsengineering.github.io/tern/
License: Other
Table, Listings, and Graphs (TLG) library for common outputs used in clinical trials
Home Page: https://insightsengineering.github.io/tern/
License: Other
New function should be able to create the following outputs
MNG01
Plot of Mean and Confidence Interval
Plot of Mean and Confidence Intervals of Change from Baseline of Vital Signs (Changing the Input Analysis Data Set and Analysis Variable)
Plot of Mean (+/-SD) (Changing the Statistics)
Plot of Mean and Confidence Interval (Modify Alpha Level)
Plot of Mean and Confidence Interval (with Number of Patients only in Table Section)
Plot of Mean and Confidence Interval (with Table Section)
Plot of Median and Confidence Interval (Condense Visits in Table Section)
Plot of Mean and Upper Confidence Limit
MDIS/stream_doc/um/report_outputs_mng01.html)
Provenance:
Creator: npaszty
Currently it just suppresses the warnings or does not show any result. Better would be to
Provenance:
Creator: danielinteractive
New function should be able to create the following outputs
LFG01
Liver Function Tests Patient Profile (LFG01)
Liver Function Tests Patient Profile (LFG01) (wrapping patient characteristics)
Provenance:
Creator: npaszty
Using 2021_05_05 release on R 3.6.3.
I noticed g_km has trouble when factor levels contains > or <. Here's some code:
library(tern)
library(dplyr)

adtte_arm_bep <- ex_adtte %>%
  df_explicit_na() %>%
  filter(PARAMCD == "OS", ARM == "A: Drug X", BEP01FL == "Y") %>%
  mutate(is_event = CNSR == 0,
         group = as.factor(ifelse(AGE>34,">Median","<=Median")))

variables <- list(tte = "AVAL", is_event = "is_event", arm = "group")

g_km(
  df = adtte_arm_bep,
  variables = variables,
  annot_surv_med = FALSE
)
Risk table is off in the plot, see below.
user/196/files/823ebc00-ea1e-11eb-9fa3-9a268a2efae0)
Seems to work fine for columns in the demographics table. Would be nice to be able have > and < in group levels as stratifying using some cutoff is common. Thanks!
Provenance:
Creator: harric17
New function should be able to create the following outputs
SHG01
Scatterplot of Maximum Level of Liver Function Tests
Scatterplot of Maximum Level of Liver Function Tests including Reference Lines
SLG01
Scatterplot of Maximum Level of Liver Function Tests
Scatterplot of Maximum Level of Liver Function Tests (adding reference lines using the recode option)
Scatterplot of Maximum Level of Liver Function Tests (adding reference lines using a pre-processing)
Provenance:
Creator: npaszty
tern has a number of grid helper function:
user/8/files/68038380-44de-11e9-9c85-45a676beacf7)
Please assess if the usage of gridExtra functions is not obsolete now, e.g. grid.arrange can be replaced with tern::arrange_grobs.
If possible replace the gridExtra calls and then remove gridExtra from the Imports field in the NAMESPACE.
Provenance:
Creator: waddella
NEST/tlg-catalog/pull/717/files
@anajens
I realized that these TLG unit tests are stored in tern, which is not the repo where I have been working (tlg-catalog is the issue’s repo). Hence, I created another branch in this tern repo in order to go forward with the addition of the AET06 variant 3 unit test and the fix of the error of AET02 variant 12 unit test (updated the expected structure as well). Do not know if this way (creating another branch) was the best course of action, but wanted to make these updates.
Updated NEWS too (by adding tern x.x.x) in order not to lose the updates included until the following version is created.
Provenance:
Creator: imazubi
New function should be able to create the following outputs
LTG01
Lattice Plot of Liver Function Tests
Lattice Plot of Liver Function Tests Including Mean and 95% CI as well as Median and 95% CI
Provenance:
Creator: npaszty
as in R we should use NA and not particular levels (as it scales to modelling)
I've seen new NEST users (myself included) get confused when setting up their first AE by grade teal visualization and getting a not super informative "subscript out of bound" error. Turns out you get this when you have missing values in required variables, e.g. AETOXGR, AEBODSYS, etc. Just wanted to suggest giving the end user a more informative error message for ease of debugging. Thanks!
Provenance:
Creator: harric17
Existing implementation of stat_median_ci is based on DescTools(version 0.99.35) R package. This is a non-parametric approach (i.e. distribution-free, and by the way, it can also be obtained from the acceptance region of the well-known nonparametric sign test against a two-sided alternative) to construction of median confidence interval. While it is reasonable in general, a more accurate CIs can be built under additional assumptions, among which, one of the most popular is that the sample comes from a normal distribution. For such a case there are several methods of estimations available (see e.g. Chakraborti (2007)). The one referred to as Lawless Interval (LA) is quite well established (see also Section 4.4 in Meeker at el. (2017)) and it is available in SAS through CIPCTLNORMAL function (see the screenshot, below)

Within this issue, the following two extensions should be researched:
stat_median_ci so that it can also compute a version of CIs dedicated for normally distributed samples, using Lawless Interval (LA) method.stat_median_ci more generic, so that any percentile CI can be computed, with the default median. It would require function renaming to e.g. stat_quantile_ci.Notice: The main reason for raising this issue is to keep the consistency with SAS, as in many analysis SPAs use CIPCTLNORMAL for median CI computations.
References:
Chakraborti, S. and Li, J. (2007) Confidence Interval Estimation of a Normal Percentile, The American Statistician, 61:4, 331--336. doi: 10.1198/000313007X244457. https://www.researchgate.net/publication/4986675_Confidence_Interval_Estimation_of_a_Normal_Percentile
Meeker, W.Q., Hahn, G.J. and Escobar, L.A. (2017) Statistical intervals : a guide for practitioners and researchers. Wiley
> prefixer::check_import_from()
Warning message:
These functions do not seem to be used: allFit, "%<>%", "%>%", "!!", "%||%", ":="
Those funs are being imported but not used. Please validate the need of importing
Provenance:
Creator: pawelru
This is required as a new option for the LGRT02 output table (multivariate logistic regression).
Unfortunately there does not seem to be a conventional implementation for it in R. The elrm package does not seem optimal as it uses MCMC which always comes with problems and has been removed from CRAN. A couple of code snippets can be found, e.g. see
https://zhanxw.com/blog/2011/02/exact-logistic-regression/
So this would be a quite large more research/stats effort here.
Provenance:
Creator: danielinteractive
In future rtables releases the argument add_overall_col may be deprecated.
Propose a design for a layout function in tern that can be a wrapper for split_cols_by(split_fun = add_overall_level(xx))
Provenance:
Creator: anajens
I am using tern 2020_05_05 on R 3.6.3. I noticed df_explicit_na encodes NA values as the factor level <Missing>. However d_onco_rsp_label handles the value Missing without the pointy brackets. Suggest a simple update d_onco_rsp_label to work better with df_explicit_na or vice versa.
Provenance:
Creator: harric17
... that is more concise. E.g. append_topleft_from_varlables
Provenance:
Creator: waddella
Good question from @imazubi:
In check_mmrm_vars() we are removing records with NA in order to check whether we have the minimum number of complete records. However, in TLG-C df_explicit_na() is used so NAs are not NAs anymore but explicit missing levels. How should we deal with this?
Provenance:
Creator: danielinteractive
NEST/teal.modules.clinical/issues/1347.
This function is going to be used the upcoming new teal module.
Basically, the function created in tlg-c has been taken and moved into tern.
releases/2021_07_07/tlg-catalog/
user/3190/files/0d527700-f37a-11eb-822e-8e4fc88a52ac)
Once this PR is accepted, I will add another issue to update the TLG-C by using this new tern helper function.
@bahatsky I am assigning this review to you as you are very familiarized with this SMQ analysis and the function that was already created in TLG-C-
Provenance:
Creator: imazubi
After the Dec 2020 release, let's increment the required versions in tern of the packages emmeans, lmerTest, lme4 and optimx to latest available versions for given R version. Then inform enableR team to do the same update, so that in the next enableR release we can have most recent versions.
Provenance:
Creator: danielinteractive
look into scales::col_factor
Provenance:
Creator: waddella
NEST/tern/pull/1277
NEST/tern/issues/1275
@anajens
Most important on BEE R 4.0.3 we use survival version '3.2.7' so this is not a problem there.
@waddella ask us to test NEST packages on R 4.1.0 with newer survival.
TL;DR
Precisely survival::clogit might give Inf loop over >= "3.2.9" survival version, only for "exact" method and presorted dataset.
If we shuffle the dataset, then it optimize correctly. So it looks like pre-sorted data might cause problems now for "exact" method.
I created a github issue therneau/survival#151 , hopefully survival authors will respond.
The new scaling functionality was introduce with this commit therneau/survival@cd13496#diff-9c3fe81a7b4cf1c186184f63ea7d06bc27fafc3707a1dcaff9896bb96036349a, which i think is the source of the problem. (here (scaling) it crashed RStudio too therneau/survival#146). Moreover clogit ("exact" method) depends on coxph which looks to cause the problem.
In my opinion we should wait till survival package maintainers will solve this issue. Till this moment we could not use survival version >= "3.2.9".
Another option is to use popular method "breslov" which is used in other packages.
user/2704/files/40cfec00-df09-11eb-87e8-d13398f8423b)
There was another solution suggested to always shuffling a dataset.
Provenance:
Creator: Polkas
Maybe https://aosmith.rbind.io/2018/07/19/manual-legends-ggplot2/ can be helpful here, in particular:

Using tern 2020_05_05 with R 3.6.3. Does it make sense to have d_onco_rsp_label additionally convert to factor and set levels since overall response is inherently ordered? The table in the RSPT01 TLG catalog itself has response categories out of order.
Provenance:
Creator: harric17
linked to https://github.roche.com/NEST/nest_on_bee/issues/91
PR: https://github.roche.com/NEST/nest_on_bee/pull/93
I'm using tern with RMarkdown in R 3.6.3 and frequently get this error when trying to knit the RMarkdown file:

This will occur even after restarting my session and trying to re-knit. Here's some example code:
rm(list=ls())
<REDACTED>NEST/nest_on_bee/master/bee_nest_utils.R")
bee_use_nest(release = "2021_05_05")

library(tern)
library(dplyr)
library(ggplot2)
I find that restarting my session and then running each line above individually helps. But it would be nice to just be able to knit the RMarkdown file straight away from a restarted R session.
Provenance:
Creator: harric17
This function should help transform ADAE dataset from wide to long for each selected SMQ / CQ.
Alternative idea would be to not transform dataset and define a new split function to be used in rtables layout pipeline.
releases/2020_12_17/embedded/agile-R/tlg_catalog/tables/aet09_smq/) entry.
Provenance:
Creator: anajens
See integration tests
blue/organizations/jenkins/NEST-Automation%2Frocker%2Fnestreleases/detail/master/80/pipeline
[2021-08-03T03:18:47.390Z]   Running ‘testthat.R’

[2021-08-03T03:18:47.390Z]  ERROR

[2021-08-03T03:18:47.390Z] Running the tests in ‘tests/testthat.R’ failed.

[2021-08-03T03:18:47.390Z] Last 13 lines of output:

[2021-08-03T03:18:47.390Z]

[2021-08-03T03:18:47.390Z]   x[128]: "(43.78, 52.581)"

[2021-08-03T03:18:47.390Z]   y[128]: "(43.78, 52.58)"

[2021-08-03T03:18:47.390Z]

[2021-08-03T03:18:47.390Z]   x[130]: "(-9.79, 3.183)"

[2021-08-03T03:18:47.390Z]   y[130]: "(-9.789, 3.183)"

[2021-08-03T03:18:47.390Z]

[2021-08-03T03:18:47.390Z]   [ FAIL 3 | WARN 4 | SKIP 0 | PASS 1837 ]

[2021-08-03T03:18:47.390Z]   Error: Test failures

[2021-08-03T03:18:47.390Z]   In addition: Warning message:

[2021-08-03T03:18:47.390Z]   The `wrap` argument of `test_dir()` is deprecated as of testthat 3.0.0.

[2021-08-03T03:18:47.390Z]   This warning is displayed once every 8 hours.

[2021-08-03T03:18:47.390Z]   Call `lifecycle::last_warnings()` to see where this warning was generated.

[2021-08-03T03:18:47.390Z]   Execution halted

[2021-08-03T03:18:47.390Z]   Error while shutting down parallel: unable to terminate some child processes

[2021-08-03T03:18:47.390Z] * checking for unstated dependencies in vignettes ... OK

[2021-08-03T03:18:47.390Z] * checking package vignettes in ‘inst/doc’ ... WARNING

[2021-08-03T03:18:47.390Z] dir.exists(dir) is not TRUE

[2021-08-03T03:18:47.390Z] Package vignette without corresponding single PDF/HTML:

[2021-08-03T03:18:47.390Z]    ‘introduction.Rmd’

[2021-08-03T03:18:47.390Z]

[2021-08-03T03:18:47.390Z] * checking running R code from vignettes ...

[2021-08-03T03:18:47.390Z]   ‘introduction.Rmd’ using ‘UTF-8’... OK

[2021-08-03T03:18:47.390Z]  NONE

[2021-08-03T03:18:47.390Z] * checking re-building of vignette outputs ... OK

[2021-08-03T03:18:47.390Z] * checking PDF version of manual ... OK

[2021-08-03T03:18:47.390Z] * DONE

[2021-08-03T03:18:47.390Z]

[2021-08-03T03:18:47.390Z] Status: 1 ERROR, 2 WARNINGs, 1 NOTE

[2021-08-03T03:18:47.390Z] See

[2021-08-03T03:18:47.390Z]   ‘/automation_code/install_rpkgs_with_log/buildfiles/check/tern.Rcheck/00check.log’

[2021-08-03T03:18:47.390Z] for details.
Use rocker image to reproduce
<REDACTED>nest/r/rocker/nest:devel-latest
Provenance:
Creator: gogonzo
Consider adding an optional arguments in g_forest called vline_overall to show an optional dash line at the position of overall treatment effect as below.
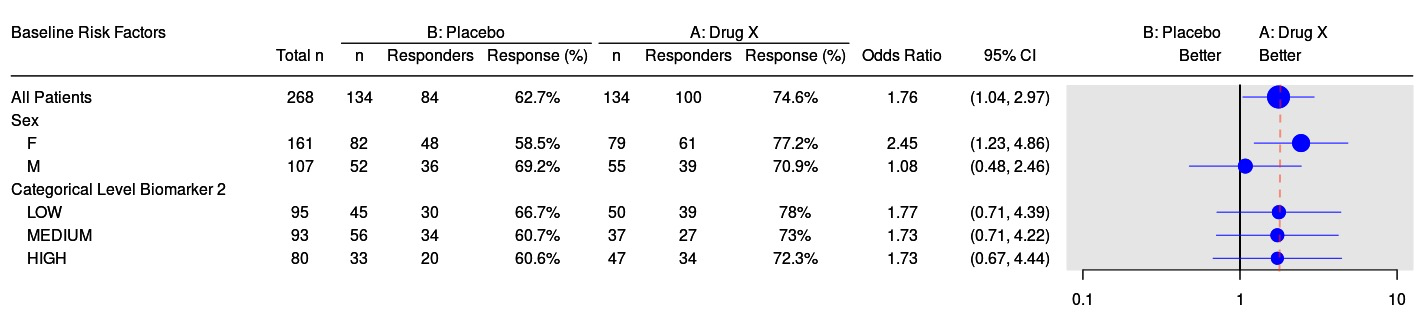
vline_overall should take value T or F and be defaulted to F. When vline_overall = T, a second vline is added in forest_grob. Position of this second vline is read from tbl.
Affected modules
Provenance:
Creator: anajens
MDIS/stream_doc/2_11/um/report_outputs_aet01_aesi.html). Likely no new layout functions are needed.
random.cdisc.data does not yet include all variables. Note STREAM v2.11 was release so BEE paths are updated.radae in a separate issue.Provenance:
Creator: anajens
MDIS/stream_doc/2_11/um/report_outputs_mng01.html?highlight=mng01) catalogue and GDSR specifications.
releases/2021_07_07/embedded/goshawk/reference/g_lineplot.html).
Provenance:
Creator: anajens
so that a CI run takes less than 4 min
You can check how long CI takes by creating a PR and updating your branch 03_CIsuite@main.
Redesign LBT05 family of functions (eg count_abnormal_by_marked, s_*, a_*) to work with rtables::trim_levels_to_map. Background issue (insightsengineering/rtables#203)
The idea is that based on metadata map the function can return either low , high, or low and high summary rows.
Rationale: improved speed, allow users to precisely control which combinations of levels among several categorical variables used in the layout should be displayed.
Please add the PR link(s) below.
.spl_context approach. similar to LBT07already existed NOTE:
user/2704/files/f854af00-db53-11eb-8a97-c204194ebf29)
We have 114 dependencies (whole tree - dependencies of dependencies too) for tern and all of them takes 0.5 Gb of memory.
Of course most of these packages are used by other packages too.
# using pacs package https://github.com/Polkas/pacs
cat(pacs::pac_true_size("tern")/10**6, "Mb")
# 442.9339 Mb
# pacs::pac_deps("tern")
nrow(pacs::pac_deps("tern"))
# 114
Provenance:
Creator: Polkas
Approach with insert_rrow may not be a good idea as per github.com discussion. Functionality may even be deprecated.
Provenance:
Creator: anajens

Idea / Background:
To do:
extract_rsp_biomarkerstabulate_rsp_biomarkersh_logistic_mult_cont_dfh_rsp_to_logistic_variablesstrata variable option to fit_logistich_logistic_simple_terms work with clogit model objecth_glm_simple_term_extract work with clogit model objecth_tab_rsp_one_biomarkerBesides the log-rank (cox score) p-value, tern currently supports cox wald and likelihood ratio test p-values. Missing are weighted log-rank tests, e.g. Peto-Peto, Gehan-Breslow, etc.
Currently, these tests serve as sensitivity analyses at best (not included in most SAPs). The log-rank test remains the preferred primary analysis for time-to-event endpoints by regulatory agencies. So the question comes down to how much we prioritize primary vs secondary analysis of clinical endpoints.
NEST/tlg-catalog/pull/611
Provenance:
Creator: anajens
This is commonly used in neuroscience studies.
Provenance:
Creator: anajens
Basic/generic data pre-processing should not be done on the user but rather on the back end. this is true for both tern and teal but opening issue in tern to cover both.
Provenance:
Creator: npaszty
Closes #1290
Provenance:
Creator: bahatsky
New function should be able to create the following outputs
IPP02
Individual Patient Plot over Time with Treatment Group Mean

Individual Patient Plot over Time with Treatment Group Mean with Attributes Unified with a Group

Individual Patient Plot over Time with Treatment Group Mean and 95% CI with Attributes Unified with a Group

MDIS/stream_doc/um/report_outputs_ipp02.html)
Provenance:
Creator: npaszty
> library(tern)
> library(dplyr)
>
> tbl <- basic_table() %>%
+   split_cols_by("ARM") %>%
+   split_cols_by("STRATA2") %>%
+   count_occurrences("AEDECOD") %>%
+   build_table(ex_adae %>% slice(1:300), ex_adsl)
> tbl
                      A: Drug X              B: Placebo           C: Combination
                    S1          S2         S1         S2          S1         S2
-----------------------------------------------------------------------------------
dcd A.1.1.1.1    5 (6.8%)    2 (3.3%)   1 (1.5%)    4 (6%)     3 (5.4%)   5 (6.6%)
dcd A.1.1.1.2    6 (8.2%)    5 (8.2%)   1 (1.5%)    4 (6%)     3 (5.4%)   3 (3.9%)
dcd B.1.1.1.1    6 (8.2%)    3 (4.9%)   1 (1.5%)   7 (10.4%)   1 (1.8%)   6 (7.9%)
dcd B.2.1.2.1    7 (9.6%)    4 (6.6%)    2 (3%)    5 (7.5%)    4 (7.1%)   6 (7.9%)
dcd B.2.2.3.1    3 (4.1%)    2 (3.3%)      0       5 (7.5%)    1 (1.8%)   5 (6.6%)
dcd C.1.1.1.3   11 (15.1%)   1 (1.6%)    2 (3%)    5 (7.5%)    1 (1.8%)   4 (5.3%)
dcd C.2.1.2.1    1 (1.4%)    3 (4.9%)    2 (3%)     6 (9%)     3 (5.4%)   6 (7.9%)
dcd D.1.1.1.1    4 (5.5%)    2 (3.3%)    2 (3%)     2 (3%)     2 (3.6%)   5 (6.6%)
dcd D.1.1.4.2    6 (8.2%)    4 (6.6%)    2 (3%)    3 (4.5%)    2 (3.6%)   6 (7.9%)
dcd D.2.1.5.3    5 (6.8%)    4 (6.6%)    2 (3%)     6 (9%)     4 (7.1%)   8 (10.5%)
>
> # non-unique table names
> names(tbl)
[1] "A: Drug X"      "A: Drug X"      "B: Placebo"     "B: Placebo"     "C: Combination" "C: Combination"
>
> # Using helper function, we return only the first element for each nested column
> h_col_indices(tbl, "A: Drug X")
[1] 1
>
> # Impact: in accessor functions used for sorting / pruning the wrong info used if using table names
> first_row <- collect_leaves(tbl[1,])[[1]]
>
> # Using column indices gives the correct result.
> h_row_counts(first_row, col_indices = 1:6)
     A: Drug X.S1      A: Drug X.S2     B: Placebo.S1     B: Placebo.S2 C: Combination.S1 C: Combination.S2
                5                 2                 1                 4                 3                 5
>
> # Using column names gives the wrong result since within each nested column, only the first record is extracted
> h_row_counts(first_row, col_names = names(tbl))
     A: Drug X.S1      A: Drug X.S1     B: Placebo.S1     B: Placebo.S1 C: Combination.S1 C: Combination.S1
                5                 5                 1                 1                 3                 3
>
> # return only the first element
> h_row_counts(first_row, col_indices = h_col_indices(tbl, "A: Drug X"))
A: Drug X.S1
           5
Provenance:
Creator: anajens
NEST/teal/issues/1086
Provenance:
Creator: kpagacz
Ideally, we would like to have a central formula class(es) in NEST that deals with low-level R functions on formula checks, extraction and model frame construction. This could avoid duplicate helper functions such as s_ancova_items, t_tte_items etc.
Please see the design doc and comment there. Thanks!
Provenance:
Creator: danielinteractive
Currently it's not possible to insert column counts (N=xx) at the highest level (eg ARM) when a table has nested columns. For example:
user/118/files/5701ce00-2e8b-11eb-8d2c-d799d37b6565)
There is an issue open in rtables about how to do this: insightsengineering/rtables#135
Once the above is resolved, please update layout functions and tests for FSTG01 and FSTG02, and ONCT05.
Provenance:
Creator: anajens
See current issues on automation for branch main, e.g. https://github.com/insightsengineering/tern/runs/3190301432?check_suite_focus=true
Introduce lifecycle package for tern. Task needs one code-dev to implement or advice and one SPA to determine wow mature each function is.
NEST/teal/pull/835)
Provenance:
Creator: gogonzo
Follow-up to #958 with idea from @collinf1 about how warnings can be handled instead of muffled.
NEST/teal.modules.clinical/issues/674) .
For the record, note that the message is caught and nothing indicates a message was generated. Alternatively, an adapted construction from below could be used to capture the message and eventually attached as an attribute to the result.
try_car_anova <- function(mod,
                          test.statistic) { # nolint

  y <- tryCatch(
    withCallingHandlers(
      expr = {
        warn_text <- c()
        list(
          aov = car::Anova(
            mod,
            test.statistic = test.statistic,
            type = "III"
          ),
          warn_text = warn_text
        )
      },
      warning = function(w) {
        # If a warning is detected it is handled as "w".
        warn_text <<- trimws(paste0("Warning in `try_car_anova`: ", w))

        # A warning is sometimes expected, then, we want to restart
        # the execution while ignoring the warning.
        invokeRestart("muffleWarning")
      }
    ),
    finally = {
    }
  )

  return(y)
}
Provenance:
Creator: anajens
to check jenkins pipelines
Provenance:
Creator: waddella
pd/post/do-you-use-ttet01-for-time-to-event-analyses-please-read/
I guess we don't have this problem in the sense that we currently do NOT support p-value adjustment with Bonferroni.
"Issue: For studies in which more than 2 study arms are displayed in one TTET01 table (e.g., Control, Treatment 1, Treatment 2), STREAM will by default make the Bonferroni p-value adjustment for multiplicity. STREAM v1 allowed the option to employ a separate model for each pairwise comparison (in which case no adjustment would be performed) while STREAM v2 does not allow that option. This could result in inconsistencies in output between STREAM v1 and v2 when more than 2 study arms are displayed in one table."
But I guess it would be a nice additional feature for our t_tte if we would support the Bonferroni p-value adjustment.
Provenance:
Creator: danielinteractive
A declarative, efficient, and flexible JavaScript library for building user interfaces.
🖖 Vue.js is a progressive, incrementally-adoptable JavaScript framework for building UI on the web.
TypeScript is a superset of JavaScript that compiles to clean JavaScript output.
An Open Source Machine Learning Framework for Everyone
The Web framework for perfectionists with deadlines.
A PHP framework for web artisans
Bring data to life with SVG, Canvas and HTML. 📊📈🎉
JavaScript (JS) is a lightweight interpreted programming language with first-class functions.
Some thing interesting about web. New door for the world.
A server is a program made to process requests and deliver data to clients.
Machine learning is a way of modeling and interpreting data that allows a piece of software to respond intelligently.
Some thing interesting about visualization, use data art
Some thing interesting about game, make everyone happy.
We are working to build community through open source technology. NB: members must have two-factor auth.
Open source projects and samples from Microsoft.
Google ❤️ Open Source for everyone.
Alibaba Open Source for everyone
Data-Driven Documents codes.
China tencent open source team.