![]()
![]()
![]()


The tern R package contains analysis functions to create tables and graphs used for clinical trial reporting.
The package provides a large range of functionality, such as:
Data visualizations:
- Line plots (
g_lineplot) - Kaplan-Meier plots (
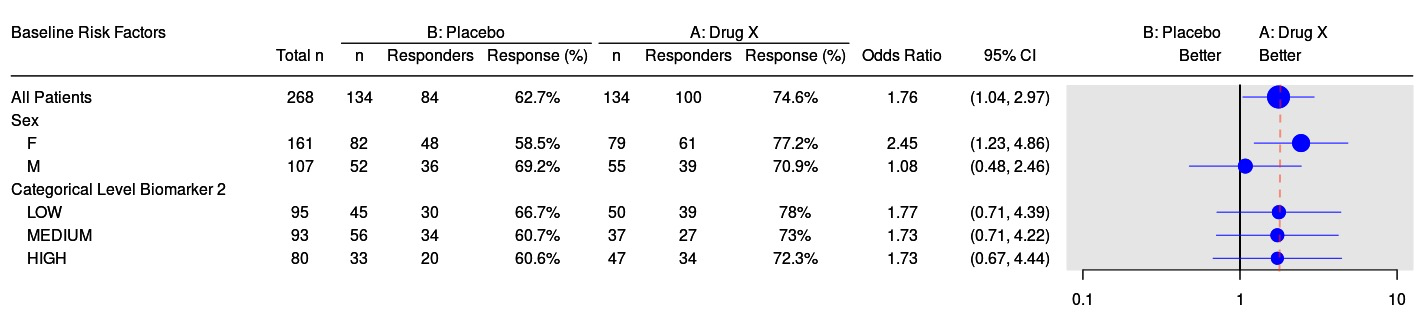
g_km) - Forest plots (
g_forest) - STEP graphs (
g_step) - Individual patient plots (
g_ipp) - Waterfall plots (
g_waterfall)
Statistical model fit summaries:
- Logistic regression (
summarize_logistic) - Cox regression (
summarize_coxreg)
Analysis tables:
- See a list of all available analyze functions here
- See a list of all available summarize functions here
- See a list of all available column-wise analysis functions here
Many of these outputs are available to be added into teal shiny applications for interactive exploration of data. These teal modules are available in the teal.modules.clinical package.
See the TLG Catalog for an extensive catalog of example clinical trial tables, listings, and graphs created using tern functionality.
tern is available on CRAN and you can install the latest released version with:
install.packages("tern")or you can install the latest development version directly from GitHub by running the following:
if (!require("remotes")) install.packages("remotes")
remotes::install_github("insightsengineering/tern")
Note that it is recommended you create and use a GITHUB_PAT if installing from GitHub.
See package vignettes browseVignettes(package = "tern") for usage of this package.
rtables- table engine usedtlg-catalog- website showcasing many examples of clinical trial tables, listings, and graphsteal.modules.clinical-tealmodules for interactive data analysis
This package is a result of a joint efforts by many developers and stakeholders. We would like to thank everyone who has contributed so far!