
Cards provided by GitHub Readme Stats
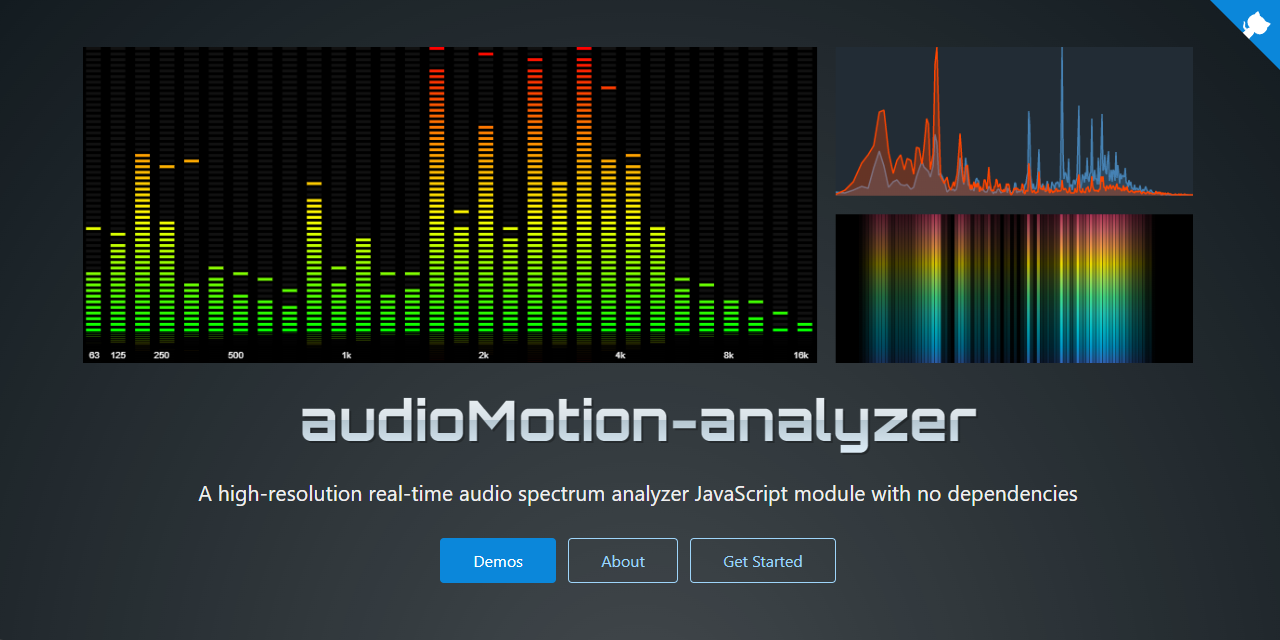
High-resolution real-time graphic audio spectrum analyzer JavaScript module with no dependencies.
Home Page: https://audioMotion.dev
License: GNU Affero General Public License v3.0
Cards provided by GitHub Readme Stats


Hi I tried using "radial: true" and it doesnt work. There is no playback either.
Although FFTs are fine, it gets really boring for me, so the constant-Q transform (actually the variable-Q transform) is preferred over FFT for octave band analysis, but my implementation of CQT (implemented using bunch of Goertzel algorithm) is slow and it needs to use a sliding DFT to do the real-time CQT
I also aware that spectrum analyzers on Web Audio API doesn't need to use AnalyserNode.getByteFrequencyData, you can just use any FFT library and getFloatTimeDomainData as an input just like my sketch does that, but beware you need to window it using Hann window or something before using FFT, see #3
I think perceptual frequency scales like Mel and Bark should be added because the bass frequencies are less shown than logarithmic scale and more shown than linear scale
Hey,
I think those 2 optionals would make sense to be added, wdyt?
Thanks
Chriz
Thank you for creating this wonderful library. I found it yesterday and was up and running it in minutes!
While building a small 3D visualizer, I observed unexpected behavior on mobile (iOS). Debugging on mobile is a little difficult, but it appears like the the values in getBars()are all 0s when called from the onCanvasDraw callback.
I have verified this behavior using the provided No Canvas example codepen, modifying the generated html as a hacky method of debugging on mobile:
const audioMotion = new AudioMotionAnalyzer( null, {
  source: audioEl,
  mode: 2,
  useCanvas: false, // don't use the canvas
  onCanvasDraw: instance => {
    let html = '';
    // shows all zeros on mobile
    for ( const bar of instance.getBars() ) {
      html += bar.value[0].toFixed(1) + ", "
    }
    container.innerHTML = html;
  }
});
For whatever reason, the Using Microphone Input example seems to work as expected on mobile, while the other examples are having issues when playing from other audio sources. Given that the mic stream seems to fine, this may indicate that the DSP is working as expected, but mobile is presenting some issues in streaming from other audio sources.
Hi there! Thank you so much for this amazing library
I was wondering if there's any chance you'd consider including a CommonJS build? I'm running into a lot of issues integrating this library into an existing application (especially with the jest tests) and it would make life a lot easier.
Many thanks in advance!
Hi, hvianna!!!
I'm trying to change the hsl color while the stream is playing! Thank you for your past support! I just need to know how to approach changing the color!
I'm trying to do:
audioMotion.options = {

	// Gradient definitions
		gradients: {
		classic: {
			bgColor: '#000',
			colorStops: [
			 // 'hsl( 0, 100%, 50% )',
			'hsl( 0, 0%, 100% )',

			 // 'hsl( 29, 100%, 50% )',
				hslcolor,
			]
		},
	}
	}
Thank you!
I also tried:
audioMotion.options.gradients {}
I'm trying to access: audioMotion -> options -> gradients
I have a feature request concerning the spectrum.
Would it be possible to make the frequency spectrum configurable between linear and logarithmic representation?
Also, would it be possible to make the bins independently configurable between linear and logarithmic representation?
Currently, I guess both are fixed in logarithmic scale. With this, the visual effect as it is possible in the abadonware MusicScope is not possible, see for example some images here (only the frequency spectrum) and the software as download here.
The setting could be done as in the software SonicVisualizer, see documentation and example here. The bins and the scale (visual) can be set independently.
The main idea for me would be to combine linear bins with logarithmic frequency spectrum visualization so that the bars become equally distributed in the distinct case without loosing and instead increasing the details of the low frequencies. Also the line and area visualization would become clearer in the low frequency area. See for example a YouTube video of MusicScope how this can look here (in the video, the spectrum is set to linear mode, when you download the software yourself, you can click on the text and it changes to logarithmic mode but the bins are linear in both cases as it seems, see the images linked above from that blog post where the spectrum is in logarithmic mode but clearly has linear bins as the low frequencies are high in resolution).
If you have further questions about this, please feel free to ask!
PS: Maybe with linear bins and discrete frequencies, a setting for making the bars wider than 1px is also needed, for example to make them similar to the octave bands representation, or also additional octave bands, such as 1/48th or more? Just some notes if it does not look great from the beginning...
Thank you!
Best regards!
I wanted to know if I could have the same visualization in two different divs?
Hi
audioMotion demos are impressive !
I'm trying to use both https://github.com/alemangui/pizzicato and audioMotion.
I've tested many things (i'm completely new with Web Audio). No luck. My last try was
const el = document.getElementById('container');
const audioMotion = new AudioMotionAnalyzer(el, {});
audioMotion.connectInput(Pizzicato.context.destination);

const soundPath = '/path/to/sound.ogg';
const mySound = new Pizzicato.Sound(soundPath, () => {
    mySound.play();
});
Error
Uncaught DOMException: Failed to execute 'connect' on 'AudioNode': output index (0) exceeds number of outputs (0)
I have no idea how to "connect" Pizzicato with AudioMotion :(
Any help is welcome, thank you !
I have an <audio>-tag. I wanna change the src of that tag. How can audioMotion-analyer pick up this change?
When I try to assing my tag via audioMotion.connectAudio(document.getElementById("audio") I get this error:
Failed to execute 'createMediaElementSource' on 'AudioContext': HTMLMediaElement already connected previously to a different MediaElementSourceNode.
Do I have to "disconnect" something? Reconnect? reload?
My page is a React page and I am very new to the Audio API
I have to "connect" after the instanciation. Analyzer should "pick up" changing tracks.
Here is my complete code (it's a React app):
(I also created a CodeSandbox with the exact code below)
https://codesandbox.io/s/strange-moon-0jjx8?file=/src/MusicList.jsx
Feel free to change whatever it needs.
Thank you very much
import React, { useEffect, useRef, useState } from "react";
import AudioMotionAnalyzer from "audiomotion-analyzer";

import track1 from "./tracks/track1.mp3";
import track2 from "./tracks/track2.mp3";

const tracks = [
  { source: track1, title: "Zimt" },
  { source: track2, title: "Ingwer" }
];

const MusicList = () => {
  const audioRef = useRef(); // will hold the <audio>-tag
  const [track, setTrack] = useState(tracks[1]);

  const changeTrack = () => {
    if (track === tracks[0]) {
      setTrack(tracks[1]);
    } else {
      setTrack(tracks[0]);
    }
  };

  useEffect(() => {
    player = document.getElementById("player");
    analyzer = document.getElementById("analyzer");
    const audioMotion = new AudioMotionAnalyzer(analyzer);

    audioRef.current.volume = 0.05
    audioRef.current.load();
    audioRef.current.play();
    audioMotion.connectAudio(audioRef.current);
    console.log("audioRef", audioRef.current);
  });

  return (
    <>
      <button
        onClick={() => {
          changeTrack();
        }}
      >
        Click to alter track
      </button>
      <audio
        id="player"
        controls
        ref={audioRef}
        src={track.source}
        type="audio"
      />
      <div id="analyzer"></div>
    </>
  );
};
export default MusicList;Hi there!
I'm implementing a new feature in my application that creates and sets a new gradient, with the colors of the album cover of the song you are listening to in Spotify.
In this application, the visualizer options are stored with Redux, meaning I don't have direct control of what the order is of attributes within this object.
To show that the order of attributes in the options object matter, I've created the following codepen based on the Microphone Input demo: https://codepen.io/Staijn1/pen/QWzPNLq
In this codepen you can see two functions that set the gradient property.
One function sets the gradientLeft before the gradient, resulting in both channels being updated.
The other function sets the gradientLeft after the gradient property, resulting in only the right channel being updated because the gradientLeft overwrites the value set by gradient.
I fixed my issue by setting gradientLeft and gradientRight to undefined so they will not interfere, because I can't control the order of attributes due to redux. This would be another solution.
In hindsight this is a pretty obvious issue but it still took me some time. That's why I created this issue to discuss if anything can be done to make this more explicit. Maybe by documenting or extending the API (but I'm not sure what this would look like).
I'd love to hear your thoughts.
Greetings,
Stein
When mobile Safari browser goes on background then audio stops and when it comes to foreground and user hits play audio gets stuck and waveform stops generating
The package is great, works very well.
I was wondering whether it is possible to create a volume level meter.
So a single or dual (stereo) bar display?
Hi,
First of all: great software! I'm implementing this with Lit with a web component that is only added to the DOM if needed.
I have some hacky work-around to bypass having to disconnect on destroy of the component
let audioCtx;
let source;
if (!window._audioCtx) {
          audioCtx = new AudioContext();
          source = audioCtx.createMediaElementSource(window._player);

          // store in memory for reuse
          window._audioCtx = audioCtx;
          window._source = source;
        } else {
          audioCtx = window._audioCtx;
          source = window._source;
        }
Every time I call new AudioMotionAnalyzer() the gain of this chain is increased and it starts clipping. Setting the volume has no effect.
const visualizer = new AudioMotionAnalyzer(canvas, {
          audioCtx,
          source,
});Is there a plug-in for thad or an additional css file?
Thanks so much and congratulation for this AWESOME project
Best regards
It seems that audioMotion is intended to be a permanent component of the Web Audio signal path, and one instance is created and kept for the lifetime of the app. In my case, I already have a player with its own AudioContext, and input and output nodes, and I want to create an audioMotion instance on demand in a modal window, so that when the modal is opened, I connect the output node from my player as the source for audioMotion to analyze the signal. The problem is that audioMotion is connecting its own output to the same AudioContext destination, so both my player, and audioMotion, are sending their outputs to the speakers together, resulting in boosted volume:
(source) ---> player ---> output ---> speakers
                            |
                            +---> analyzer ---> output ---> speakers
As a workaround I can set audioMotion.volume = 0 after creating an instance:
    const audioMotion = new AudioMotionAnalyzer(container, {
        audioCtx: myApp.player.audioContext,
        source: myApp.player.outputNode,
    });

    audioMotion.volume = 0;
Can I suggest adding a boolean connectOutput (default: true) option in the constructor to allow for bypassing the connecting of the output?
I am using this streaming radio service https://www.radiojar.com/
Example: https://mylastore.com/radio
Hi, all I want to do is use it with an internet radio stream.
Could you provide a simple example in JS?
I'm trying to get the source to point to a url stream.
Thank you!
Hi,
first of all thank you for this great tool, really impressing!!
Unfortunately I am experiencing little dropouts (glitches) when listening to music with FFT analysis on my mobile phone (Samsung S22, newest Android version) on browsers like Chrome and even worse on Firefox. Do you have any experience with this?
One interesting thing: The glitches continue, even if I switch off the FFT analysis via toggleAnalyzer(). So it seems to be a problem with the audio node, not with the FFT analysis or the canvas.
Without the Analyser plugin, the music plays smoothly.
Thank you for your help,
Holger
Hi
Can i use the script in a webbrowser locally?
Is there an example file I can look at?
I just want the script to work on audio I play on my computer, using an offlind html file.
Is this possible?
The type definition for GradientColorStop is giving me troubles when trying to define a simple gradient using a string array:
    const gradientOptions = {
      bgColor: '#011a35',
      colorStops: [
        '#dadfff',
        '#f002c7'
      ]
    };
    audioMotion.registerGradient('fsr', gradientOptions);
error TS2345: Argument of type '{ bgColor: string; colorStops: string[]; }' is not assignable to parameter of type 'GradientOptions'.
Types of property 'colorStops' are incompatible.
Type 'string[]' is not assignable to type 'ArrayTwoOrMore'.
Type 'string[]' is missing the following properties from type '{ 0: GradientColorStop; 1: GradientColorStop; }': 0, 1
Edit: Likely due to following type definition in src/index.d.ts:
type ArrayTwoOrMore<T> = {
  0: T
  1: T
} & Array<T>;I've just play around the demo (https://audiomotion.dev/demo/fluid.html), And I think it would be great if it has a copy tooptions object and I can paste the option into my code :)
Dear @hvianna
Good job for this repository.
Do you think you will do :


I have a data model where I can stream all the data from an audio console :
                        {
                            "number": 3,
                            "path": "2.20.3",
                            "_subscribers": {},
                            "identifier": "Main Level",
                            "description": "Main Level",
                            "value": 480,
                            "minimum": -4096,
                            "maximum": 480,
                            "access": 1,
                            "format": "%8.2f°\ndB",
                            "enumeration": "",
                            "factor": 32,
                            "isOnline": true,
                            "default": -1024,
                            "type": 1,
                            "streamIdentifier": 281904
                        }
Do you think I could link your audio motion analyser with my data model ?
Best Regards,
Youssef
I want to use the library in my vue js project. I need the 1/12 octave bands get generated out of the fft data, but I'm going to visualize them with reactive svg. So I just need the bars on evey onCanvasDraw, but I don't need a canvas.
I'm using it in a composable function, so I don't want to create a hidden canvas. Is there an option to totally omit canvas?
So we can use the lib as simple as that:
  const audioMotion = new AudioMotionAnalyzer(null, {
    source: chain.analyse,
    onCanvasDraw: analyse,
  })

  function analyse(AM) {
    state.bars = AM.bars  // state is reactive and is the carrier to get the data to the UI
  }
Now everything works fine, thank you so much for develop this tool. Its great no doubts.
Can you construct the audioCtx whitout Logarithmic graphs? The thing is include Linear mode, and i can help if is neccesary.
Whenever I try to get audio from a stream, there is awful feedback which made this unusable.
I recreated this problem on this sandbox.
You'll need to make sure you select "Share Audio" in the popup.
I managed to fix it for my use case by removing line 91 -
this._analyzer.connect( this._audioCtx.destination );
but I'm sure this would have broken some other use case.
I'm far from an expert when it comes to the audio API but it looked like we were feeding the audio back into itself?
There wasn't much really any examples for integrating with streams in the docs as well, so it would have been great if we had a stream implementation example in the docs.
Thank you very much for the work you've done one this by the way. It's sure to make my life easier!
how can enable fluid feature (https://audiomotion.dev/demo/fluid.html)
Hello, I'm trying to use a stereo microphone with chrome (on my mac I created an aggregate of the two entries of my sound interface).

I wanted to know if, if I manage to get a stereo stream from my two microphones inside chrome, could I use it with createMediaStreamSource to handle this stereo stream as if I was passing a stereo track from my computer?
Right now I have not found much about handling a stereo microphone source. Is there a limitation somewhere?
Thank you so much for your library it is life changing!
Hi,
Great Project I must say! I wanted to ask if we can connect multiple audio elements to the visualizer, or maybe the final AudioDestinationNode of the speaker? I want the visualier to be a sum of all the media (including videos) running on the website.
Thanks
Hi,
Im getting the following error:
this.getRawSourceNode is not a function
Thank you!
I cannot understand what's going on here. When I use a
bun and vite and I run the project using bunx --bun viteThanks for the help!
here are my files to reproduce:
index.html
<!doctype html>
<html lang="en">

<head>
  <meta charset="UTF-8" />
  <script type="module" src="/main2.js"></script>
</head>

<body>
  <span id="ai"></span>
</body>

</html>
my main2.js
import AudioMotionAnalyzer from "audiomotion-analyzer";
let ai = document.getElementById("ai");
if (ai) {
  const audioMotion = new AudioMotionAnalyzer(ai);
}
and my package.json
{
  "name": "neocertif",
  "private": true,
  "version": "0.0.1",
  "type": "module",
  "scripts": {
    "dev": "bunx --bun vite",
    "build": "bunx --bun vite build",
    "preview": "vite preview"
  },
  "devDependencies": {
    "vite": "^5.2.0"
  },
  "dependencies": {
    "@codemirror/lang-python": "^6.1.6",
    "audiomotion-analyzer": "^4.4.0",
    "codemirror": "^6.0.1",
    "prismjs": "^1.29.0"
  }
}Hi there,
questions about the y-scale when
        mode: 6,
        alphaBars: false,
        ansiBands: true,
        barSpace: .5,
        channelLayout: 'single',
        colorMode: 'gradient',
        frequencyScale: 'log',
        gradient: 'classic',
        ledBars: true,
        lumiBars: false,
        maxFreq: 20000,
        minFreq: 25,
        mirror: 0,
        radial: false,
        reflexRatio: 0,
        showBgColor: true,
        showPeaks: true,
        trueLeds: true,
        showScaleY: true,
        minDecibels: -85,
        maxDecibels: 0
I have song that peaks around 0dBFS all the time.
With the given settings above the meter peaks at around -20dB.
I was wondering what exactly the y-axis displays? Is this Peak or like a LUFS ?
How can I configure the scale so it actually displays the actually peak value of like 0dBFS?
Thanks for your help,
Moz
In the fluid demo I noticed roundBars does not work when in radial mode.
I selected half octave / 20 bands mode, enabled round bars (working) and then enabled radial. Then the bars are no longer rounded.
Is this by design?
Version: 3.5.0
Last known working version: 3.3.0
When using audiomotion-analyzer in an angular project, running dist to pack for production fails with the following error.
`ERROR in node_modules/audiomotion-analyzer/src/index.d.ts:53:23 - error TS1005: ',' expected.
53 hold: [ mono_or_left: number, right?: number ];`
Reverted to 3.3.0 and it is working fine.
I'm still learning about this great tool and got stuck. I tried following the instructions but always got a black background. I really want to make it alpha.
Thanks
Hi,
I would like to be able to customize the look of the leds by replacing them with a single image (jpg, png, etc...).
Thank you!
Hi,
I was running into an issue today where the element I wanted the visualizer in was not loaded yet.
I did not receive an error, it just didn't work.
So I went into the sourcecode and saw in the constructor:
this._container = container || document.body;
I am wondering if this is the best way to handle this, because in my environment (angular) it didn't put the visualizer in the body, but also didn't throw an error.
It may be easier to just throw an error because if, for some reason, you want the visualizer in the body element you can always get the element yourself.
I can create a pull request for it, because it ain't hard to implement, but I wanted to discuss it first if this is desired.
Greetings,
Staijn
Is there any way that the precision/detail of the ScaleX could be adjustable to make it more precise/detailed? For example, if a frequency range of 20 kHz to 22 kHz is used in order to zoom in on the ultrasonics, currently the most precise/detailed mode is linear, but the markers jump from 20 kHz to 22 kHz and does not display anything in between. Is there a way to increase the frequency of markers to, for example, every 100 Hz, instead of every 2 KHz, when linear mode is being used?
Also, I know that 20 kHz to 22 kHz is not a range currently available in the tool, as the lowest lower limit is currently 16 Hz. However, modifying that is not an issue. I'm just having a problem modifying the precision/detail of the ScaleX.
After stopping the use of the microphone, in Chrome, the mic icon stays on. This happens in my project and the examples on the websites as well. A solution is to also close the microphone track that is open when disconnecting.
An example solution is to add an option to the disconnect method to optionally close the track. This made the icon go away when used and should be backward compatible for anyone still needing it to not be closed when disconnecting.
/**
	 * Disconnects audio sources from the analyzer
	 *
	 * @param [{object|array}] a connected AudioNode object or an array of such objects; if undefined, all connected nodes are disconnected
	 * @param {boolean} [stopTracks] if true, stops the track when disconnected
	 */
	disconnectInput( sources, stopTracks ) {
		if ( ! sources )
			sources = Array.from( this._sources );
		else if ( ! Array.isArray( sources ) )
			sources = [ sources ];
		for ( const node of sources ) {
			const idx = this._sources.indexOf( node );
			if (stopTracks && node.mediaStream){
				for ( const ats of node.mediaStream.getAudioTracks() ){
					ats.stop();
				}
			}
			if ( idx >= 0 ) {
				node.disconnect( this._input );
				this._sources.splice( idx, 1 );
			}
		}
	}
Naturally can still be called with default sources:
audioMotion.disconnectInput(false, true);
Hi,
The following stream does not play at all.
http://stream.syntheticfm.com:8040/stream
However it does work with a regular html5 audio player.
Thank you!
Hi, I wanted to know if could support the following program:
https://github.com/eshaz/icecast-metadata-js
Im trying to combine them, but Im having some issues.
Thank you!
Would it be practically possible to use the analyzer/visualization with an already existing FFT stream, which by the way is not necessarily audio, but other spectrum data.
It seems like the AudioConcext and the build in FFT is an integral part of the library.
Hi, I'm getting the following error on Google Chrome:
"Uncaught (in promise) DOMException: The play() request was interrupted by a new load request"
It won't play after I click the button. I'm forced to go site:settings on chrome to enable audio. However the stream URLs play if I don't use AudioMotion Analyzer.
It only happens on google chrome. Is there a fix or workaround I can try?
Thank you!
Hi, I would like to see an option to "mirror" the analyzer either left or right. By "mirror" I mean duplicate the analyzer horizontally. For symmetry.
Thank you so much!
A dynamic gradient like in WhiteCap visualizer (like changing colors based on magnitude of the FFT, the current time, the center frequency for each band, or even stereo differences) would be cool (especially on spectrogram displays), but here's a caveat, setting colors for each frequency band can only apply to frequency bars display, but it can be easily done using color gradients that change over time, which works best on linear spectrum.
As for the spectrogram display, I prefer the showcqt-style spectrum/spectrogram display (where the top is the spectrum and the bottom is spectrogram) and I think it pairs well with dynamic gradients.
I'd like to see combined channel spectrum display, because I think it is easier to see stereo differences simply based on different colors for each channel.
ERROR TypeError: Failed to execute 'setTransform' on 'CanvasRenderingContext2D': 6 arguments required, but only 0 present.
    at AudioMotionAnalyzer._draw (audioMotion-analyzer.js:910)
    at audioMotion-analyzer.js:501
    at ZoneDelegate.invokeTask (zone.js:421)
    at Object.onInvokeTask (core.js:28183)
    at ZoneDelegate.invokeTask (zone.js:420)
    at Zone.runTask (zone.js:188)
    at ZoneTask.invokeTask (zone.js:503)
    at ZoneTask.invoke (zone.js:492)
    at timer (zone.js:3034)
Original report: hvianna/audioMotion.js#12
Not sure if this is possible, but it would be interesting if you could create a real time filter, which allowed you to isolate a selected band and send it to either a file (for later playback) or an output device (sound card).
for example a function setAudioFilterIndex() which takes an integer to indicate which band to pass to the output (or null/undefined to indicate it should pass the unfiltered input to the output - the default situation)
getAudioFilterIndex() would return the current value
Hi,
Can we draw frames of the audio visualizer and let it stay on that? I am trying to export the audio visualizer as a video file. For that, I need the ability to seek the audio visualizer at particular times and wait so that I can capture a screenshot. I can see there is an onCanvasDraw callback, however, is there any way to make it draw the visualizer with the exact preset that I have set on audiomotion object?
Add the option to create the 1/nth octave bands based on the ISO/ANSI preferred frequencies.
Original request by Jonathan Annett.
A declarative, efficient, and flexible JavaScript library for building user interfaces.
🖖 Vue.js is a progressive, incrementally-adoptable JavaScript framework for building UI on the web.
TypeScript is a superset of JavaScript that compiles to clean JavaScript output.
An Open Source Machine Learning Framework for Everyone
The Web framework for perfectionists with deadlines.
A PHP framework for web artisans
Bring data to life with SVG, Canvas and HTML. 📊📈🎉
JavaScript (JS) is a lightweight interpreted programming language with first-class functions.
Some thing interesting about web. New door for the world.
A server is a program made to process requests and deliver data to clients.
Machine learning is a way of modeling and interpreting data that allows a piece of software to respond intelligently.
Some thing interesting about visualization, use data art
Some thing interesting about game, make everyone happy.
We are working to build community through open source technology. NB: members must have two-factor auth.
Open source projects and samples from Microsoft.
Google ❤️ Open Source for everyone.
Alibaba Open Source for everyone
Data-Driven Documents codes.
China tencent open source team.