guokai8 / microbial Goto Github PK
View Code? Open in Web Editor NEWDo microbiome analysis with dada2 and phyloseq object
License: GNU General Public License v3.0
Do microbiome analysis with dada2 and phyloseq object
License: GNU General Public License v3.0


Hi Kai,
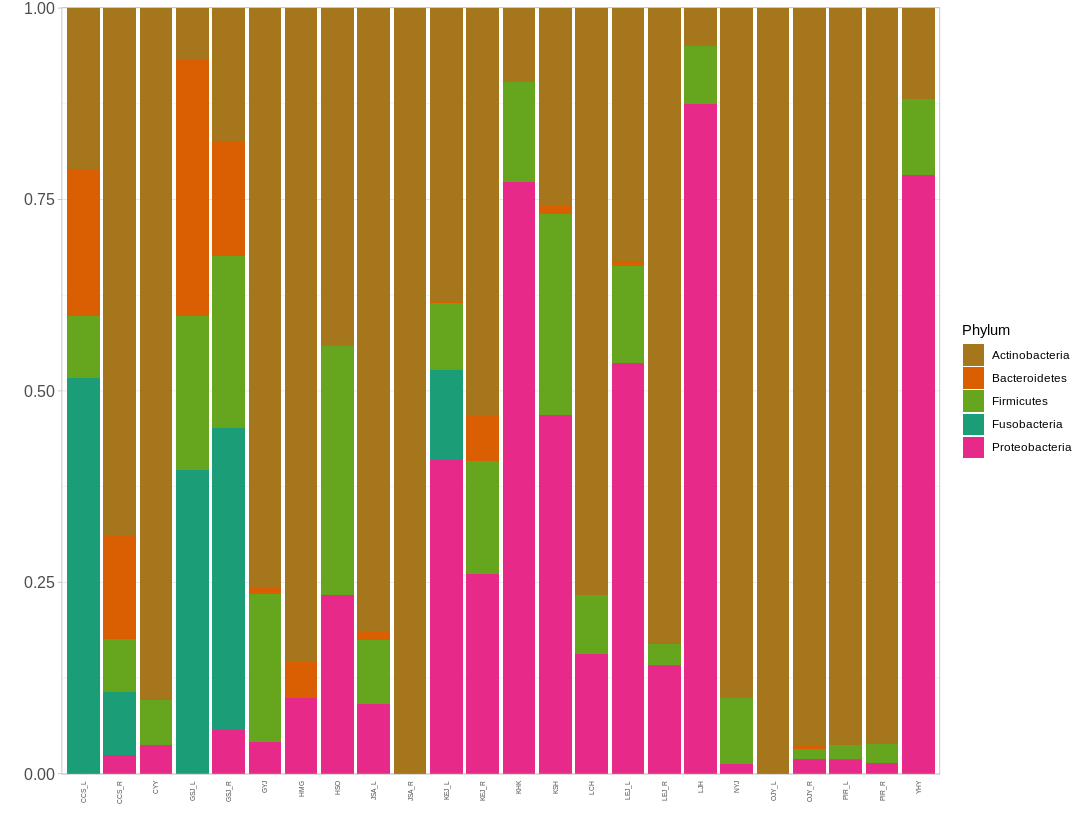
I need help in rearranging samples in the results of my taxonomy plot based on groups and relative abundance.
I used this script and produce this:
plotbar(norm,level="Phylum")
I want to reorder my samples like this:
sampleorder <- c(Control=c("YHY", "LJH", "KSH", "HSO", "LCH", "KHK", "HMG", "GYJ", "NYJ", "CYY"),(Patient=c("GSJ_R", "GSJ_L", "JSA_R", "OJY_L", "OJY_R", "CCS_L", "CCS_R", "PIR_R", "LEJ_L", "JSA_L", "LEJ_R", "KEJ_R", "KEJ_L", "PIR_L")))
Thanks
James
Hi Kai,
I get this error whenever I try these scripts in R:
ps
phyloseq-class experiment-level object
otu_table() OTU Table: [ 1052 taxa and 24 samples ]
sample_data() Sample Data: [ 24 samples by 2 sample variables ]
tax_table() Taxonomy Table: [ 1052 taxa by 8 taxonomic ranks ]
pp <- ldamarker(ps, pvalue = 0.05, normalize = TRUE, method = "relative")
Normalization using relative method
Error in$<-.data.frame(*tmp*, "tax", value = character(0)) :
replacement has 0 rows, data has 25248
May I ask some advice on how to resolve this.
Thanks
James
Thanks for providing this package.
I am trying to use it for plotting LDA.
The res table that I get from the function successfully, but when I use:
res <- ldamarker(ps_1,group="breastfeeding_group")
head(res,10)
# A tibble: 10 x 13
# Groups:   rank, tax [10]
   rank  tax      statistic p.value parameter method   p.adj `exclusive brea… `non-exclusive …   max
   <chr> <chr>        <dbl>   <dbl>     <int> <chr>    <dbl>            <dbl>            <dbl> <dbl>
 1 Class D_0__Ar…    1.00   0.316           1 Kruskal… 0.739              NA               NA    NA
 2 Class D_0__Ba…    0.184  0.668           1 Kruskal… 0.872              NA               NA    NA
 3 Class D_0__Ba…    1.13   0.288           1 Kruskal… 0.739              NA               NA    NA
 4 Class D_0__Ba…    1.31   0.253           1 Kruskal… 0.739              NA               NA    NA
 5 Class D_0__Ba…    0.0412 0.839           1 Kruskal… 0.955              NA               NA    NA
 6 Class D_0__Ba…    2.28   0.131           1 Kruskal… 0.626              NA               NA    NA
 7 Class D_0__Ba…    7.41   0.00649         1 Kruskal… 0.287             406.            1861. 1861.
 8 Class D_0__Ba…    3.83   0.0504          1 Kruskal… 0.510              NA               NA    NA
 9 Class D_0__Ba…    0.169  0.681           1 Kruskal… 0.872              NA               NA    NA
10 Class D_0__Ba…    0.144  0.704           1 Kruskal… 0.876              NA               NA    NA
# … with 3 more variables: min <dbl>, LDAscore <dbl>, direction <chr>
plotLDA(res,group=c("exclusive breastfeeding","non-exclusive breastfeeding"),lda=5,pvalue=0.05)
The plot that generated is blank, only has a x-axis label.
Could you help me to address it ?
Thanks!
plotLDA(res,group=c("week_1","week_4", "week_24"),lda=2, pvalue=0.05)
Error: Insufficient values in manual scale. 3 needed but only 2 provided.
Is it possible to plot LDA for more than 2 groups?
Thanks
Hi! I wanted to know what these values are in the output table from ldamarker, I cant seem to find it anywhere in the documentation:
statistic, min and max.
Thank you!
Salma
I have sub-grouped the LDA plots by taxonomic level. However, I would only like to have the last rank name on the plot (e.g. phylum, genus etc) rather than the full string from Kingdom down.
I am struggling to manipulate the tax object to do this as it is a long string. Is there any chance there is an easy solution to this issue?
Thank you!
Susanne
Hi Kai
How do I cite the microbial package in the paper ?
Hesham
res <- ldamarker(ps.nonc.nocyano,group="SampleType")
Normalization using relative method
|========================================================================================================= |100% ~0 s remaining Error in$<-.data.frame(*tmp*, "direction", value = c("PFH", "SUH" :
replacement has 2 rows, data has 1
plotLDA(res,group=c("CFH","SUH"),lda=5,pvalue=0.05)
Error in subset(x, LDAscore > lda) : object 'res' not found
A declarative, efficient, and flexible JavaScript library for building user interfaces.
🖖 Vue.js is a progressive, incrementally-adoptable JavaScript framework for building UI on the web.
TypeScript is a superset of JavaScript that compiles to clean JavaScript output.
An Open Source Machine Learning Framework for Everyone
The Web framework for perfectionists with deadlines.
A PHP framework for web artisans
Bring data to life with SVG, Canvas and HTML. 📊📈🎉
JavaScript (JS) is a lightweight interpreted programming language with first-class functions.
Some thing interesting about web. New door for the world.
A server is a program made to process requests and deliver data to clients.
Machine learning is a way of modeling and interpreting data that allows a piece of software to respond intelligently.
Some thing interesting about visualization, use data art
Some thing interesting about game, make everyone happy.
We are working to build community through open source technology. NB: members must have two-factor auth.
Open source projects and samples from Microsoft.
Google ❤️ Open Source for everyone.
Alibaba Open Source for everyone
Data-Driven Documents codes.
China tencent open source team.