Code Monkey home page Code Monkey logo

public-information-map-template-js's Introduction

ArcGIS Configurable Apps will be retired in 2025. The ArcGIS Configurable Apps source code repro is deprecated and will not receive further updates. In addition, this repository will be removed in October 2025, along with the October 2025 ArcGIS Online update.

Deprecated: public-information-map-template-js

App

This is a fully configurable public facing mapping application that highlights areas through authoritative data feeds and social content, allowing the public to tell a story.

View it live

The template can be configured using the following options:

  • Map: Choose the web map to use in your application.
  • Interactive: Map Notes: An author can describe areas on the map using a map notes layer.
  • Responsive: A side drawer is shown when its size can be accommodated. The responsive drawer can be toggled on or off by the user and allows the application to be embedded into blogs and websites.
  • Navigation: Home and Locate buttons add ease of map navigation.
  • Content: Choose to display geo-located content from Flickr, Twitter, Instagram or Webcams.travel.
  • Summary: Briefly describe your application in the "Area" panel.
  • Keywords: Use query keywords to search on Flickr or Twitter.
  • Search: Enable Searching for addresses and places.
  • Share: Share this application through Twitter, Facebook, Google+ or generate HTML for embedding in a blog or website.
  • Basemap: Enable toggling between two Esri basemaps.
  • Layers: Toggle visibility of layers.
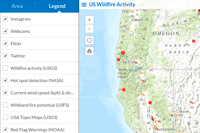
  • Legend: Display a legend.
  • Bookmarks: Webmap bookmarks can be used to navigate the map.
  • About: Display information about the application. The dialog can also be set to open on startup.
  • Access and Use Constraints: Display Access and Use Constraints for the webmap in a pop-up dialog when the map opens.

Instructions

  1. Download and unzip the .zip file or clone the repository.
  2. Web-enable the directory.
  3. Access the .html page.
  4. Start writing your template!

New to Github? Get started here.

Deploying

  1. To deploy this application, download the template from Portal/ArcGIS Online and unzip it.
  2. Copy the unzipped folder containing the web app template files, such as index.html, to your web server. You can rename the folder to change the URL through which users will access the application. By default the URL to the app will be http://<Your Web Server>/<app folder name>/index.html
  3. Change the sharing host, found in defaults.js inside the config folder for the application, to the sharing URL for ArcGIS Online or Portal. For ArcGIS Online users, keep the default value of www.arcgis.com or specify the name of your organization.
  • ArcGIS Online Example: "sharinghost": "https://" + “<your organization name>.maps.arcgis.com
  • Portal Example where arcgis is the name of the Web Adaptor: "sharinghost": "https://" + "webadaptor.domain.com/arcgis"
  1. If you are using Portal or a local install of the ArcGIS API for JavaScript, change all references to the ArcGIS API for JavaScript in index.html to refer to your local copy of the API. Search for the references containing "https://js.arcgis.com/3.35" and replace this portion of the reference with the url to your local install.
  • For example: "https://webadaptor.domain.com/arcgis/jsapi/jsapi" where arcgis is the name of your Web Adaptor.
  1. Copy a map or group ID from Portal/ArcGIS Online and replace the default web map ID in the application’s index.html page. You can now run the application on your web server or customize the application further.

Note: If your application edits features in a feature service, contains secure services or web maps that aren't shared publicly, or generate requests that exceed 200 characters, you may need to set up and use a proxy page. Common situations where you may exceed the URL length are using complex polygons as input to a task or specifying a spatial reference using well-known text (WKT). For details on installing and configuring a proxy page see Using the proxy. If you do not have an Internet connection, you will need to access and deploy the ArcGIS API for JavaScript documentation from developers.arcgis.com.

Social Media Deployment

In order to use some of the social media feeds on a different server, you'll need to get your own user keys for your app and in some cases deploy a proxy in order to correctly connect.

You'll need to point these values to the sign in URL and query URL of the proxy.

Flickr Configuration

You'll need to obtain your own unique key from the Flickr API

Then, enter it in the config as flickr_key.

Instagram Configuration

You'll need to obtain your own unique Instagram client ID key from the Instagram API

Make sure to enter all valid redirect URI's in the instagram security panel so that your app can connect to their servers.

Then, enter it in the config as instagramClientId.

Twitter Configuration

Since the Twitter search API doesn't support user authentication using oAuth2, we need to use oAuth 1.1 which requires the keys to be stored server side for security. Therefore, we need to create a Twitter proxy that will keep the keys secret and allow us to query information through the Twitter Search API.

Proxies:

Once the proxy is setup, you'll need to point the user config to the location of the signin url and twitter url.

The config values are:

  • twitterUrl
  • twitterSigninUrl

Then, you'll need to get an API key from the Twitter API. Once you have that, plug the details of it into the proxy configuration.

Webcams.travel Configuration

You'll need to obtain your own unique Webcams.travel key from the Webcams.travel API

Then, enter it in the config as webcams_key.

YouTube Configuration

You'll need to obtain your own unique API key from the YouTube API

First, you'll have to enable the "YouTube Data API v3" so that it can be used by your application.

You'll want to create an API use key for "YouTube Data API v3" and set credentials on it to restrict traffic from only the domain where your application will be hosted. For example, we use ".arcgis.com/".

Then, enter it in the config as youtube_key.

Requirements

  • Notepad or HTML editor
  • A little background with Javascript
  • Experience with the ArcGIS Javascript API would help.

Webfonts

This application uses a custom webfont created on Fontello. If you're hosting this application on your own server, make sure that it's configured to host the webfont files with the correct mime types. Some servers require a mime type set for these files to be able to serve them correctly. See the following URLs for more information. There is a zip archive of the webfont with it's fontello config in the "resources" folder in this repository.

Resources

Issues

Find a bug or want to request a new feature? Please let us know by submitting an issue.

Contributing

Anyone and everyone is welcome to contribute. :)

Licensing

Copyright 2012 Esri

Licensed under the Apache License, Version 2.0 (the "License"); you may not use this file except in compliance with the License. You may obtain a copy of the License at

http://www.apache.org/licenses/LICENSE-2.0

Unless required by applicable law or agreed to in writing, software distributed under the License is distributed on an "AS IS" BASIS, WITHOUT WARRANTIES OR CONDITIONS OF ANY KIND, either express or implied. See the License for the specific language governing permissions and limitations under the License.

A copy of the license is available in the repository's license.txt file.

public-information-map-template-js's People

Contributors

driskull avatar joalvarez avatar kellyhutchins avatar sverkeresrise avatar

Stargazers

 avatar  avatar  avatar  avatar  avatar  avatar  avatar  avatar  avatar  avatar  avatar  avatar  avatar  avatar  avatar  avatar  avatar  avatar  avatar  avatar  avatar  avatar  avatar  avatar  avatar  avatar  avatar  avatar  avatar  avatar  avatar  avatar  avatar  avatar  avatar  avatar  avatar  avatar  avatar  avatar  avatar  avatar  avatar  avatar  avatar  avatar  avatar  avatar  avatar  avatar  avatar  avatar  avatar  avatar  avatar  avatar  avatar  avatar  avatar  avatar  avatar  avatar  avatar  avatar  avatar  avatar  avatar  avatar  avatar

Watchers

 avatar  avatar  avatar  avatar  avatar  avatar  avatar  avatar  avatar  avatar  avatar  avatar  avatar  avatar  avatar  avatar  avatar  avatar  avatar  avatar  avatar  avatar  avatar  avatar  avatar  avatar  avatar  avatar  avatar  avatar  avatar

public-information-map-template-js's Issues

Bit.ly Copy and paste on mobile when wrapped in app

iphone5 Safari: When I click on the share and try to copy/paste the bit.ly link
image

Here is the copy / paste

{\rtf1\ansi\ansicpg1252
{\fonttbl\f0\fswiss\fcharset0 Helvetica;}
{\colortbl;\red255\green255\blue255;\red119\green119\blue119;\red255\green255\blue255;}
\deftab720
\pard\pardeftab720\partightenfactor0

\f0\fs28 \cf2 \cb3 \expnd0\expndtw0\kerning0
\outl0\strokewidth0 \strokec2 http://bit.ly/1u39NDe}

Here is the actual bit.ly http://bit.ly/1uUBT49

When I share via email - it correctly adds the bit.ly.

No prompt for authentication for non-public map

Noticed that when setting this up as a map template, the map it is using needs to be public, or the map will never load and it will continue to spin. The authentication prompt never gets displayed.

Enter coordinates - pan with no zoome

When I enter these coordinates into the search I get a pan but no zoom or indicator of the location.

-119.923, 38.284

It should probably at least add a pin to the map?

Only show elements in the legend that appear in the map

For example, if you have 25 incident types define in a layer it get's really confusing when that data doesn't show in the map.

This is feedback we received from City of Boulder, West Douglas Fire District, and the USGS.

Swipe layer label?

It is not always clear to the end user what they are swiping

image

Would it be possible to add a little label or lightbox when the map loads?

"Use this swipe tool to show/hide the Fire-related Weather Warnings"

Share extent issue when basemap is other than WebMeractor or WGS84 (4326)

When this template is used with a web map that has a basemap with another coordinate system than Web Mercator (EPSG:3857) or WGS84 (EPSG:4326), a javascript error will appear stating that "Cannot read property xmin of undefined".

From what I can tell, the reason for this is the code on line 254 in the file js/ShareDialog.js where it tries to get the map.geographicExtent, which according to the API is only available for maps with WebMercator or WGS84 spatial reference:
https://developers.arcgis.com/javascript/3/jsapi/map-amd.html#geographicextent

Uncaught TypeError: Cannot read property '3' of null

Clicked on sample link: http://esri.github.io/public-information-map-template-js/ and webpage gets stuck on loading splash screen. Opened up developer tools and clicked on the console tab and found this.

Uncaught TypeError: Cannot read property '3' of null
    at new k (init.js:457)
    at Object.b.urlToObject (init.js:724)
    at Object._sanitizeUrl (init.js:2008)
    at Object.getCredential (init.js:1993)
    at Object.checkAppAccess (init.js:2000)
    at Object.checkSignInStatus (init.js:1999)
    at Object._checkSignIn (template.js:299)
    at Object._init (template.js:123)
    at Object.startup (template.js:84)
    at (index):139

Any ideas on how to fix?


Panels Displaying Incorrectly in Firefox/IE

Hi, I just noticed that the Panels tab (Legend, About, Layers) and the text inside of them and title panel are not displaying properly in Firefox nor Internet Explorer. Parts of text of the words are missing. The web maps look fine in Chrome. I'm using Firefox 31 and IE 9 on Windows 7.

I noticed this on both maps I've made and on the sample map here: http://esri.github.io/public-information-map-template-js/.

See screenshot of missing text:

publicinfo.

Sample map:
pi_wildfire

Can someone address this issue? Thanks.

not in full screen

i created a very Simple aplication for show a map by javascript api
when i open the page in restore down mode in my browsers i have no problem.
but when i open it on maximize mode the map loads just on the half of page.
can any body help me?
this is my code:
`

<title>test</title>
<meta http-equiv="Content-Type" content="text/html; charset=utf-8">

<meta name="viewport" content="initial-scale=1, maximum-scale=1,user-scalable=no">
<script type="text/javascript" src="http://localhost/arcgis_js_api/library/3.15/3.15/init.js"></script>

<script>
require ([
      "esri/map", "esri/dijit/Scalebar", 
  "esri/layers/ArcGISDynamicMapServiceLayer",
      "dojo/domReady!"
], function(
    Map, Scalebar, ArcGISDynamicMapServiceLayer
) {


        var map1 = new esri.Map("mapDiv", {logo:false});
    var basemap = new ArcGISDynamicMapServiceLayer("http://localhost:6080/arcgis/rest/services/MyMapService3/MapServer");
    map1.addLayer(basemap);


        var scalebar = new Scalebar({
              map: map1,
              scalebarUnit: "dual"
            });

        }
    );
</script>
`

Social Media in the PIM

Hey @driskull
I was working with the PIM and I turned on Istagram Twitter and Flicker for a day. As you can see the social media is covering everything on my map. It would be nice if I could drag the social media, lower in my layers so I could see the features that under the feeds.
pim w social media

Template Idea

Widget or template that allows exporting data from a webmap with layers.
Select layers you want to download data for, select an area, select output formats.

Better as a template that would do the export.

Splash screen formatting issues

It seems like the splash screen could use some design enhancements or perhaps just use a similar framework to the Web AppBuilder Splash widget? This is important because it is the first impression the Public has of an agency map.

Notice below the X and the outline around it overlaps with the title.
image

Instagram Access Token

Hello,

I deployed the Public Information Map on our dev webserver and am having issues with the Instagram Layer. In the Chrome Dev tools, I get the message that the Access Token is not being accepted. I have gone to Instagram's site and generated a new one. My question is, where do I put it in the Map?

Thanks!

Proxy Question

Does anyone have any suggestions on properly setting up the proxy for deploying the PIM? I've successfully deployed numerous wabs using the proxy, but I'm having a heck of time getting it to work with this template. I've added my proxy url to the default.js and added the following code to my templateConfig.js, but no dice....still getting prompted for my AGO creds.

urlUtils.addProxyRule({
urlPrefix: "organization.maps.arcgis.com",
proxyUrl: "http://URL/proxy.ashx"
});

Any guidance or examples would be appreciated.

Thank you,

Bill

Basemap Widget does not use Organization's Basemap Group

Today @LaurenMcArtney and myself are building a demonstration and it appears that the Public Information template does not "hydrate" from my ArcGIS Online organization Basemap GroupIn other words, only the Esri Default basemaps show up in the application builder.

image

image

image

This is important because here in New Zealand we use local content and projection for all of our basemaps as a best practice. Is this is a bug or by design?

Number of views

I think when it comes to Public Maps, some audiences like to know the number of views a map has received. Perhaps we could add this in on the About page?

image

Twitter API places

Hey ESRI team,

We’re writing to inform you of some changes we are implementing over the next few months in order to improve the user experience when Tweets are created with location data. Some of these changes should be visible in the Twitter UI and have an effect on the Tweet payload starting today.

You may have noticed recent changes to the Twitter UI allowing a user to geotag their Tweet using venue data powered by Foursquare. If a user selects the Foursquare powered venue when Tweeting, the “place” section of the Tweet data payload will include the venueID, place name, and lat/long coordinates of the venue. This has significant benefits for data consumers. Place data can now be used to associate individual Tweets with specific venues. In addition, the lat/long coordinates of these venues are much more specific than the lat/long bounding boxes provided with the previous place types--neighborhood, city, or country. These non-venue places will still be available for selection in the UI and the resulting place data in the payload will be unchanged.

We are working on other improvements to the user experience when Tweeting with location to keep that experience consistent with our users’ expectations. As a part of these changes, the number of Tweets with the “coordinates” payload element, which is a lat/long associated with a Tweet and not a place, is expected to decrease significantly. This specific change will begin to roll out in late April. We don’t expect this change to cause any decrease in the overall number of Tweets with "place" data, including the lat/long coordinates defining the place bounding box.

All of these payload changes are backward compatible and will not result in any changes to the structure of the Tweet payload. You can view a sample payload of a Tweet associated with a venue to better understand these changes.

Please let me know if you have any questions regarding these changes.

YouTube API v3

Dear YouTube Developer,

You are receiving this email because your address is associated with a project that has recently accessed the YouTube Data API (v2), which will soon be shut down. Please disregard this message if you're not associated with such a project. There won't be any further emails.

In March 2014, we announced that the v2 API would be retired on April 20, 2015, and would be shut down soon thereafter. To help you with your migration, we published the migration guide in September. Now, we'd like to provide you with more details on the v2 retirement timeline.

As of April 20, 2015, v2 API endpoints will be shut off with the following exception: We will keep the v2 versions of the comments, captions, and flagging features accessible for a grace period past the shutdown date. These features are still listed as "To be supported" in the migration guide. The grace period is designed to give you time to implement the new v3 versions of these features as they become available. In addition, the v2 API endpoint for uploading videos will also remain open during this time.

If you would like to test your application's reaction to the v2 API shutdown, point it to eol.gdata.youtube.com instead of gdata.youtube.com.

Please migrate your app to the YouTube Data API v3 at your earliest convenience to avoid any outage.

For more information please visit: YouTube Data API v2 Turndown FAQ.

If you have any questions about the YouTube Data API v2 turndown, you can reach us via the this support form.

Regards,

The YouTube API Team

Videos in popups via Google Chrome for the Public Information Template causes locked panning anomaly

(This question also posted in ESRI forum: https://geonet.esri.com/thread/113761)

The problem:
A colleague of mine had asked me to help out on a map he designed. We have an augmented ESRI map template that provides live traffic video feeds via an iframe embedded popup. When viewed in Internet Explorer (version 10) and Firefox (version 31) the map and popups work as desired. However in Google Chrome (version 37), after clicking on and closing two, maybe three, of the camera locations and getting the popups, the map locks in the pan mode. The only way to get out of the locked pan is to refresh the browser window.

The map:
Our map is found here: http://geodata.md.gov/ospreypublic/
And it is an augmented form of the ESRI Public Information Map:
http://solutions.arcgis.com/emergency-management/help/public-information/
https://github.com/Esri/public-information-map-template-js

What’s involved:
The mapping application utilizes this webmap: http://www.arcgis.com/home/item.html?id=af0bd454bd524202bfc6963665060f49
The popup for the live traffic video feeds utilizes this REST service: http://geodata.md.gov/appdata/rest/services/OspreyPublic/TrafficCameras/MapServer/0
using the “iframe” field.

Here is a sample value from the “iframe” field:
"iframe": "\u003ciframe width="481" height="361" src="http://www.chart.state.md.us/video/videoshare.asp?feed=c1ff9c0c00a100ab0050fa36c4235c0a\" frameborder="0" allowfullscreen\u003e\u003c/iframe\u003e"
It is being called into play via webmap.js in “mediaInfos” under “popupInfo” as
"description": "{iframe}"
for the TrafficCameras map service.

The video stream:
The video stream uses JW Player 6.6 and the streams originate from here:
http://www.chart.state.md.us/TravInfo/trafficcams.php

Some source code for the map:
http://geodata.md.gov/ospreypublic/webmap.js
http://geodata.md.gov/ospreypublic/js/main.js
http://geodata.md.gov/ospreypublic/css/popup.css

What I’ve done:
I’ve searched the web for some solutions. Most notably, after a while I came across this link:
https://geonet.esri.com/thread/101650
and this one:
https://geonet.esri.com/message/64744#64744
Both links mention very similar issues that I’ve encountered and both have commentary that point to a possible bug in Google Chrome.
I’ve have tried some workarounds.
• Changing the iframe in the field value description to or or even doing a

<iframe>, the latter being a matter of desperation.
• Making adjustments to sizing, padding, margins, left, top, height, width for the iframe in the popup.css file. (Sometimes sizing of enveloping elements in CSS can throw things off.)

Some ideas:
I’ve seen some sites saying there are issues with embedded iframes but I did try having an iframe without the video and I have no issue of locked panning in Chrome. I believe the issue lies in the video feed per se.

I’m wondering about some means to forcibly stop panning somehow while the popup is live or to destroy everything about the popup (and re-establish something else?) once the popup is closed. I’m not sure if I can try to do this or if it actually has already been done as a workaround.

My supervisor tried dealing with hiding and showing events:
on(this.map.infoWindow, "hide", lang.hitch(this, function (evt) {
on(this.map.infoWindow, "show", lang.hitch(this, function (evt) {
Along with enabling and disabling map navigation. (These would either turn on pan or would disable pan from working completely. Anything for allowing pan but not having it turned on, perhaps?)
this.map.disableMapNavigation();
this.map.enableMapNavigation();
as well as doing similarly for panning:
this.map.enablePan();
this.map.disablePan();
Triggering mouse-up events did not work either:
on(this.map, "mouse-up", lang.hitch(this, function (evt) {
Any direction on the locked panning issue is appreciated. Please try our map in Google Chrome, click on the camera icons a few times and you should experience the locked panning issue. By the third time, panning should get locked. Please, any ideas?

Strange behaviour of BasemapToggle with defaultBasemap in some cases

When setting the defaultBasemap option to something other than the basemap that the underlying web map uses, the app will first show the web maps basemap. When the user then does a basemap toggle, it will show the basemap set as the toggle option. On the next toggle, the app will then show the basemap specified as defaultBasemap.

Or to be more clear:

  1. Create a new Web Map in ArcGIS Portal or AGOL
  2. Use Streets as the basemap
  3. Share as Public Information app
  4. Configure public information app to use the Topographic map as Default Basemap
  5. And the National Geographic map as next Basemap.
  6. When the app loads, it will display the Streets basemap
  7. First click on Toggle will display the National Geographic basemap
  8. Next click on Toggle will display the Topographic basemap.

I believe the end user expects the Basemap Toggle to always toggle between the same two maps.
So either show the basemap set as Default Basemap when the application loads, irregardless of which basemap was used in the web map, or toggle between the "Next basemap" and the basemap that was used on the web map.

It seems like the BasemapToggle dijit code actually should fetch the map's current basemap when toggling, and put that as previous basemap (and default basemap), but for some reasons, it works the way described above.

Subscriber Content settings reset

It appears I cannot share subscriber content via the Public Information application.

Workflow
I check the boxes to allow subscriber content to be seen in the application...
image

Then when I load the application outside my organization account, it prompts a sign-in...the Console shows several token errors.
image

When I go back to the configuration builder, the boxes are unchecked...:(
image

Even if there is a setting in my org blocking my sharing subscriber content - the app configuration should notify me of this.

App: http://eaglegis.maps.arcgis.com/apps/PublicInformation/index.html?appid=481aceaee8d64d51881234303ec7453f
Web Map: http://eaglegis.maps.arcgis.com/home/webmap/viewer.html?webmap=535d465272e34df7aefb0d7896338530

Change color of panels

We have received a few requests for being able to change the color of the panel / text on this application. Maybe just use color picker and optional box to add a hex code.

View map in fullscreen

When the map is embedded in a website, the user should be able to view it in full screen - like videos on Youtube. I've seen such a sample for the arcgis javascript api somewhere on Github, but I can't find it anymore.
Perhaps it is possible to make it configurable, with enabled by default.

YouTube - filter from configuration is not honored in the application

image

We configured the application to search the term "hurricane" by default. When I load the app it is not filtered in the legend and the map shows YouTube without the word hurricane.

Then when I open the settings (as shown)
image

It shows the word "hurricane" BUT the map does not reflect this until I hit the Search button.

Recommend Projects

  • React photo React

    A declarative, efficient, and flexible JavaScript library for building user interfaces.

  • Vue.js photo Vue.js

    🖖 Vue.js is a progressive, incrementally-adoptable JavaScript framework for building UI on the web.

  • Typescript photo Typescript

    TypeScript is a superset of JavaScript that compiles to clean JavaScript output.

  • TensorFlow photo TensorFlow

    An Open Source Machine Learning Framework for Everyone

  • Django photo Django

    The Web framework for perfectionists with deadlines.

  • D3 photo D3

    Bring data to life with SVG, Canvas and HTML. 📊📈🎉

Recommend Topics

  • javascript

    JavaScript (JS) is a lightweight interpreted programming language with first-class functions.

  • web

    Some thing interesting about web. New door for the world.

  • server

    A server is a program made to process requests and deliver data to clients.

  • Machine learning

    Machine learning is a way of modeling and interpreting data that allows a piece of software to respond intelligently.

  • Game

    Some thing interesting about game, make everyone happy.

Recommend Org

  • Facebook photo Facebook

    We are working to build community through open source technology. NB: members must have two-factor auth.

  • Microsoft photo Microsoft

    Open source projects and samples from Microsoft.

  • Google photo Google

    Google ❤️ Open Source for everyone.

  • D3 photo D3

    Data-Driven Documents codes.