Code Monkey home page Code Monkey logo

react-d3's Introduction

Update

Important update:

The actively maintained fork of this project is now at the Github of react-d3 co-creator yang-wei, who has recently taken the lead in maintaining the project and moving toward 1.0.

Yang Wei's fork is located here.

react-d3

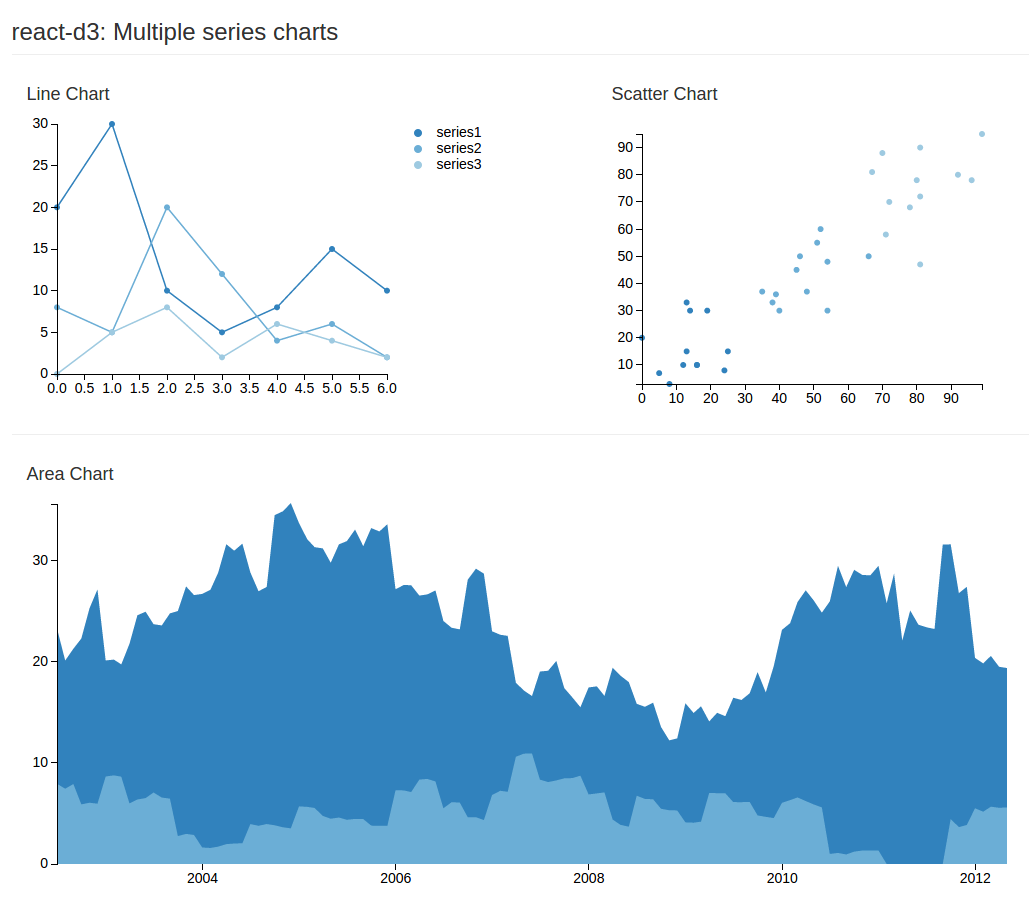
Modular ReactJS charts made using d3 chart utilities. Work on project documentation has started here. A few examples of the available charts can be seen below, the others can be viewed here, side-by-side with the React code that generates the charts.

react-d3 chart images

Build Status

Version

npm version

Basic usage

First, install via npm:

npm install react-d3

Then, import into your ReactJS project:

var rd3 = require('react-d3');
// es6
import rd3 from 'react-d3';

The charts are then available under the rd3 namespace, which you can then use as shown on the demonstration page:

If you don't wish to pull in all the charts, you can also require single chart:

var BarChart = require('react-d3/barchart').BarChart;
// es6
import { BarChart } from 'react-d3';

Available Charts

var BarChart = rd3.BarChart;
var LineChart = rd3.LineChart;
var PieChart = rd3.PieChart;
var AreaChart = rd3.AreaChart;
var Treemap = rd3.Treemap;
var ScatterChart = rd3.ScatterChart;
var CandleStickChart = rd3.CandleStickChart;

For usage, please see here. API documentation is also coming online over the coming days.

JSFiddle

There's a development build available for experimentation on JSFiddle: http://jsfiddle.net/esbullington/jp9dkh1g/.

Please note that this build should probably not be used in production, since it bundles all of react-d3's dependencies in a single bundle (this is also the cause of the "Cannot read property 'firstChild' of undefined" error message on the JS console, which occurs when there are two React libraries in the same namespace).

All the react-d3 charts are available in this JSFiddle fork under the global rd3 namespace.

Background

Although there have been several different approaches proposed for combining the power of d3 with the flexibility and modularity of ReactJS, the approach I'm using here was inspired by this blog post by Ben Smith of Binary Consulting.

With this approach, React itself is responsible for generating the SVG markup. d3.js is used for its tremendous collection of utility functions, such as those that calculate the path value for various chart types.

Roadmap

For current roadmap, please see Yang Wei's fork at: https://github.com/yang-wei/rd3

License

MIT

Copyright (c) 2014-2015 Eric. S Bullington, Lim Yang Wei, and project contributors

react-d3's People

Contributors

berrytj avatar bjoerge avatar ernest-rhinozeros avatar esbullington avatar evenwestvang avatar jefffriesen avatar jfcaiceo avatar jmuel avatar jsanchez034 avatar martinross avatar muddydixon avatar mwhite avatar nightlyop avatar parshap avatar rassalibre avatar rrag avatar staticskies avatar stevenlundy avatar thetallweeks avatar unbracketed avatar vladikoff avatar yang-wei avatar

Stargazers

 avatar  avatar  avatar  avatar  avatar  avatar  avatar  avatar  avatar  avatar  avatar  avatar  avatar  avatar  avatar  avatar  avatar  avatar  avatar  avatar  avatar  avatar  avatar  avatar  avatar  avatar  avatar  avatar  avatar  avatar  avatar  avatar  avatar  avatar  avatar  avatar  avatar  avatar  avatar  avatar  avatar  avatar  avatar  avatar  avatar  avatar  avatar  avatar  avatar  avatar  avatar  avatar  avatar  avatar  avatar  avatar  avatar  avatar  avatar  avatar  avatar  avatar  avatar  avatar  avatar  avatar  avatar  avatar  avatar  avatar  avatar  avatar  avatar  avatar  avatar  avatar  avatar  avatar  avatar  avatar  avatar  avatar  avatar  avatar  avatar  avatar  avatar  avatar  avatar  avatar  avatar  avatar  avatar  avatar  avatar  avatar  avatar  avatar  avatar  avatar

Watchers

 avatar  avatar  avatar  avatar  avatar  avatar  avatar  avatar  avatar  avatar  avatar  avatar  avatar  avatar  avatar  avatar  avatar  avatar  avatar  avatar  avatar  avatar  avatar  avatar  avatar  avatar  avatar  avatar  avatar  avatar  avatar  avatar  avatar  avatar  avatar  avatar  avatar  avatar  avatar  avatar  avatar  avatar  avatar  avatar  avatar  avatar  avatar  avatar  avatar  avatar  avatar  avatar  avatar  avatar  avatar  avatar  avatar  avatar  avatar  avatar  avatar  avatar  avatar

react-d3's Issues

require('../package.json')

hey :)

what's the purpose of line
var pkg = require('../package.json');
which is placed for example here: https://github.com/esbullington/react-d3/blob/master/src/barchart.js#L3

It causes problem for webpack bundling:
ERROR in ./~/react-d3/package.json Module parse failed: .../node_modules/react-d3/package.json Line 2: Unexpected token : You may need an appropriate loader to handle this file type. | { | "name": "react-d3", | "version": "0.0.12", | "description": "ReactJS charts using d3", @ ./~/react-d3/src/barchart.js 3:10-36

maybe these lines should be just removed from library (the library works fine with these lines commented) ? :)

Zoom and pan on charts

I am working on something very similar focused on charts for stocks. I had made some progress and wanted to open source it and came across your work, this is very exciting as it follows the very same technologies.

My work is far from complete so it will be prudent to contribute here rather than open a new project for my work.

Check out what I have done here.
http://react-charts-d3.s3-website-us-east-1.amazonaws.com/

One feature I struggled the most is to create a linear scale with date which is not continuous (see how the x axis dates do not have weekends but still shows up linear) I would like to get your feedback and add that scale also to this project if you agree of course.

Also I have used React style zoom and pan, no d3.zoom or d3.drag behavior which will be a nice addition to this project.

Contributing notes regarding build steps

I reinstall node by using nvm, so of course npm run watch fails and it took me a while to look at the build steps. Will be great it all of these are written in CONTRIBUTING.md.

Leaving this issue opening now. Will these notes in CONTRIBUTING.md within this week if no one does.

Inline Styles vs. CSS

How should we be styling chart components? Should we provide a base CSS file which a user can overload or should we use inline styles and allow the user to programmatically dictate styling though props.

I think the inline style approach would make most sense here since we already have a bunch of styling properties that can be specified through the api. Might be weird to split style properties between css and js.

Splitting chart components into their own file

What are your thoughts on splitting the chart components into their own files?

i.e. /src/linechart.js could be:
/src/linechart/linechart.react.js
/src/linechart/dataseries.react.js
/src/linechart/xaxis.react.js
/src/linechart/yaxis.react.js
ect.

Seems like the individual linechart.js file is getting large fast. Only downside I see is fuzzy search might be a little harder when there are multiple src/*/dataseries.react.js files.

(also, would be interested in hearing your preferences are around the .react.js extension)

Candlestick chart

I am getting started on this, few questions; please share your thoughts

  1. The data format will be
[
    { name : "open", values : [ {x : ..., y : ... }, {x : ..., y : ... }, {x : ..., y : ... }, {x : ..., y : ... } ] },
    { name : "high", values : [ {x : ..., y : ... }, {x : ..., y : ... }, {x : ..., y : ... }, {x : ..., y : ... } ] },
    { name : "low", values : [ {x : ..., y : ... }, {x : ..., y : ... }, {x : ..., y : ... }, {x : ..., y : ... } ] },
    { name : "close", values : [ {x : ..., y : ... }, {x : ..., y : ... }, {x : ..., y : ... }, {x : ..., y : ... } ] }
]
  1. there will only one OHLC series, meaning there will not be a DataSeries array, but just one
  2. on mouse hover animation will be changing the candle stroke-width & cande fill color will darken

Test chart components with class instead of tag?

When I added voronoi to line chart, the test failed because voronoi and the interpolate path both use path. What if we add className to each component explicitly and make use of that to test each component.

Setting SVG viewBox attribute

Maybe I've missed how to do this, but it seems like it would be useful to have the viewBox attribute for SVG set by default or through props for use in fluid layouts without the need to listen to window resize events. I know this would also scale text used in titles and labels, but it would still be helpful in certain situations.

Semantic chart className

Let's decide standard className for each components(or chart) in this library. Would be useful for documentation and tests in the future. The prefix for className I would like to proposed is rd3(you guessed it). So every main chart would have at least a className on the parent component at their g element (child of svg).

// For example candlestick chart
<svg width={...}>
  <g class='rd3-candlestick' > ... </g>   <--- here
</svg>

So other charts' className will look like rd3-barchart, rd3-treemap, rd3-scatterchart, rd3-x-axis by following class name. (Still thinking to include the word chart or not)

We also have child components inside those main chart components. So for example path inside areaChart will have rd3-areachart-path or like this

Same thing for axes.

Custom x and y accessors

We've been kind of assuming people will use x and y as the names of their respective data names, which is pretty inflexible. We should probably let them specify a custom x and y accessor. So, they could do something like:

<Chart x_accessor="event_dates" y_accessor="event_values" />

And then instead of using point.x and point.y, we'd use point.[props.x_accessor] etc.

Does this sound reasonable?

Pure React axes

I've got a working branch with pure React axes that I'll be pushing out soon (still having issues with text rendering not looking like the original d3 axes) but in the meantime I'll use this issue to track it.

envify required for browserify?

I installed the lib via npm install --save react-d3 and have v0.0.13. browserify/watchify started complaining about Cannot find module envify.

I resolved this locally by running npm install from the node_modules/react-d3 directory, but would like to understand how I can get this working in an automated build if possible.

Thanks for the great work.

v0.2.0

To do for v0.2.0:

  1. Add maybe two more chart types: a simple gauge chart (esbullington) and scatter (yang-wei)
  2. Improve documentation (esbullington working on it)
  3. Add legends (esbullington working on it)
  4. Get the code base cleaned up, and start using jshint (esbullington working on it)
  5. Factor out the axes (almost done by esbullington in #27 )
  6. Add some simple mouseover animations for the line, bar, and scatter charts (yang-wei)

clipPath for charts

Looking at some of the examples LineChart, ScatterChart, CandleStickChart these have the circle or rect at x origin bleeding into the left of the y axis. We need to either add a

<defs>
        <clipPath id="rd3-clipPath">
            <rect width={chartWidth} height={chartHeight} />
        </clipPath>
 </defs>

to the SVG and apply that clip to the g element where the chart is drawn to avoid the bleeding.

or

Move the y axis a little to the left so does not start at x origin

what do you think is the right solution here? I prefer clipPath.

Chart Title & Axes Attributes

Should a charts title and axes attributes be dictated by the data object?
It would make the charts more responsive to their inputted data.

For example,
yAxisTickCount={4}
xAxisTickInterval={{unit: "year", interval: 1}}
Could be defined in {data} and that way the interval and tick count could be calculated relative to the datasource on the server.

Alternate build script

I had to use windows for a few days and the npm run build and watch do not work on the windows version since mkdir -p does not exist on windows cmd and the mkdir command returns an error when the directory already exists aborting the npm run .... It spent too much time than I cared to on that problem and had to give up after some time.

I can create a gulpfile.js for the current build and send it over are you cool with that? or do you have other plans?

allow for individual component requires

Currently this is the recommended way of including react-d3,

var rd3 = require('react-d3');
var BarChart = rd3.BarChart;
var LineChart = rd3.LineChart;
var PieChart = rd3.PieChart;
var AreaChart = rd3.AreaChart;
var Treemap = rd3.Treemap;
var ScatterChart = rd3.ScatterChart;

While convenient it adds a lot of unnecessary bloat. Even if I'm maybe using all of them on the site I may only be using one or two per page, so loading all of them into every page is unnecessary bloat.

Another issue with this approach is that it doesn't scale up well. The more charts/etc are added the bigger it grows. Not very good for updates when the library just gets bigger with no code change.

Alternative approach,

var LineChart = require('react-d3/LineChart');
var BarChart = require('react-d3/BarChart');

Add labels to bar chart

Working on this in the barchart branch. The easiest solution for the time being is to use d3 to generate the label svg elements.

In the long run, I'd prefer to use React itself to create some kind of labels component, like almost all the other svg components are created, but I'm having trouble thinking of a good API for a label component.

Specifying appearance alongside data in series

To use piechart as an example:

The API for passing data to a piechart is a list of {label: label, value: value} objects. I'd like to be able to pass down appearance information, associated with each piece of data. For instance, in one case I'd like to specify varying opacities for the arcs of the piechart. There are two ways I can think of to do this:

  1. Add an "appearance" field to the data (so it would be a list of {label: label, value: value, appearance: appearance}).
  2. Pass down an "appearances" list that matches the data list index for index

In both cases, the "appearance" values would be objects containing arbitrary appearance fields. Any fields we want to put in there we'll have to add to the actual element creation step, with defaults.

I think option 1 is simpler, but maybe mixes concerns?

Voronoi tessellation overlay to detect mouseover events

As I wrote in the other issue, d3 provides a function d3.geom.voronoi() to help generate the Voronoi tessellation path (btw, I accidentally referred to an SVG rect instead of path in my description yesterday).

Here's the accompanying documentation. I'm looking at the documentation now and trying to figure out how to best use the generated data in our library.

Will you support multi types?

really excited by your project. are you planning to support multiple types (eg line + area, or ideally arbitrary combinations) in one chart? Will this include transitions between types? thanks.

BarChart needs renderAxis

The axes don't display on the initial render of BarChart. It looks like this has been solved in other components (line chart) with use of _renderAxis for componentDidMount and componentWillReceiveProps

npm pulled in an older version.

I installed this library from NPM and I got the errors for having this line "var pkg = require('../package.json');" inside some of the files. Mentioned in a previous issue.
It seems like the NPM version is off. Or you didn't change the version number when you last updated the library. The package.json file says version 0.0.12 but looks different than the latest on github.

I like where this library is going, definitely needs more charts. I'm somewhat new to react but I'll try to work on this a bit in my spare time.

  • David

Reusable method

Hey, as I'm writing test for voronoid, I realised that there are a few methods I need to reuse. Those methods are

  • concat all data into allValues
  • _calculateScale

I do think that it's good to factor out this method in util.js or as a (mixins)[http://facebook.github.io/react/docs/reusable-components.html#mixins]. I suggest to add another /src/mixins/ folder so that we can add resuable code here.

However we can do this in the next publish if you think that there are too much to do. No worries ๐Ÿ˜„

Axes renders on componentWillReceiveProps

This causes for instance the BarChart not rendering any axes since componentWillReceiveProps doesn't run on initial render. Would it work to use componentDidMount instead?

Is the pub-sub system necessary?

I think not.

From the React Docs:

For parent-child communication, simply pass props.

The current pub-sub system is included for what I can only assume is convenience. The reason I am requesting to remove it is that I am trying to stop the Voronoi events from triggering when the user is brushing (I have Voronois and brushes working together), and having a pub-sub system means that a parent component has little control over its child components. Since the graphs have a strict ancestor-child relationship, I think passing a callback through props is a much better solution (and is what I've implemented in my code).

So many renders

I was building a custom component based off line chart and noticed that the primary render function renders ~50 times when the page is refreshed. I thought I had set something up incorrectly but then I checked on the unadulterated LineChart and BarChart - both do it too. I didn't see any obvious reasons for it though. Anyone else get that?

Using Dates as Linechart X axis

Is this currently supported? If it isn't I can see what it takes to make it work and put in a pull request. It seems like it should be fairly easy though since d3 has some built in libraries for this sort of thing.

Error checking

Error checking is an issue in some of the charts. Need to make sure we properly handle empty arrays, missing values, wrong types, etc. Also need to add more tests to test this error handling.

Are npm dependencies correct?

I am having problems using this library within a repo. With a forked repo installed locally, I used npm link so that I can edit it while using it in another repo. I've done this before with other libraries and apps without a problem with the dependencies in this library. The react-d3 works fine if I install the remote repo, but it's hard to work that way.

The error I'm getting is this: Cannot read property 'firstChild' of undefined which is commonly reported as a conflict between to React libraries. (http://stackoverflow.com/questions/27153166/typeerror-when-using-react-cannot-read-property-firstchild-of-undefined)

I'm wondering if React should be a dependency. Looking at these popular repos they have React in peerDependencies:
https://github.com/react-bootstrap/react-bootstrap/blob/master/package.json
https://github.com/rackt/react-router/blob/master/package.json

I don't know much about peerDependencies though. Any insight would be great.

Also, should jsdom be a dependency? I know that d3 depends on it, but webpack or browserify should pull it in through d3.

Array Values causing issues

The code I'm referencing is in utils/index.js.

data.forEach( (series) => { series.values.forEach( (item, idx) => {

series.values appears to be an es6 addition to Array. When I build charts that use it in the docs it works fine but my personal project gives an error on this saying that series.values is null. This was changed in commit (32c5b7)[https://github.com/esbullington/react-d3/commit/32c5b716939cfbda53f3e49b14f79fc816826e65] and it looked like it was mostly a convenience change.

I would have assumed this would be compiled away by the es6 transpiler but it doesn't appear that this is happening in this case.

Issues including external scripts for use as webpack external dependencies

Getting a server-side error message trying to render a react component that depends on React-d3.js.

Error:

Error while loading "~/scripts/externs/react-d3.min.js": ReferenceError: document is not defined
    at Script Document [7]:9:29125 -> 3_array=function(list){return d3_arraySlice.call(list)},d3_document=document,d
    at Script Document [7]:13:26437
    at s (Script Document [7]:6:559)
    at Script Document [7]:6:610
    at ./areachart (Script Document [7]:6:9775)
    at s (Script Document [7]:6:559)
    at e (Script Document [7]:6:726)
    at Script Document [7]:6:743
    at Script Document [7]:6:272
    at Script Document [7]:6:277
Line: 9
Column:29125

Scenario:

  • Webpack bundle including a react component that requires 'd3-react' library.
'use strict';
var React = require('react'),
    BarChart = require('react-d3').BarChart;
var Test = React.createClass({
  render: function() {
    var barData = [
      {label: 'A', value: 5},
      {label: 'B', value: 6},
      {label: 'F', value: 7}
    ];
    return (
      <div>
        pretend im useful: {this.props.data}
        <BarChart data={barData} width={500} height={200} fill={'#3182bd'} title='Bar Chart' />
      </div>
    );
  }
});
module.exports = Test;
  • Webpack entrypoint including Test.jsx
module.exports = {
  Test: require('expose?Test!charts/Test')
};
  • Webpack config specifying externals including 'React' and 'react-d3'.
externals: {
  // Don't bundle these with the server-side bundle. React.NET needs these to be globals
  react: 'React',
  'react-d3': 'react-d3'
},
  • Server-side ReactConfiguration including 'react-d3' script.
            React.ReactSiteConfiguration
                .Configuration
                .AddScript("~/scripts/externs/react-d3.min.js")
                .AddScript("~/scripts/c/server/Charts.js");

Legends / Labels for Line Charts?

Hello, thanks for the nice work!

What do you think of adding legends/labels to line charts? When you have more than one data series, it can be hard to tell which is which.

To implement the legends, it seems that a new prop need to be added into LineChart. The reason that keys of data would not work is that, users might want to have same legend/label for different data series. A possible way is to have a prop.legends map, with keys corresponding to the ones in data.

What do you think?

docs should clarify implementation direction

Is this React components that have hacked-in d3
-or-
Is this fully rendered React components with only d3 utility data functions (no d3 rendering)

This make a lot of difference when delaing with server side rendering since having pure react rendering makes everything simpler; no dom emulation nonsense involved.

No more /** @jsx React.DOM */

@esbullington Hey, I don't know if you noticed that start from React v0.12, we no longer need to add /** @jsx React.DOM */ on top of our jsx files. You can see the detail on the official blog. So we can start removing all these comments since we are using v0.12.1.

Anyway feel free to close this issue if you think that it's great to support React older than v0.12

Thoughts on `LineChart.props.color`?

Currently LineChart.props.color is a function that takes in an argument being the index of the data series being drawn. However, it's hard to associate the index with keys (seriesName). This way, there doesn't seem to be a straightforward way to specify color for each data series explicitly. What do you think of letting the function accept keys (seriesName)?

A relevant idea is that, could we accept multiple data types as data, color, and legends (as proposed in #13)? Sometimes seriesName might only make sense within the react-d3, but the user may not care. If the user can feed in arrays, and associate color/legends with indices, it might be a good alternative interface?

Charts with more than two dimensions

Hey,

I'm looking at creating a new chart (very similar to a candlestick graph) which happens to have four dimensions - something many utils currently do not support. This will be a common occurrence, as graphs will map a dimension to many things e.g. colour, size

My solution in my personal work was to express data as an array, not an object. This allows any number of dimensions to be used by any graph. This solves #81 as well.

If we agree on a way to do this I don't mind upgrading the tooling (utils.flattenData, utils.calculateScales, etc.)

Loving the approach taken by this project currently.

Scatter Chart with new api approach

I am experimenting with scatter chart and hope to discuss something with you before I commit. After reading some of the close issues/pr especially #9 , I really like the api approach like this.

<LineChart width={400} height={200} >
  <DataSeries data={data} label={label} color={red} />
  <DataSeries data={data} label={label} color={blue} />
  <DataSeries data={data} label={label} color={green} />
</LineChart>

For me this is more readable and user can fill in the color easily. So is that ok to open a pr with this approach of api design or you think it's better to keep current style?

Ya I also notice that we are facing component lifecycle issue if we depend d3.svg to render axes. Hope to come out with pure-react-rendering during my experiment.

Change all instances of `color` (singular) to `fill`

We have some instances of color where it should be fill.

This isn't to be confused with colors, the plural noun, which takes a function that returns a color based on index (maybe we need a better name for that property).

Make scatterchart-tests pass

As you noticed, as we added voronoi to scatter chart, the test failed because now component <circle /> is no longer listen to any event.

To solve this problem, we can add event listener to circle as we did before

<circle onMouseOver={this._animateCircle} onMouseOut={...} />
...
_animateCircle: function(id) {
      if (this.props.id === id || id === null) {                   <-- a little bit hmmmm
        this.setState({
          circleRadius: this.state.circleRadius * ( 5 / 4 ),
          circleColor: this.shade(this.props.fill, -0.2)
        });
      }
    },
// or emit a event
<circle onMouseOver={this._animateCircleEvent} onMouseOut={...} />
...
_animateCircleEvent: function() {
  this.props.pubsub.emit('animateCircle', this.props.id);
}

Personally I like the first method more but it's kind of hacky.

Or another approach is we never let <circle/> listen to any events. Just in the test, we use EventEmitter.
Let me know what do you think.

Recommend Projects

  • React photo React

    A declarative, efficient, and flexible JavaScript library for building user interfaces.

  • Vue.js photo Vue.js

    ๐Ÿ–– Vue.js is a progressive, incrementally-adoptable JavaScript framework for building UI on the web.

  • Typescript photo Typescript

    TypeScript is a superset of JavaScript that compiles to clean JavaScript output.

  • TensorFlow photo TensorFlow

    An Open Source Machine Learning Framework for Everyone

  • Django photo Django

    The Web framework for perfectionists with deadlines.

  • D3 photo D3

    Bring data to life with SVG, Canvas and HTML. ๐Ÿ“Š๐Ÿ“ˆ๐ŸŽ‰

Recommend Topics

  • javascript

    JavaScript (JS) is a lightweight interpreted programming language with first-class functions.

  • web

    Some thing interesting about web. New door for the world.

  • server

    A server is a program made to process requests and deliver data to clients.

  • Machine learning

    Machine learning is a way of modeling and interpreting data that allows a piece of software to respond intelligently.

  • Game

    Some thing interesting about game, make everyone happy.

Recommend Org

  • Facebook photo Facebook

    We are working to build community through open source technology. NB: members must have two-factor auth.

  • Microsoft photo Microsoft

    Open source projects and samples from Microsoft.

  • Google photo Google

    Google โค๏ธ Open Source for everyone.

  • D3 photo D3

    Data-Driven Documents codes.