elmotec / circlify Goto Github PK
View Code? Open in Web Editor NEWCircle packing similar to squarify for treemap
License: MIT License
Circle packing similar to squarify for treemap
License: MIT License


Hey!
So I have been trying to get used to the package and using the same code as you have in the examples I am trying to generate same visualisation. The code is as follows
data = [
0.05, {'id': 'a2', 'datum': 0.05},
{'id': 'a0', 'datum': 0.8, 'children': [0.3, 0.2, 0.2, 0.1], },
{'id': 'a1', 'datum': 0.1, 'children': [
{'id': 'a1_1', 'datum': 0.05}, {'datum': 0.04}, 0.01],
},
]
circles = circ.circlify(data, show_enclosure=True)
labels = [0.05,0.05,0.8,0.3, 0.2, 0.2, 0.1,0.1,0.05,0.04,0.01]
circ.bubbles(circles,labels)
However I get the following image with improper labelling.

I have followed the same sequence of labelling as they appear in the data input command. Am I doing something wrong with the labels list?
Thanks!!
I've tweaked the code change various sizes, not sure why my data set isn't fully printing. No errors are being flagged. Any ideas here?[
Language Bubbles.zip
]
Line 48: pltp.Circle should read plt.Circle. This error results in matplotlib only plotting the labels rather than the circles.
Is there a way to set the color of each circle?
First, let me thank you for this code. However, I have some questions and recommendation.
I would recommend to emphasize the description of the input, indeed it's area and not radius as some (me included) may think.
Moreover, an option to scale or not would be cool.
I tried to use the library but had weird results, maybe you could explain them:
from pprint import pprint as pp
import circlify as circ
import matplotlib
import math
pi=math.pi
data= [{'id': '2.4', 'datum': pi*2.4**2}]*1 + \
[{'id': '1.825', 'datum': pi*1.825**2}]*1 + \
[{'id': '1.55', 'datum': pi*1.55**2}]*6 + \
[{'id': '1.275', 'datum': pi*1.275**2}]*8 + \
[{'id': '1.1875', 'datum': pi*1.1875**2}]*9
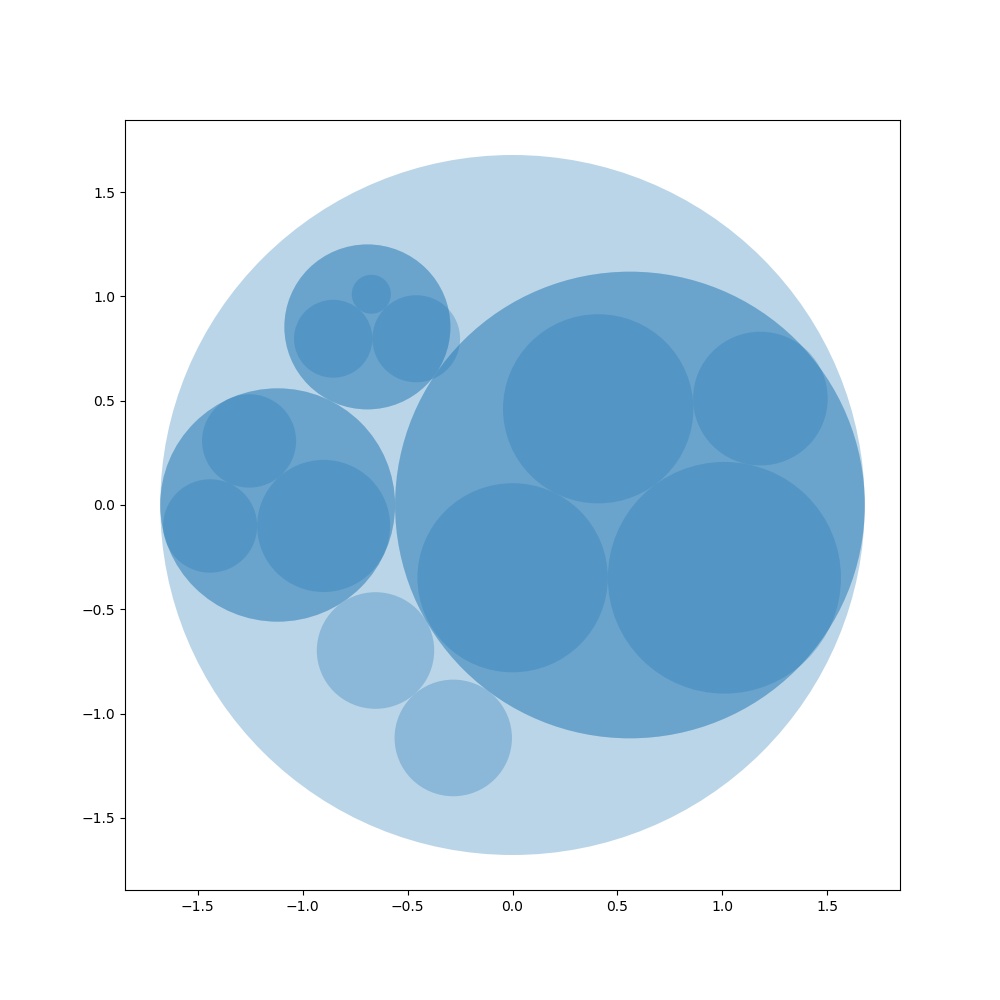
circles = circ.circlify(data, show_enclosure=True)
pp(circles)
circ.bubbles(circles)
That gives the following figure, which is clearly not optimized.
Is it a limit of the algo or an issue in the code?
Best regards.

I have tried to understand your function in order to determine the original diameter of the outer circle. For example: Input circlify.circlify(1,4), for a given radius of 2.5 you should get for the first circle 1 -> r=0.5 and for the second 4 -> r=2 in the console. Because it should fit exactly into the given radius without scaling. Why is that not the case?
Code:
import matplotlib.pyplot as plt
import circlify

random_numbers_2 = [1,4] # für circlify

target_enclosure = circlify.Circle(x=0, y=0, r=2.5)
# Algoritmus
circles_2= circlify.circlify(random_numbers_2, show_enclosure=True, target_enclosure=target_enclosure)

# Ausgeben
print(circles_2)

circlify.bubbles(circles_2)

Information: My goal is to find the minimum diameter of the outer circle and the ordering of the different circles.
At the moment, the sizes of nodes of the same level are calculated in relation to each other, so with very deep nesting, the sizes of the leaves become too small, which is not always convenient.

Please add the ability to fix leaf sizes so that parent node sizes are calculated automatically, proportional to their contents.

code:
circles = circlify([245, 82, 47], show_enclosure=True)
print(circles)
output:
[
Circle(x=0.0, y=0.0, r=1.0, level=0, ex=None),
Circle(x=-0.3410888529419269, y=0.5737488536869964, r=0.2774685597338418, level=1, ex={'datum': 47}),
Circle(x=-0.6335018581643184, y=0.0, r=0.3664981418356817, level=1, ex={'datum': 82}),
Circle(x=0.3664981418356817, y=0.0, r=0.6335018581643184, level=1, ex={'datum': 245})
]
for example,when input radius is 245 ,In the coordinate system((-1,1)(-1,1)), x=0.3664981418356817, y=0.0, r=0.6335018581643184
my question is how to get real circle.x circle.y,not Scale circle in enclosure to fit in the target circle(0,0,1.0)?
how I get Circle(x=?, y=?, r=245, level=1, ex={'datum': 245})?
Thank you very much!!!
Starting with version 0.10, circlify also handle hierarchical input so that:
import circlify as circ

data = [0.05, {'id': 'a2', 'datum': 0.05},
        {'id': 'a0', 'datum': 0.8, 'children': [0.3, 0.2, 0.2, 0.1], },
        {'id': 'a1', 'datum': 0.1, 'children':
          [ {'id': 'a1_1', 'datum': 0.05}, {'datum': 0.04}, 0.01],},
      ]
circles = circ.circlify(data, with_enclosure=True)
TypeError: circlify() got an unexpected keyword argument 'with_enclosure'.
I think SHOW_enclosure might be intended.
best regards,
Rawen
[email protected]
def drawMutliCircle():
a0=[0.8,0.2,0.1,0.05,0.05]
a1=[0.3,0.2,0.2,0.1]
a2=[0.1,0.05,0.05]
a3=[0.05,0.04,0.01]
l0=circ.circlify(a0,target_enclosure=circ.Circle(0,0,2048/1152-0.1),with_enclosure=True)
l1=circ.circlify(a1,target_enclosure=circ.Circle(l0[0][0],l0[0][1],l0[0][2]),with_enclosure=True)
l2=circ.circlify(a2,target_enclosure=circ.Circle(l0[1][0],l0[1][1],l0[1][2]),with_enclosure=True)
l3=circ.circlify(a3,target_enclosure=circ.Circle(l0[2][0],l0[2][1],l0[2][2]),with_enclosure=True)
fig,ax=plt.subplots(figsize=(6,6))
l=l0+l1+l2+l3
colors = [plt.cm.Dark2(i / len(l)) for i in range(len(l))]
for j in l:
c=Circle((j[0],j[1]),j[2],alpha=0.3,color=colors[l.index(j)-1])
ax.add_patch(c)
ax.plot()
plt.show()
First of all: thanks for publishing this library, it has already been of great help for the project I am working on!
The problem I am currently facing is that for some reason with specific input data the number of generated circles is just wrong.
Here two examples:
(import circlify as c)
c.circlify([0.998997995991984, 0.000501002004008016, 0.000501002004008016])
gives me the result
[Circle(x=0.02190377678049788, y=0.0, r=0.9780962232195022), Circle(x=-0.9780962232195022, y=0.0, r=0.02190377678049785)]
where I would have expected 3 circles.
c.circlify([131, 91, 71, 25, 25])
gives me the result
[Circle(x=0.45458330153157256, y=0.0, r=0.5454166984684274), Circle(x=-0.5454166984684274, y=0.0, r=0.45458330153157256)]
where I would have expected 5 circles.
I tested this with version 0.9.1 and 0.9.2 on Windows 10 with Python 3.7.3 as well as with version 0.9.2 on Ubuntu 16.04.6 LTS (WSL) with Python 3.5.2.
I noticed this because I am generating quite a lot of circles. I can only guess that there are more cases in which the composition of input data causes this problem.
A declarative, efficient, and flexible JavaScript library for building user interfaces.
🖖 Vue.js is a progressive, incrementally-adoptable JavaScript framework for building UI on the web.
TypeScript is a superset of JavaScript that compiles to clean JavaScript output.
An Open Source Machine Learning Framework for Everyone
The Web framework for perfectionists with deadlines.
A PHP framework for web artisans
Bring data to life with SVG, Canvas and HTML. 📊📈🎉
JavaScript (JS) is a lightweight interpreted programming language with first-class functions.
Some thing interesting about web. New door for the world.
A server is a program made to process requests and deliver data to clients.
Machine learning is a way of modeling and interpreting data that allows a piece of software to respond intelligently.
Some thing interesting about visualization, use data art
Some thing interesting about game, make everyone happy.
We are working to build community through open source technology. NB: members must have two-factor auth.
Open source projects and samples from Microsoft.
Google ❤️ Open Source for everyone.
Alibaba Open Source for everyone
Data-Driven Documents codes.
China tencent open source team.