Code Monkey home page Code Monkey logo

biodosetools's Introduction

Biodose Tools

CRAN_Status_Badge lifecycle R-CMD-check pkgdown Workflow Status Codecov test coverage doi

Overview

Biodose Tools (Hernández et al. 2023) is an open source project that aims to be a tool to perform all different tests and calculations needed by biological dosimetry laboratories. The app is developed using the R programming language and Shiny as a framework to offer an online, easy-to-use solution. Although the intention is to provide the application as a website, all R routines are available as an R package, which can be downloaded for improvement or personal use.

We also aim to clarify and explain the tests used and to propose those considered most appropriate. Each laboratory in its routine work should choose the most suitable method, but the project aims to reach a consensus that will help us in case of mutual assistance or intercomparisons.

The project is initially developed by RENEB association, but contributions are always welcome.

Installation

You can install the released version of {biodosetools} from CRAN with:

install.packages("biodosetools")

Or install the development version from GitHub with:

devtools::install_github("biodosetools-team/biodosetools")

Examples

To run the Biodose Tools app locally, we can run the following command on the R console, which will invoke the Shiny user interface:

library(biodosetools)
run_app()

Detailed examples using {biodosetools}’s Shiny user interface as well as its R API to perform dose-effect fitting and dose estimation for the dicentric and translocation assays are available on https://biodosetools-team.github.io/documentation/ in the “Using Biodose Tools” chapters.

Citation

If you use data, results or conclusion from this work, please cite:

Hernández, A., Endesfelder, D., Einbeck, J., Puig, P., Benadjaoud, M. A., Higueras, M., Ainsbury, E., Gruel, G., Oestreicher, U., Barrios, L., & Barquinero, J. F. (2023). Biodose Tools: an R shiny application for biological dosimetry. International Journal of Radiation Biology, 1-13. https://doi.org/10.1080/09553002.2023.2176564

A BibTeX entry for LaTeX users is:

@article{BiodoseTools2023,
  author        = {Alfredo Hern{'{a}}ndez and David Endesfelder and Jochen Einbeck and Pedro Puig and Mohamed Amine Benadjaoud and Manuel Higueras and Elizabeth Ainsbury and Ga{"{e}}tan Gruel and Ursula Oestreicher and Leonardo Barrios and Joan Francesc Barquinero},
  title         = {{Biodose Tools: an R shiny application for biological dosimetry}},
  journal       = {International Journal of Radiation Biology},
  pages         = {1-13},
  year          = {2023},
  publisher     = {Taylor & Francis},
  doi           = {10.1080/09553002.2023.2176564},
  note          = {PMID: 36731491},
  URL           = {https://doi.org/10.1080/09553002.2023.2176564},
  eprint        = {https://doi.org/10.1080/09553002.2023.2176564}
}

biodosetools's People

Contributors

aldomann avatar

Stargazers

 avatar  avatar  avatar  avatar

Watchers

 avatar  avatar  avatar

Forkers

yolemi sanou-ded

biodosetools's Issues

Dose Estimation produce "subscript out of bounds" in 3.2.0 (dev-branch)

Bug report/feedback

  • Assessment: Dicentrics/Dose Estimation
  • Module: Acute/Whole Body dose estimation

After loading data using .rds, and input data (C0:480, C1:20), selecting Acute and Whole body, the dose estimation produces "subscript out of bounds" error:
image

R console

Warning: Error in [<-: subscript out of bounds
185: reactive:data [modules/generalEstimateModules.R#769]
183: .func
180: contextFunc
179: env$runWith
172: ctx$run
171: self$.updateValue
169: data
168: renderPlot [modules/generalEstimateModules.R#1191]
166: func
126: drawPlot
112: reactive:plotObj
96: drawReactive
83: origRenderFunc
82: output$dicent_estimate-plot
2: shiny::runApp
1: runApp
Warning: Error in [<-: subscript out of bounds
102: Anonymous
Warning: Error in [<-: subscript out of bounds
102: Anonymous

and

Warning: Error in [<-: subscript out of bounds
116: reactive:data [modules/generalEstimateModules.R#769]
100: data
96: func [modules/generalEstimateModules.R#1020]
83: origRenderFunc
82: output$dicent_estimate-est_yields_whole
2: shiny::runApp
1: runApp
Warning: Error in [<-: subscript out of bounds
102: Anonymous
Warning: Error in [<-: subscript out of bounds
171: Anonymous

Estimación de Dosis a Cuerpo Entero (Whole Body) En una muestra sobredispersa

Bug report/feedback

  • Assessment: Whole Body Estimation
  • Module: Dose Estimation
    Estimación de Dosis a Cuerpo Entero (Whole Body)
    En una muestra sobredispersa, c(rep(0,489), rep(1,10), 9) :
    Parece que el método delta ajusta los conteos por sobredispesión
    En ese caso Merkle 95-95 resulta en un intervalo más corto que Delta supongo debe ser porque
    Merkle 95-95 no está ajustando los conteos inferior y superior por sobredispersión.

Abrazo, jorge

Describe what issue or problem you are experiencing on the application.

Please attach an image if it helps to visualize the problem.

OK

TODO OK desde La Habana, era un tema de velocidad de conexión.
Abrazo, jorge

Bug report/feedback

  • Assessment:
  • Module:

Describe what issue or problem you are experiencing on the application.

Please attach an image if it helps to visualize the problem.

Small confidence intervals in underdispersed data (Delta Method)

Bug report/feedback (from David)

  • Assessment: Dicentrics
  • Module: Dose estimation

For the delta method you always use the empirical standard error of the dicentric counts for the estimation of confidence intervals. I would recommend that you use at least the Poisson error if dispersion < 1 and the empirical standard error otherwise. Otherwise you sometimes get really small CI’s if the data is underdispersed.

For disp < 1 you can use

se.Y <- sqrt(number dics)/(number cells)

For disp >= 1 keep it as it is at the moment.

Wrong aberrations count with Ck for k >= 10

Technical details

  • Version: 3.4.0.9000
  • Assessment: Any
  • Module: Fitting and dose estimation

Issue description

When calculating parameters of a counts or case table, C10, C11, ..., C20, C21, ... are not counted properly when calculating the number of detected aberrations X.

As pictured below, C1x are counted as C1 by calculate_aberr_power(), C2x are counted as C2, and so on.
image

The issue comes from the wrongly constructed regular expression "[0-9]".

Rounding error in manual fitting curve input

Bug report/feedback (from David)

  • Module: Dose estimation

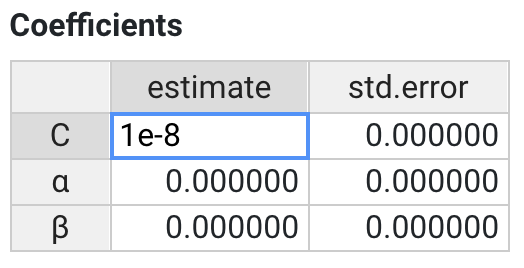
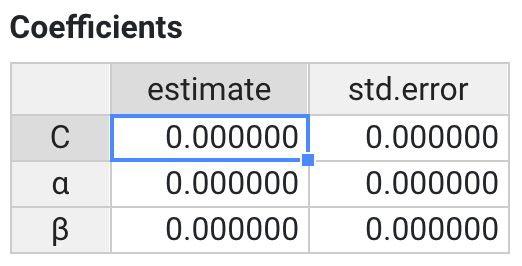
I think it is not so perfect that rounded (after fourth digit) numbers (manual calibration curve input; dose estimation) module are used for downstream analysis. Sometimes the coefficients have very low values and I noticed that this sometimes leads to slightly biased dose and CI estimates in the downstream analysis. I think this can be fixed relatively easy. The values shown on the html page can still be the rounded values, but for calculations you should use the actual values.

Before (input) After (display)
image image

Stop using non-ASCII characters

  • Assessment: All
  • Module: All
  • Affected version: <=3.1.0

We are using non-ASCII characters for α, β in general_fit_coeffs and general_var_cov_mat. We need to move away from this, as portable packages must use only ASCII characters in their R code.

Webpage do not render correctly. Biodosetools do not work.

Bug report/feedback

  • Assessment: Github version appears not effective
  • Module: Master (3.0.0) or Dev Branch (3.1.0)

Installing in R using:
install.packages("devtools")
devtools::install_github("biodosimetry-uab/biodosetools")
Installation process seems to run correctly, no missing package or dependencies or errors are notified during the process
Running BiodoseTools : runApp()
Local session launch under local host (127.0.0.1), but webpage do not appear to render correctly:

  1. On the left menu : all appear even if only Dicentrics is select on the upper scrolling menu:

Capture-20200208180735-930x1025

  1. Selecting the first Fitting in the left menu:
  • In Data input options frame: All the options appear together : custom Table or File input. The selection of "Load data from file" does change anything.

  • In Data input frame: No table render or even appear when changing nb of dose of max nb of dicentrics, or when loading input file..

  • Can not do anything.

Capture-20200208181907-930x1025

Please attach an image if it helps to visualize the problem.

bootstrap u test p values small counts aberrations

Technical details

  • Version:3.5
  • Assessment: u test
  • Module: Fitting and Dose estimation

Issue description

u test deviations from normal distribution is quite evident for yields <0.1 see Merkle 1981, and Higueras et al. 2018.
If u test prevail over exact conditional tests
still care should be taken for small aberration counts or small yield in these cases bootstraping the statistic under H0 could be a proper solution.
Eg. Note similar solutions implemented for Chisquare test in R stats when simulated p values are provided for small frequencies. An alternative to the use of a conditional exact test with lack of statistical power and as alternatuve to deviations from the chi square distribution under H0 if chisquare aproximation is used.

This a solution usefull if comparison of poisson means or counts are introduced in biodosetools avoid t aproximations and use exact poisson test eg. exactci R package. To detect and exposure higher than background of aberrations (dicentrics)

Biased estimates in curve fitting procedure

Bug report/feedback (from David)

  • Module: Fitting
  • Version: v3.1.0 (2020-02-03)

There is a little bug in your code which can lead to biased estimates in your curve fitting procedure. This error occurs if the mean value is exactly zero and the dispersion index can therefore not be calculated because division with 0. As you use weighted regression models for your glm, such values will not be used for the estimation. This is problematic as the results will be biased.

There are two possibilities to solve this issue quickly:

  1. Do the glm without weighting for dispersion index.
  2. Set the weights to 1 if is.na(weights)==TRUE.

Proposed solution

You’ll have to make the changes in fittingFunctions.R and the function get_fit_glm_method():

weights[is.na(weights)] <- 1

in line 158 of your code and the problem should be solved.

Deviance , AIC different from glm solution

Technical details

  • Version: online io version
  • Assessment:
  • Module: dicentrics fitting

Issue description

Deviance and AIC reported by biodosetools are different from the glm solution

Wrong reported u-value

Bug report/feedback (from David)

  • Module: Dose estimation
  • Version: v2019-10-15-beta (web version); 3.0.0

The Biodose Tool output of the U values is slightly different from my calculations, e.g. for the data C0=457, C1=29, C2=11, C3=2, C4=1 I get U=10.12 and the tool reports U=10.05.
image

When I execute your code in R I also get 10.12. I was not able to figure out why the value in the output of the app is different.

GLM quasi-Poisson doesn't detect overdispersed data

Bug report/feedback

  • Version: 3.4.0
  • Assessment: Dicentrics
  • Module: Fitting

We were testing Biodose Tools on overdispersed data and a linear model, choosing quasi-Poisson as the model family. See snippet below to reproduce the count data calculations.

library(dplyr)

count_data <- data.frame(
  D = c(0.02, 0.05, 0.1, 0.2, 0.3, 0.5, 0.7, 1),
  C0 = c(2000, 2043, 1475, 1494, 724, 463, 579, 203),
  C1 = c(8, 19, 24, 44, 37, 27, 74, 35),
  C2 = c(3, 4, 7, 15, 9, 9, 19, 7),
  C3 = c(0, 1, 2, 3, 3, 3, 9, 3),
  C4 = c(0, 0, 0, 1, 1, 1, 3, 2),
  C5 = c(0, 0, 0, 0, 0, 0, 2, 1)
) %>%
  dplyr::mutate(
    N = as.integer(rowSums(.[grep("C", names(.))])),
    X = biodosetools::calculate_aberr_power(., power = 1),
    X2 = biodosetools::calculate_aberr_power(., power = 2),
    mean = biodosetools::calculate_aberr_mean(X, N),
    var = biodosetools::calculate_aberr_var(X, X2, N),
    DI = biodosetools::calculate_aberr_disp_index(mean, var),
    u = biodosetools::calculate_aberr_u_value(X, N, mean, var, assessment_u = 1.00)
  )

count_data$DI
#>       V1       V2       V3       V4       V5       V6       V7       V8 
#> 1.422317 1.452856 1.562768 1.634828 1.620120 1.715689 1.811425 1.794704

The data is clearly overdispersed, and such a quasi-Poisson model should be used ("Automatic" should give the same results, as it runs the same routine as quasi-Poisson).

However, the glm model dispersion is lower than 1, and thus the Poisson family is used instead. Below we can see a snippet to replicate the calculations done when running biodosetools::get_fit_glm_method():

doses <- count_data[["D"]]
aberr <- count_data[["X"]]
cells <- count_data[["N"]]
disp <- count_data[["DI"]]
coeff_C <- cells
coeff_alpha <- cells * doses
coeff_beta <- cells * doses * doses
model_data <- list(coeff_C = coeff_C, coeff_alpha = coeff_alpha, coeff_beta = coeff_beta, aberr = aberr)
data_weights <- 1 / disp

fit_debug <- stats::glm(
  formula = as.formula("aberr ~ -1 + coeff_C + coeff_alpha"),
  family = stats::quasipoisson(link = "identity"),
  weights = data_weights,
  data = model_data
)

summary(fit_debug)$dispersion
#> [1] 0.652433

My impression is that using the weights parameter "corrects" the overdispersion (not using it reports a dispersion of 1.140056), and therefore the app will never choose a quasi-Poisson model.

Probably related to #14.

Error when using manual fitting coefficients in dose estimation

Technical details

  • Version: 3.4.0.9000 (6837fd0)
  • Assessment: Dicentrics
  • Module: Dose estimation

Issue description

On dose estimation, when a manual fitting curve is used instead of loading an RDS file, the dose estimation fails:

Listening on http://127.0.0.1:3161
Warning: Error in [<-: subscript out of bounds
  [No stack trace available]
Warning: Error in [<-: subscript out of bounds
  111: <Anonymous>
Warning: Error in [<-: subscript out of bounds
  111: <Anonymous>

The issue is that the rownames is parsed from the hardcoded rhandsontable() rownames fixed by fix_coeff_names().

Warning when the optim algorithm doesn't converge

Bug report/feedback (from David)

  • Module: Dose estimation

In our case the estimated CI's for the doses are really large and the reason is that the optim algorithm does not converge. This is probably due to the fact that the optimizer can't find solutions if the number of aberrations (and cells) is not large enough.

In R optim issues a warning about this but it's not possible to see this in the Biodose Tools. I would suggest that we do not provide dose estimates in such a case and rather mention that the algorithm did not converge and that there is probably not sufficient data to do the heterogeneous dose estimation.

Suggestion: to add a result table after partial body assessment

Technical details

  • Version:3.6.0
  • Module: Dicentrics/Dose estimation

Issue description

Suggestion (not an issue):
For Partial body assessment, three result tables are shown :
1. yield table,
2. dose table
3. and initial fraction of irradiated cells table.

It could be nice to add a fourth table (between the second and the third) showing the ratio of metaphases observed which belong to the irradiated fraction (ie belonging to the "decontaminated" Poisson distribution). This value is for sure already calculated as it is use for the estimation of the "initial fraction of irradiated blood" based on survival coefficient.
This could be helpfull in case of assessment of simulated distributions, to check that all went well.

In fact, this ratio is already given for "heterogeneous assessment" result tables, in the first table, column "frac", but not for partial.

Show user that the calculations are still ongoing

Bug report/feedback (from David)

  • Module: Heterogeneous dose estimation

The first step to get the initial values based on the mixtool package takes quite long and I first thought that the program crashed and closed it. So, it would be nice to have something showing the user that the program is still working and that he/she has to be patient.

Partial body dose estimation generate error

Bug report/feedback

  • Assessment: dev branch 3.2.1
  • Module: biodosetools::estimate_partial_dolphin

When trying to estimate a partial body dose with Dolphin produce an error:
image

and in R console:

Warning: Error in biodosetools::estimate_partial_dolphin: argument "input" is missing, with no default
  186: biodosetools::estimate_partial_dolphin
  185: <reactive:data> [modules/generalEstimateModules.R#867]
  183: .func
  180: contextFunc
  179: env$runWith
  172: ctx$run
  171: self$.updateValue
  169: data
  168: renderPlot [modules/generalEstimateModules.R#1191]
  166: func
  126: drawPlot
  112: <reactive:plotObj>
   96: drawReactive
   83: origRenderFunc
   82: output$dicent_estimate-plot
    2: shiny::runApp
    1: runApp

Please attach an image if it helps to visualize the problem.

full vs aggregated data

Bug report/feedback

  • Module: Fitting

Describe what issue or problem you are experiencing on the application.

In which situation does biodosetools use the full data (i.e. every cell is one data point) or the aggregated data. My impression is, that the aggregated data is used if glm(...) doesn't ptoduce an error. Otherwise the software switches to the get_fit_maxlik_method(...) function and the full data is used. I think for both methods it should be consistent whether the aggregated or the full model is used. I noticed recently, that the full model can cause some substantial underestimation of the uncertainty if there are conditional dependencies between the observations. So, for the moment I would suggest that we stick to the aggregated data for the glm as well as for the maxLik case. This part needs some thorough thinking.

In addition, I think that weighting by 1/disp is only performed for the glm(...) but not for the get_fit_maxlik_method(...). Maybe this should be consistent, too? Do we actually need the weights?

A nice alternative for the rather complicated code of the constraint ML optimization in get_fit_maxlik_method(...) could be the package addreg which is designed for Poisson regressions with identity link. I also have the feeling that this package is more robust than our current implementation.

Please attach an image if it helps to visualize the problem.

CG poisson interval

Technical details

  • Version: last
  • Assessment:
  • Module: poisson intervals for Merkle method

Issue description

Crow and Gardner (suggested in the IAEA manual) or modified CG poisson intervals should be used instead of Garwood.


Fitting module: the glmrob( ) function could be used to check for gross errors in data introduction for fitting. The robust weigths factors of the data points could be used to advice the user to recheck some particular data points introduced

addreg formula

Technical details

  • Version:
  • Assessment:
  • Module: fitting with addreg (for a future use)

Issue description

addreg package dont support formula
ej. ab = -1 + c + alpha + beta
Seems the package dont support formulas with -1 in the formula ...model without intercept not supported...
Without the -1 works find...
The intercept seems to refers to ab value at 0 dose and not to the usual C term ab/cells

can we obtain the usual C term from the intercept of the model?

Docx report do not render (3.2.0)

Bug report/feedback

  • Assessment: Dicentrics: Dose-effect fitting
  • Module: Export Results

When selecting .docx as export format for Report, the generation of the report fails
R console output:

processing file: dicentrics-report.Rmd
|...... | 5%
inline R code fragments

|............ | 11%
label: unnamed-chunk-1 (with options)
List of 1
$ include: logi FALSE

Quitting from lines 11-12 (dicentrics-report.Rmd)

Warning: Error in loadNamespace: aucun package nommé 'pander' n'est trouvé
[No stack trace available]

Workthrough :
Installation of pander package solves the issue

Proposed correction:
To add pander package in the list of required packages

Describe what issue or problem you are experiencing on the application.

Please attach an image if it helps to visualize the problem.

Recommend Projects

  • React photo React

    A declarative, efficient, and flexible JavaScript library for building user interfaces.

  • Vue.js photo Vue.js

    🖖 Vue.js is a progressive, incrementally-adoptable JavaScript framework for building UI on the web.

  • Typescript photo Typescript

    TypeScript is a superset of JavaScript that compiles to clean JavaScript output.

  • TensorFlow photo TensorFlow

    An Open Source Machine Learning Framework for Everyone

  • Django photo Django

    The Web framework for perfectionists with deadlines.

  • D3 photo D3

    Bring data to life with SVG, Canvas and HTML. 📊📈🎉

Recommend Topics

  • javascript

    JavaScript (JS) is a lightweight interpreted programming language with first-class functions.

  • web

    Some thing interesting about web. New door for the world.

  • server

    A server is a program made to process requests and deliver data to clients.

  • Machine learning

    Machine learning is a way of modeling and interpreting data that allows a piece of software to respond intelligently.

  • Game

    Some thing interesting about game, make everyone happy.

Recommend Org

  • Facebook photo Facebook

    We are working to build community through open source technology. NB: members must have two-factor auth.

  • Microsoft photo Microsoft

    Open source projects and samples from Microsoft.

  • Google photo Google

    Google ❤️ Open Source for everyone.

  • D3 photo D3

    Data-Driven Documents codes.