Code Monkey home page Code Monkey logo

auto_ts's Introduction

Repos Badge Updated Badge Join our elite team of contributors! Contributors Display Contributors Display Contributors Display Contributors Display image3000

๐Ÿ‘‹ Welcome to the AutoViML Fan Club Page!
We just hit 3300 stars collectively for all AutoViML libraries on Github!!

AutoViML creates innovative Open Source libraries to make data scientists' and machine learning engineers' lives easier and more productive!

kanchitank

Our innovative libraries so far:

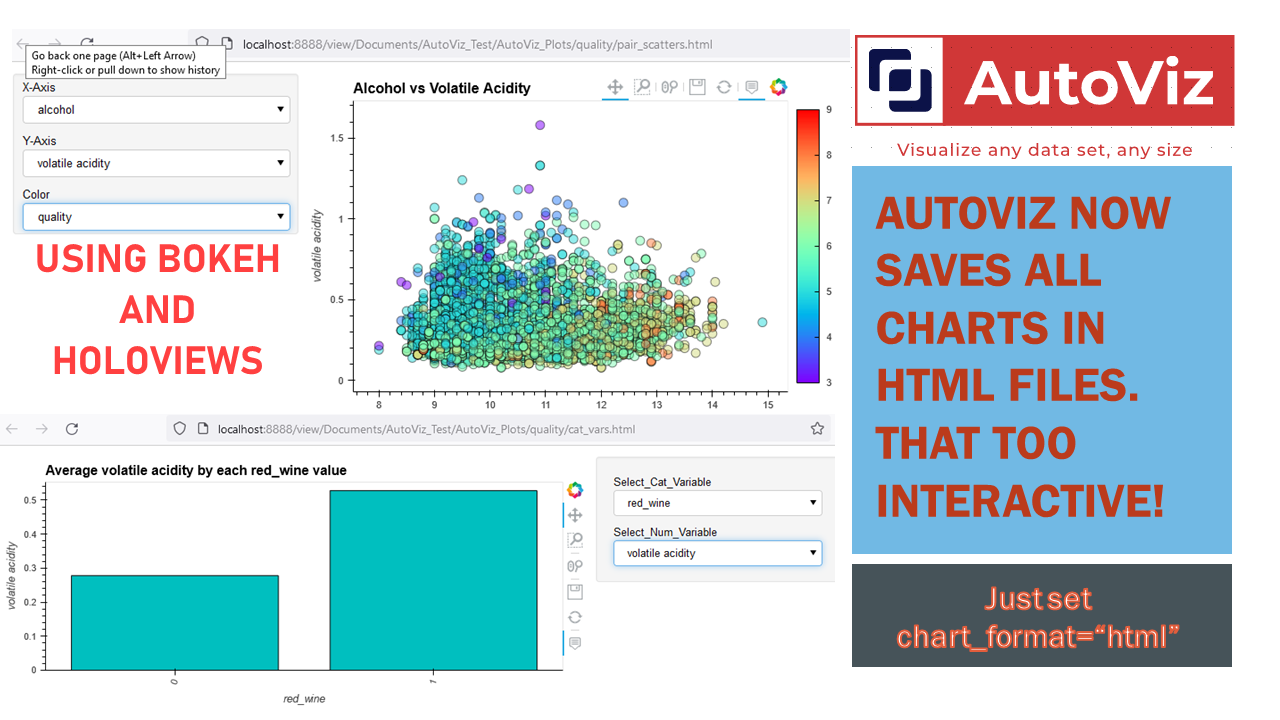
  • ๐Ÿค AutoViz Automatically Visualizes any dataset, any size with a single line of code. Now with Bokeh and Holoviews it can make your charts and dashboards interactive!
  • ๐Ÿค Auto_ViML Automatically builds multiple ML models with a single line of code. Uses scikit-learn, XGBoost and CatBoost.
  • ๐Ÿค Auto_TS Automatically builds ARIMA, SARIMAX, VAR, FB Prophet and XGBoost Models on Time Series data sets with a Single Line of Code. Now updated with DASK to handle millions of rows.
  • ๐Ÿค Featurewiz Uses advanced feature engineering strategies and select the best features from your data set fast with a single line of code. Now updated with DASK to handle millions of rows.
  • ๐Ÿค Deep_AutoViML Builds tensorflow keras models and pipelines for any data set, any size with text, image and tabular data, with a single line of code.
  • ๐Ÿค lazytransform Automatically transform all categorical, date-time, NLP variables to numeric in a single line of code, for any data, set any size.
  • ๐Ÿค pandas_dq Automatically find and fix data quality issues in your dataset with a single line of code, for pandas.

AN IMPORTANT MESSAGE TO MY AUTOVIML COMMUNITY about pandas-2.0 and other "version 2.0 libraries"

I keep getting requests to upgrade my packages to pandas-2.0. I have no problem to do so but if I upgrade your machines to pandas-2.0 the following things will break:

  • dask
  • lightgbm
  • category_encoders
  • imbalanced-learn
  • scikit-learn
  • matplotlib
  • seaborn
    I may have left out thousands of other packages that will break if I merely upgrade your machine to pandas-2.0 without upgrading all those 1000's of other packages to work with pandas-2.0.
    In addition, some of you will have to upgrade your "python" version itself to "3.9 or higher". Are you willing to take such a major leap?
    How many of us want to spend hours upgrading your python version and all its complexity, so that every package is fixed to work in the new python version?
    I am not.
    So please upgrade your individual machine to whatever these "2.0" libraries supposedly provide and "enjoy". But until then, stop pestering others to do so.

Feb-2024: Added "Auto Encoders" for automatic feature extraction to featurewiz library for #feature-extraction

On Feb 8, 2024, we released a major update to our popular "featurewiz" library that will transform your input into a latent space with a dimension of latent_dim. This lower dimension (similar to PCA) will enable you to extract the best patterns in your data for the toughest imbalanced class and multi-class problems. Try it and let us know! autoencoders-screenshot
how to use autoencoders in featurewiz

April-2023: Released a major new python library "pandas_dq" #data_quality #dataengineering

On April 2, 2023, we released a major new Python library called "pandas_dq" that will automatically find and fix data quality issuesin your train and test dataframes in a single line of code, for any data, set any size. fix-dq-screenshot
how many pixels wide is my screen

April-2022: Released a major new python library "lazytransform" #featureengineering #featureselection

On April 3, 2022, we released a major new Python library called "lazytransform" that will automatically transform all categorical, date-time, NLP variables to numeric in a single line of code, for any data, set any size. lazy-code2

Jan-2022: Major upgrade to featurewiz: you can now perform feature selection thru fit and transform #MLOps #featureselection

As of version 0.0.90, featurewiz has a scikit-learn compatible feature selection transformer called FeatureWiz. You can use it to perform fit and predict as follows. You will get a Scikit-Learn Transformer object that you can add it to other data pipelines in MLops to select the top variables from your dataset.
featurewiz-class2

Dec-23-2021 Update: AutoViz now does Wordclouds! #autoviz #wordcloud

AutoViz can now create Wordclouds automatically for your NLP variables in data. It detects NLP variables automatically and creates wordclouds for them.

Dec 21, 2021: AutoViz now runs on Docker containers as part of MLOps pipelines. Check out Orchest.io

We are excited to announce that AutoViz and Deep_AutoViML are now available as containerized applications on Docker. This means that you can build data pipelines using a fantastic tool like orchest.io to build MLOps pipelines visually. Here are two sample pipelines we have created:

AutoViz pipeline: https://lnkd.in/g5uC-z66 Deep_AutoViML pipeline: https://lnkd.in/gdnWTqCG

You can find more examples and a wonderful video on orchest's web site banner

Dec-17-2021 AutoViz now uses HoloViews to display dashboards with Bokeh and save them as Dynamic HTML for web serving #HTML #Bokeh #Holoviews

Now you can use AutoViz to create Interactive Bokeh charts and dashboards (see below) either in Jupyter Notebooks or in the browser. Use chart_format as follows:

  • chart_format='bokeh': interactive Bokeh dashboards are plotted in Jupyter Notebooks.
  • chart_format='server', dashboards will pop up for each kind of chart on your web browser.
  • chart_format='html', interactive Bokeh charts will be silently saved as Dynamic HTML files under AutoViz_Plots directory

Languages and Tools:

docker git python scikit_learn

ย AutoViML

AutoViML

Our Kaggle Badges:

notebook discussion

Connect with us on Linkedin:

ram seshadri

auto_ts's People

Contributors

abdulrahman305 avatar autoviml avatar borda avatar cgobat avatar jimmybroomfield avatar karatekat94 avatar kevin-chen0 avatar ngupta23 avatar pranavvp16 avatar rsesha avatar sugatoray avatar turkalpmd avatar

Stargazers

 avatar  avatar  avatar  avatar  avatar  avatar  avatar  avatar  avatar  avatar  avatar  avatar  avatar  avatar  avatar  avatar  avatar  avatar  avatar  avatar  avatar  avatar  avatar  avatar  avatar  avatar  avatar  avatar  avatar  avatar  avatar  avatar  avatar  avatar  avatar  avatar  avatar  avatar  avatar  avatar  avatar  avatar  avatar  avatar  avatar  avatar  avatar  avatar  avatar  avatar  avatar  avatar  avatar  avatar  avatar  avatar  avatar  avatar  avatar  avatar  avatar  avatar  avatar  avatar  avatar  avatar  avatar  avatar  avatar  avatar  avatar  avatar  avatar  avatar  avatar  avatar  avatar  avatar  avatar  avatar  avatar  avatar  avatar  avatar  avatar  avatar  avatar  avatar  avatar  avatar  avatar  avatar  avatar  avatar  avatar  avatar  avatar  avatar  avatar  avatar

Watchers

 avatar  avatar  avatar  avatar  avatar  avatar  avatar  avatar  avatar  avatar  avatar  avatar  avatar  avatar  avatar  avatar  avatar  avatar

auto_ts's Issues

Bug: Order of execution of some models changes results. Leakage of variables suspected.

ML results are coming out to be different if be use 'best' vs. if we use ['SARIMAX', 'ML']. Must be some leakage. Check and fix.

https://github.com/AutoViML/Auto_TS/blob/develop/auto_ts/test/test_auto_ts.py#L879-L882

# [left]:  [74.133644, 193.496506]  # Got this
# [right]: [76.037433, 193.496506]  # Expected this
# assert_frame_equal(automl_model.get_leaderboard().reset_index(drop=True).round(6), leaderboard_gold)

Error: Must Give Valid Time Interval Frequency

Following autots_multivariate_example.ipynb , importing osrs json data from runelite (data sample at the end).

When running model.fit I get the following error at the bottom (below the charts).

Time Interval is given as h
Error: You must give a valid time interval frequency from Pandas date-range frequency codes

Here is my setup -

ts_column = 'timestamp'
target = 'avgHighPrice'
time_interval='h'
sep = ','
train = dataset[:(len(dataset)-200)]
test = dataset[(len(dataset)-200):]
print(train.shape, test.shape)
model = auto_timeseries(
    score_type='rmse',
    model_type='best', 
    verbose=2,
   time_interval=time_interval)

model.fit(
    traindata=train,
    ts_column=ts_column,
    target=target,
    cv=200,
    sep=sep)

Example data

timestamp | avgHighPrice | avgLowPrice | highPriceVolume | lowPriceVolume | id
2021-07-25 13:00:00 | 341 | 334 | 237103 | 114893 | 25849
2021-07-25 14:00:00 | 345 | 334 | 250817 | 179962 | 25849
2021-07-25 15:00:00 | 346 | 334 | 117453 | 45003 | 25849
2021-07-25 16:00:00 | 332 | 326 | 443369 | 253239 | 25849

Prophet model is crashing with error 'metric_file' after upgrading the version also.

Prophet model is crashing with the error 'metric_file' after upgrading the version also. The error is below

Running Facebook Prophet Model...
    Fit-Predict data (shape=(1262, 2)) with Confidence Interval = 0.95...
  Starting Prophet Fit
      No seasonality assumed since seasonality flag is set to False
  Starting Prophet Cross Validation
Max. iterations using expanding window cross validation = 3

Fold Number: 1 --> Train Shape: 1247 Test Shape: 5
---------------------------------------------------------------------------
KeyError                                  Traceback (most recent call last)
KeyError: 'metric_file'

1

Can you please look into this issue?

Control Iterations for a final run on best model

Hi after running using 'best', have received the below message:
"Maximum number of iterations hit, may not be at an optima"

Is there a way to trigger a final run using the best model, or at least passing explicitly, while specifying a larger number of iterations to tune?
Currently seems too short.

UnboundLocalError: local variable 'forecast_df_folds' referenced before assignment

I referred #39 and upgraded auto_ts .
auto-ts version ---- 0.0.36
Issue still persists. Could you please help me out here?

Time Interval is given as D
Correct Time interval given as a valid Pandas date-range frequency...
WARNING: Running best models will take time... Be Patient...

==================================================
Building Prophet Model

Running Facebook Prophet Model...
Fit-Predict data (shape=(330, 2)) with Confidence Interval = 0.95...
Starting Prophet Fit
Adding daily seasonality to Prophet with period=12, fourier_order=15 and prior_scale=0.10
Starting Prophet Cross Validation
Max. iterations using expanding window cross validation = 3

Fold Number: 1 --> Train Shape: 315 Test Shape: 5
Exception occurred while building Prophet model...
'StanModel' object has no attribute 'fit_class'
FB Prophet may not be installed or Model is not running...

UnboundLocalError Traceback (most recent call last)
in
----> 1 model.fit(traindata=train[['Date','FWD, 97 %ile']], ts_column='Date', target='FWD, 97 %ile', cv=3)

~\Anaconda3\envs\fbenv\lib\site-packages\auto_ts_init_.py in fit(self, traindata, ts_column, target, sep, cv)
504
505 self.ml_dict[name]['model'] = model
--> 506 self.ml_dict[name]['forecast'] = forecast_df_folds
507 self.ml_dict[name][self.score_type] = score_val
508 self.ml_dict[name]['model_build'] = model_build

UnboundLocalError: local variable 'forecast_df_folds' referenced before assignment

Hello, I have problem issue with module 'dask.dataframe' has no attribute 'core'

image

Hello, I am a student who is trying to use this library for the first time.
There is a problem with using the library, so I want to leave my issue.

Currently, I'm trying to use this library using google COLAB, but I don't think any of the autos libraries have disk.dataframe.core.DataFrame deprescribed. Could you please check it? Or could you tell me which version of the disk I should use to use this library correctly?

In addition, data items are missing from the example of the Jupiter notebook presented as an example. I'd like you to confirm.

I admire the easy way to use this library.I really want to use this library. Please give me a quick.

Auto-ts crash when Building Prophet Model

Hi Sir,

the Auto-TS function crashes and kill the python kernel when building the prophet model.

error appeared when creating

Fold Number : 1 --> Train Shape: 54 Test Shape: 5


KeyError Traceback(most recent call last)
KeyError: 'metric_file'

Error while training auto_ts: Line search cannot locate an adequate point after 20 function and gradient evaluations

I'm getting this error, while running auto_ts model training on Sales_and_Marketing.csv

Tit   = total number of iterations
Tnf   = total number of function evaluations
Tnint = total number of segments explored during Cauchy searches
Skip  = number of BFGS updates skipped
Nact  = number of active bounds at final generalized Cauchy point
Projg = norm of the final projected gradient
F     = final function value

           * * *

   N    Tit     Tnf  Tnint  Skip  Nact     Projg        F
    9     29     32      1     0     0   2.301D-04   1.150D+01
  F =   11.498879635408754

CONVERGENCE: REL_REDUCTION_OF_F_<=_FACTR*EPSMCH
 This problem is unconstrained.
 This problem is unconstrained.
 This problem is unconstrained.
 This problem is unconstrained.

 Line search cannot locate an adequate point after 20 function
  and gradient evaluations.  Previous x, f and g restored.
 Possible causes: 1 error in function or gradient evaluation;
                  2 rounding error dominate computation.
 This problem is unconstrained.
 This problem is unconstrained.

 Bad direction in the line search;
   refresh the lbfgs memory and restart the iteration.
 This problem is unconstrained.

 Bad direction in the line search;
   refresh the lbfgs memory and restart the iteration.

 Bad direction in the line search;
   refresh the lbfgs memory and restart the iteration.
 This problem is unconstrained.

 Line search cannot locate an adequate point after 20 function
  and gradient evaluations.  Previous x, f and g restored.
 Possible causes: 1 error in function or gradient evaluation;
                  2 rounding error dominate computation.
 This problem is unconstrained.

 Line search cannot locate an adequate point after 20 function
  and gradient evaluations.  Previous x, f and g restored.
 Possible causes: 1 error in function or gradient evaluation;
                  2 rounding error dominate computation.
 This problem is unconstrained.
 This problem is unconstrained.
 This problem is unconstrained.

 Line search cannot locate an adequate point after 20 function
  and gradient evaluations.  Previous x, f and g restored.
 Possible causes: 1 error in function or gradient evaluation;
                  2 rounding error dominate computation.
 This problem is unconstrained.

 Bad direction in the line search;
   refresh the lbfgs memory and restart the iteration.

 Bad direction in the line search;
   refresh the lbfgs memory and restart the iteration.

 Line search cannot locate an adequate point after 20 function
  and gradient evaluations.  Previous x, f and g restored.
 Possible causes: 1 error in function or gradient evaluation;
                  2 rounding error dominate computation.
 This problem is unconstrained.

 Bad direction in the line search;
   refresh the lbfgs memory and restart the iteration.

 Warning:  more than 10 function and gradient
   evaluations in the last line search.  Termination
   may possibly be caused by a bad search direction.
 This problem is unconstrained.

 Line search cannot locate an adequate point after 20 function
  and gradient evaluations.  Previous x, f and g restored.
 Possible causes: 1 error in function or gradient evaluation;
                  2 rounding error dominate computation.
 This problem is unconstrained.
 This problem is unconstrained.
 This problem is unconstrained.
 This problem is unconstrained.
 This problem is unconstrained.

 Line search cannot locate an adequate point after 20 function
  and gradient evaluations.  Previous x, f and g restored.
 Possible causes: 1 error in function or gradient evaluation;
                  2 rounding error dominate computation.
 This problem is unconstrained.
 This problem is unconstrained.
 This problem is unconstrained.
 This problem is unconstrained.

 Line search cannot locate an adequate point after 20 function
  and gradient evaluations.  Previous x, f and g restored.
 Possible causes: 1 error in function or gradient evaluation;
                  2 rounding error dominate computation.
 This problem is unconstrained.

 Line search cannot locate an adequate point after 20 function
  and gradient evaluations.  Previous x, f and g restored.
 Possible causes: 1 error in function or gradient evaluation;
                  2 rounding error dominate computation.
 This problem is unconstrained.
 This problem is unconstrained.

 Line search cannot locate an adequate point after 20 function
  and gradient evaluations.  Previous x, f and g restored.
 Possible causes: 1 error in function or gradient evaluation;
                  2 rounding error dominate computation.
 This problem is unconstrained.

 Line search cannot locate an adequate point after 20 function
  and gradient evaluations.  Previous x, f and g restored.
 Possible causes: 1 error in function or gradient evaluation;
                  2 rounding error dominate computation.
 This problem is unconstrained.

 Line search cannot locate an adequate point after 20 function
  and gradient evaluations.  Previous x, f and g restored.
 Possible causes: 1 error in function or gradient evaluation;
                  2 rounding error dominate computation.
 This problem is unconstrained.
 This problem is unconstrained.
 This problem is unconstrained.
 This problem is unconstrained.
 This problem is unconstrained.

 Warning:  more than 10 function and gradient
   evaluations in the last line search.  Termination
   may possibly be caused by a bad search direction.
 This problem is unconstrained.
 This problem is unconstrained.
 This problem is unconstrained.
 This problem is unconstrained.
 This problem is unconstrained.
 This problem is unconstrained.
 This problem is unconstrained.

 Warning:  more than 10 function and gradient
   evaluations in the last line search.  Termination
   may possibly be caused by a bad search direction.
 This problem is unconstrained.
 This problem is unconstrained.
 This problem is unconstrained.
 This problem is unconstrained.
 This problem is unconstrained.
 This problem is unconstrained.
 This problem is unconstrained.
 This problem is unconstrained.
 This problem is unconstrained.
 This problem is unconstrained.
 This problem is unconstrained.
 This problem is unconstrained.
 This problem is unconstrained.
 This problem is unconstrained.
 This problem is unconstrained.
 This problem is unconstrained.

any idea, how to solve this issue?

model fit method throws error "local variable 'forecast_df_folds' referenced before assignment"

I installed the package using pip and then cloned the repo to test run the example notebook.
It throws the following error.
Start of Fit.....
Running Augmented Dickey-Fuller test with paramters:
maxlag: 5 regression: c autolag: BIC
Results of Augmented Dickey-Fuller Test:
+-----------------------------+------------------------------+
| | Dickey-Fuller Augmented Test |
+-----------------------------+------------------------------+
| Test Statistic | -3.2721577323655944 |
| p-value | 0.01616983190458116 |
| #Lags Used | 1.0 |
| Number of Observations Used | 43.0 |
| Critical Value (1%) | -3.5925042342183704 |
| Critical Value (5%) | -2.931549768951162 |
| Critical Value (10%) | -2.60406594375338 |
+-----------------------------+------------------------------+
this series is stationary
Target variable given as = Sales
Start of loading of data.....
Input is data frame. Performing Time Series Analysis
ts_column: Time Period sep: , target: Sales
Loaded pandas dataframe...
pandas Dataframe loaded successfully. Shape of data set = (45, 2)
chart frequency not known. Continuing...
Time Interval between observations has not been provided. Auto_TS will try to infer this now...
Time series input in days = 31
It is a Monthly time series.
WARNING: Running best models will take time... Be Patient...

==================================================
Building Prophet Model

Running Facebook Prophet Model...
Fit-Predict data (shape=(45, 3)) with Confidence Interval = 0.95...
Starting Prophet Fit
No seasonality assumed since seasonality flag is set to False
Starting Prophet Cross Validation
Max. iterations using expanding window cross validation = 3

Fold Number: 1 --> Train Shape: 30 Test Shape: 5
Root Mean Squared Error predictions vs actuals = 42.30
Std Deviation of actuals = 126.63
Normalized RMSE = 33%
Cross Validation window: 1 completed

Fold Number: 2 --> Train Shape: 35 Test Shape: 5
Root Mean Squared Error predictions vs actuals = 20.71
Std Deviation of actuals = 68.89
Normalized RMSE = 30%
Cross Validation window: 2 completed

Fold Number: 3 --> Train Shape: 40 Test Shape: 5
Root Mean Squared Error predictions vs actuals = 53.09
Std Deviation of actuals = 82.02
Normalized RMSE = 65%
Cross Validation window: 3 completed


Model Cross Validation Results:

MAE (as % Std Dev of Actuals) = 25.56%
MAPE (Mean Absolute Percent Error) = 5%
RMSE (Root Mean Squared Error) = 40.9755
Normalized RMSE (MinMax) = 11%
Normalized RMSE (as Std Dev of Actuals)= 31%

Time Taken = 6 seconds
Exception occurred while building Prophet model...
Prophet object can only be fit once. Instantiate a new object.
FB Prophet may not be installed or Model is not running...

UnboundLocalError Traceback (most recent call last)
in
----> 1 model.fit(
2 traindata=train,
3 ts_column=ts_column,
4 target=target,
5 cv=3,

~\Anaconda3\lib\site-packages\auto_ts_init_.py in fit(self, traindata, ts_column, target, sep, cv)
504
505 self.ml_dict[name]['model'] = model
--> 506 self.ml_dict[name]['forecast'] = forecast_df_folds
507 self.ml_dict[name][self.score_type] = score_val
508 self.ml_dict[name]['model_build'] = model_build

UnboundLocalError: local variable 'forecast_df_folds' referenced before assignment

Sometimes the forecast populates 'yhat', other times it populates 'mean'

Sometimes the forecast populates 'yhat', other times it populates 'mean', depending on the choice.

As a minor comment, a "hello world" example to predict the next value in a monthly or daily series would have unearthed this perhaps, and not leave the reader to guess which column is changed. Maybe I'm missing something but the intent of predict( ) isn't super clear in code or docs.

Reproduced here: https://github.com/microprediction/timeseries-notebooks/blob/main/auto_timeseries_hello.ipynb

local variable 'forecast_df_folds' referenced before assignment

Running into issue when running:

model.fit(
traindata=dataset,
# traindata=file_path, # Alternately, you can specify the file directly
ts_column=ts_column,
target=target,
cv=3,
sep=sep)

I get the error:
local variable 'forecast_df_folds' referenced before assignment

Exception occurred while building Prophet model...
Prophet object can only be fit once. Instantiate a new object.
FB Prophet may not be installed or Model is not running...
Traceback (most recent call last):

File "", line 33, in
model.fit(

File "C:\Users\myname\anaconda3\lib\site-packages\auto_ts_init_.py", line 506, in fit
self.ml_dict[name]['forecast'] = forecast_df_folds

UnboundLocalError: local variable 'forecast_df_folds' referenced before assignment

Cross Validation

Hi,

Thanks for the library

The Cross-Validation that your package is doing the standard k-fold Cross-Validation method or the one with rolling windows that is more appropriate for Time Series (e.g. as in here )

CV in time series?

My question is more on the theoretical side. I see that the 'model.fit' allows to set CV during algorithm training. Does the CV include random sampling and reshuffling during the training phase, or is it more like rolling-origin cross-validation, where the time chronology is maintained?

Thanks,
Rahul

Save Trained model

How can i save the model .I tried using pickle but its throwing error

local variable 'mean_cv_score' referenced before assignment


UnboundLocalError Traceback (most recent call last)
in
----> 1 model.fit( traindata=df_after, ts_column='Timestamp',target='Weighted_Price')

/usr/local/lib/python3.8/dist-packages/auto_ts/init.py in fit(self, traindata, ts_column, target, sep, cv)
750 print(f"Total time taken: {elapsed:.0f} seconds.")
751 print("-"*50 + "\n\n")
--> 752 print("Leaderboard with best model on top of list:\n",self.get_leaderboard())
753 return self
754

/usr/local/lib/python3.8/dist-packages/auto_ts/init.py in get_leaderboard(self, ascending)
904 # else: # Assuming List
905 # mean_cv_score = sum(cv_scores)/len(cv_scores)
--> 906 mean_cv_scores.append(mean_cv_score)
907
908 results = pd.DataFrame({"name": names, self.score_type: mean_cv_scores})

UnboundLocalError: local variable 'mean_cv_score' referenced before assignment


So I think the problem is around line 898 in init.py
897 elif isinstance(cv_scores, list): 898 if len(cv_scores) == 0: 899 mean_cv_score = np.inf 900 else: 901 mean_cv_score = self.__get_mean_cv_score(cv_scores) 902 # if isinstance(cv_scores, float): 903 # mean_cv_score = cv_scores 904 # else: # Assuming List 905 # mean_cv_score = sum(cv_scores)/len(cv_scores)
because it doesn't assign the value of mean_cv_score if len(cv_scores) is not equal to 0,I'm not an expert to this frame, but I saw a comment in line 905 says 'assuming list',maybe should put it below 899 like
897 elif isinstance(cv_scores, list): 898 if len(cv_scores) == 0: 899 mean_cv_score = np.inf 900 else: 901 mean_cv_score = sum(cv_scores)/len(cv_scores)

Just my guess

Variation in SARIMAX and Prophet forecast dates

When SARIMAX is the best output and the forecast period =12... it forecasts [defaultdict output] for 12 periods in the train data instead of 12 forward periods while Prophet includes 12 forward periods.

Best Model is:
SARIMAX
Best Model Forecasts: net_revenue mean mean_se mean_ci_lower mean_ci_upper
2018-07-31 3.080343 0.366081 2.362838 3.797848
2018-08-31 2.808159 0.366107 2.090602 3.525715
2018-09-30 2.893071 0.367888 2.172024 3.614118
2018-10-31 3.178024 0.375812 2.441446 3.914603
2018-11-30 3.154994 0.379846 2.410510 3.899477
2018-12-31 3.122128 0.381915 2.373588 3.870667
2019-01-31 2.917377 0.382981 2.166749 3.668006
2019-02-28 3.091802 0.383531 2.340096 3.843509
2019-03-31 3.260538 0.383815 2.508274 4.012801
2019-04-30 3.008322 0.383962 2.255770 3.760873
2019-05-31 3.490022 0.384038 2.737322 4.242723
2019-06-30 3.180734 0.384077 2.427956 3.933511
Best Model Score: 0.39

Add refit methods

Refit the models using the entire dataset

  • Prophet
  • ARIMA
  • SARIMAX
  • VAR
  • ML
  • PyFlux

UnboundLocalError: local variable 'forecast_df_folds' referenced before assignment

my auto-ts version is 0.0.37 and this happens again:

UnboundLocalError Traceback (most recent call last)
in
5
6 model = ATS(score_type='normalized_rmse',forecast_period=FORECAST_PERIOD,model_type='best', verbose=0)
----> 7 model.fit(traindata=train,ts_column=ts_column,target=target,cv=4)
8 future_predictions = model.predict(testdata=testdata,).reset_index()
9 auto_ts_pred[risk]=sum(future_predictions['yhat'])

~/opt/anaconda3/envs/auto-ts/lib/python3.8/site-packages/auto_ts/init.py in fit(self, traindata, ts_column, target, sep, cv)
504
505 self.ml_dict[name]['model'] = model
--> 506 self.ml_dict[name]['forecast'] = forecast_df_folds
507 self.ml_dict[name][self.score_type] = score_val
508 self.ml_dict[name]['model_build'] = model_build

Consistency in training models

On develop branch

Need to make it consistent.

All Models

  • Simple forecast returns a pandas series while complex forecast returns a DataFrame. Should all this be converted to a DataFrame?

ML Models

  • Index value needs to be made consistent with the other statsmodels.
     mean  mean_se  mean_ci_lower  mean_ci_upper
0  509.64      NaN            NaN            NaN
1  485.24      NaN            NaN            NaN
2  479.72      NaN            NaN            NaN
3  483.98      NaN            NaN            NaN
4  482.78      NaN            NaN            NaN
5  455.04      NaN            NaN            NaN
6  518.62      NaN            NaN            NaN
7  524.08      NaN            NaN            NaN

ARIMA Models

  • Index value needs to be made consistent with the other statsmodels.
  • Index is not named in ARIMA but named <ts_column> name in SARIMAX and VAR. Need to make consistent.
--------------------------------------------------
Predictions with ARIMA Model
--------------------------------------------------
               mean  mean_se  mean_ci_lower  mean_ci_upper
Forecast_1  801.787  57.7527     688.593352     914.979860
Forecast_2   743.16  85.4145     575.751035     910.569856
Forecast_3  694.388  106.628     485.400142     903.375149
Forecast_4  684.729  108.306     472.452535     897.006104
Forecast_5  686.702  108.454     474.135844     899.268748
Forecast_6  692.134  108.468     479.541600     904.726446
Forecast_7  698.594  108.469     485.999430     911.189096
Forecast_8   705.36  108.469     492.765266     917.955429
--------------------------------------------------
Predictions with SARIMAX Model
--------------------------------------------------
Sales             mean     mean_se  mean_ci_lower  mean_ci_upper
2013-09-01  803.316737   57.933329     689.769498     916.863976
2013-10-01  762.460940   79.971766     605.719158     919.202722
2013-11-01  718.358193   96.253327     529.705138     907.011248
2013-12-01  711.421305   96.180308     522.911365     899.931245
2014-01-01  719.362546   98.272104     526.752761     911.972331
2014-02-01  732.709819  100.930940     534.888812     930.530825
2014-03-01  747.576454  102.978924     545.741472     949.411437
2014-04-01  762.473494  104.292923     558.063121     966.883867
--------------------------------------------------
Predictions with VAR Model
--------------------------------------------------
Sales             mean     mean_se  mean_ci_lower  mean_ci_upper
2013-09-01  741.377909   61.808346     620.235777     862.520040
2013-10-01  676.233419   90.153283     499.536231     852.930608
2013-11-01  615.538721  105.173723     409.402012     821.675430
2013-12-01  571.797729  111.305204     353.643538     789.951919
2014-01-01  546.952783  113.044924     325.388803     768.516763
2014-02-01  537.342231  113.342418     315.195173     759.489289
2014-03-01  537.474487  113.443588     315.129140     759.819834
2014-04-01  542.307393  113.595165     319.664960     764.949825

Prophet Models

  • Currently Prophet model trains on the whole dataset, whereas SARIMAX trains on a train subset of the full data.
  • Also, Prophet model returns the RMSE which includes the training observations as well. Need to fix this.
  • predict function with simple=False returns 16 columns. See if this needs to be made consistent with the statistical models from statsmodels which return only 4 columns (mean, std err, lower ci, upper ci)
  • Index is called ds in prophet and <ts_column> name in statsmodels. Need to make consistent.
--------------------------------------------------
Predictions with Best Model (Prophet)
--------------------------------------------------
Building Forecast dataframe. Forecast Period = 8
           ds       trend  ...  multiplicative_terms_upper        yhat
40 2014-04-30  651.843432  ...                         0.0  749.061242
41 2014-05-31  657.531354  ...                         0.0  751.077262
42 2014-06-30  663.035794  ...                         0.0  796.892366
43 2014-07-31  668.723715  ...                         0.0  783.206733
44 2014-08-31  674.411637  ...                         0.0  689.698130
45 2014-09-30  679.916077  ...                         0.0  595.713426
46 2014-10-31  685.603998  ...                         0.0  569.486600
47 2014-11-30  691.108439  ...                         0.0  635.884371
--------------------------------------------------
Predictions with SARIMAX Model
--------------------------------------------------
Sales             mean     mean_se  mean_ci_lower  mean_ci_upper
2013-09-01  803.316737   57.933329     689.769498     916.863976
2013-10-01  762.460940   79.971766     605.719158     919.202722
2013-11-01  718.358193   96.253327     529.705138     907.011248
2013-12-01  711.421305   96.180308     522.911365     899.931245
2014-01-01  719.362546   98.272104     526.752761     911.972331
2014-02-01  732.709819  100.930940     534.888812     930.530825
2014-03-01  747.576454  102.978924     545.741472     949.411437
2014-04-01  762.473494  104.292923     558.063121     966.883867
--------------------------------------------------
Predictions with VAR Model
--------------------------------------------------
Sales             mean     mean_se  mean_ci_lower  mean_ci_upper
2013-09-01  741.377909   61.808346     620.235777     862.520040
2013-10-01  676.233419   90.153283     499.536231     852.930608
2013-11-01  615.538721  105.173723     409.402012     821.675430
2013-12-01  571.797729  111.305204     353.643538     789.951919
2014-01-01  546.952783  113.044924     325.388803     768.516763
2014-02-01  537.342231  113.342418     315.195173     759.489289
2014-03-01  537.474487  113.443588     315.129140     759.819834
2014-04-01  542.307393  113.595165     319.664960     764.949825
```

Out of sample forecast for SARIMAX

Hello,

Can you please give an example of out of sample forecast for SARIMAX?

When I try to set a forecast_period, as follows:

predicted = model.predict( testdata=24 )

I get the following error:

Forecast Period is not equal to the number of observations in testdata. The forecast period will be assumed to be the number of observations in testdata.
Out-of-sample forecasting in a model with a regression component requires additional exogenous values via the exog argument.
Model was trained with train dataframe. Please make sure you are passing a test data frame.

Looks like there are 3 messages that contradict each other:

  1. A forecast period I set is wrong (assuming it's ok to set one, it just needs to be equal to number of observations)
  2. I shouldn't use forecast_period, I need to use 'exog' for out of sample forecasting
  3. exog doesnt work either. I should use a data frame, as model was trained with it.

I'm a bit confused, maybe you have an example of forecasting for SARIMAX? Thank you!

Prophet: Quarterly forecast displays wrong dates

Using the prophet model to forecast QS dates seems to return the wrong dates. The data I have is formatted as a quarter start frequency e.g. '2017-03-01', '2017-6-01', but the predictions show intervals of 2018-01-01, 2018-04-01, 2018-07-01.

Screen Shot 2021-08-22 at 3 22 54 AM

Screen Shot 2021-08-22 at 3 22 05 AM

Why is Forecast Period = 5?

Hello!
try to predict future values, e.g. for next 7 days, but only 5 days for future is possible to predict. Last actual day is 15/08, so 1st day of prediction is 16/08, last day - 20/08.
image
Could you be so kind to let me know where it is possible to increase number of future periods? To predict from 16/08 till 22/08

BuildArima: Consistency of output

Predictions coming from ARIMA include extra information compared to SARIMAX and VAR. Need to make it consistent.

https://github.com/AutoViML/Auto_TS/blob/develop/auto_ts/models/ar_based/arima.py#L191-L191

ARIMA Models

  • Index value needs to be made consistent with the other statsmodels.
  • Index is not named in ARIMA but named <ts_column> name in SARIMAX and VAR. Need to make consistent.
--------------------------------------------------
Predictions with ARIMA Model
--------------------------------------------------
               mean  mean_se  mean_ci_lower  mean_ci_upper
Forecast_1  801.787  57.7527     688.593352     914.979860
Forecast_2   743.16  85.4145     575.751035     910.569856
Forecast_3  694.388  106.628     485.400142     903.375149
Forecast_4  684.729  108.306     472.452535     897.006104
Forecast_5  686.702  108.454     474.135844     899.268748
Forecast_6  692.134  108.468     479.541600     904.726446
Forecast_7  698.594  108.469     485.999430     911.189096
Forecast_8   705.36  108.469     492.765266     917.955429
--------------------------------------------------
Predictions with SARIMAX Model
--------------------------------------------------
Sales             mean     mean_se  mean_ci_lower  mean_ci_upper
2013-09-01  803.316737   57.933329     689.769498     916.863976
2013-10-01  762.460940   79.971766     605.719158     919.202722
2013-11-01  718.358193   96.253327     529.705138     907.011248
2013-12-01  711.421305   96.180308     522.911365     899.931245
2014-01-01  719.362546   98.272104     526.752761     911.972331
2014-02-01  732.709819  100.930940     534.888812     930.530825
2014-03-01  747.576454  102.978924     545.741472     949.411437
2014-04-01  762.473494  104.292923     558.063121     966.883867
--------------------------------------------------
Predictions with VAR Model
--------------------------------------------------
Sales             mean     mean_se  mean_ci_lower  mean_ci_upper
2013-09-01  741.377909   61.808346     620.235777     862.520040
2013-10-01  676.233419   90.153283     499.536231     852.930608
2013-11-01  615.538721  105.173723     409.402012     821.675430
2013-12-01  571.797729  111.305204     353.643538     789.951919
2014-01-01  546.952783  113.044924     325.388803     768.516763
2014-02-01  537.342231  113.342418     315.195173     759.489289
2014-03-01  537.474487  113.443588     315.129140     759.819834
2014-04-01  542.307393  113.595165     319.664960     764.949825

Biased estimation for Prophet

Updates made for Prophet till 8097292 were predominantly consistent with the other models in that they gave the same number of cv splits and number of observations in each split (for the most part). This was tested on some monthly datasets only.

However, there seemed to be some issue with it for other datasets as per @AutoViML. Hence the implementation was changed from this release.

However, this leads to 2 issues

  1. The number of CV folds for Prophet does not match that for other models now. One such example can be found here:

    # FIXME: Biased as 2 validation periods even when CV is not mentioned

  2. The number of observations in each fold does not match the forecast horizon as can be seen here where horizon is 8 but number of observations in the validation set of each fold is 13.

    # Biased estimate since it does not match other models in terms of

Ultimately, these 2 bugs will need to be fixed to get an unbiased comparison of all models in the AutoML flow.

__init__.py creating a a.any() and a.all() error message

During a model.fit() run, while doing an Auto Sarimax and encountering a possible np.inf event, it produces this error which halts the run:

`---------------------------------------------------------------------------
ValueError Traceback (most recent call last)
in
----> 1 model.fit(traindata=train_df, ts_column="Date", target="Sales", cv=3)

D:\Anaconda3\envs\ve_autots\lib\site-packages\auto_ts_init_.py in fit(self, traindata, ts_column, target, sep, cv)
750 print(f"Total time taken: {elapsed:.0f} seconds.")
751 print("-"*50 + "\n\n")
--> 752 print("Leaderboard with best model on top of list:\n",self.get_leaderboard())
753 return self
754

D:\Anaconda3\envs\ve_autots\lib\site-packages\auto_ts_init_.py in get_leaderboard(self, ascending)
893 cv_scores = model_dict_single_model.get(self.score_type)
894 #### This is quite complicated since we have to make sure it doesn't blow up
--> 895 if cv_scores == np.inf:
896 mean_cv_score = np.inf
897 elif isinstance(cv_scores, list):

ValueError: The truth value of an array with more than one element is ambiguous. Use a.any() or a.all()`

I fixed the issue by changing file init.py, source code line 895,

From this:
if cv_scores == np.inf:

to this:
if np.any(cv_scores) == np.inf:

Time Series column 'month' could not be converted to a Pandas date time column.

When fitting the model I got this error:

module 'dask.dataframe' has no attribute 'core'
Error: Could not convert Time Series column to an index. Please check your input and try again
Time Series column 'month' could not be converted to a Pandas date time column.
                    Please convert your input into a date-time column  and try again

My train_data has nothing but 2 columns; 'quantity' and 'month'. It is a monthly dataset and the month column was already a datetime64[ns] type

BuildProphet - Consistency of output

Prophet Model

  • predict function with simple=False returns 16 columns. See if this needs to be made consistent with the statistical models from statsmodels which return only 4 columns (mean, std err, lower ci, upper ci)
  • Index is called ds in prophet and <ts_column> name in statsmodels. Need to make consistent.
--------------------------------------------------
Predictions with Best Model (Prophet)
--------------------------------------------------
Building Forecast dataframe. Forecast Period = 8
           ds       trend  ...  multiplicative_terms_upper        yhat
40 2014-04-30  651.843432  ...                         0.0  749.061242
41 2014-05-31  657.531354  ...                         0.0  751.077262
42 2014-06-30  663.035794  ...                         0.0  796.892366
43 2014-07-31  668.723715  ...                         0.0  783.206733
44 2014-08-31  674.411637  ...                         0.0  689.698130
45 2014-09-30  679.916077  ...                         0.0  595.713426
46 2014-10-31  685.603998  ...                         0.0  569.486600
47 2014-11-30  691.108439  ...                         0.0  635.884371
--------------------------------------------------
Predictions with SARIMAX Model
--------------------------------------------------
Sales             mean     mean_se  mean_ci_lower  mean_ci_upper
2013-09-01  803.316737   57.933329     689.769498     916.863976
2013-10-01  762.460940   79.971766     605.719158     919.202722
2013-11-01  718.358193   96.253327     529.705138     907.011248
2013-12-01  711.421305   96.180308     522.911365     899.931245
2014-01-01  719.362546   98.272104     526.752761     911.972331
2014-02-01  732.709819  100.930940     534.888812     930.530825
2014-03-01  747.576454  102.978924     545.741472     949.411437
2014-04-01  762.473494  104.292923     558.063121     966.883867
--------------------------------------------------
Predictions with VAR Model
--------------------------------------------------
Sales             mean     mean_se  mean_ci_lower  mean_ci_upper
2013-09-01  741.377909   61.808346     620.235777     862.520040
2013-10-01  676.233419   90.153283     499.536231     852.930608
2013-11-01  615.538721  105.173723     409.402012     821.675430
2013-12-01  571.797729  111.305204     353.643538     789.951919
2014-01-01  546.952783  113.044924     325.388803     768.516763
2014-02-01  537.342231  113.342418     315.195173     759.489289
2014-03-01  537.474487  113.443588     315.129140     759.819834
2014-04-01  542.307393  113.595165     319.664960     764.949825
```

Modular Unit Tests

Break down the auto_ts unit tests into more modular unit tests. IT currently runs like regression tests and not unit tests

TODO

  • arima
  • auto_sarimax
  • var
  • Prophet
  • ml
  • Clean auto_ts tests to check for flow related issues only

Installation issues on Windows

Description of issue: Installation seems to fail on Windows machines.

Suspected reasons:

  1. The pip installer has difficulty building the fbprophet wheel because the dependencies aren't installed before the wheel is built (see related issue)

  2. Installation of fbprophet requires pystan. On Windows, Pystan requires a compiler. A pip install pystan command won't result in a proper installation on Windows. Instead, fbprophet recommends using Anaconda for installation (see fbprophet install docs)

I've attached some screenshots to show the errors during installation:

(initial try)
image

(after installing dependencies manually)
image
image

Additional Note: The issue shown in the second and third screen shot is probably tied to the C++ complier being referenced on my machine. This might work fine on other Windows machines (depending on local settings) however this isn't the point. The main point is that a note should be made in the installation directions to help those running windows.

ERROR: Failed building wheel for fbprophet

Hi, Can any one suggest right way to install the auto-ts package in python:3.9 version?

Tried:
pip install auto-ts
pip3 install auto-ts

I'm getting below error -
Building wheel for fbprophet (setup.py) ... error
ERROR: Command errored out with exit status 1:

Also I'm tried to install the fbprophet package, but didn't work.

Thanks!

ML model

Nice work! Just wondering, if in future, there will be additional ML models added like LSTM or CNN etc., other than what is currently present, which is Random Forest?

I actually encountered this error while "pip installing"

ERROR: Command errored out with exit status 1:

Recommend Projects

  • React photo React

    A declarative, efficient, and flexible JavaScript library for building user interfaces.

  • Vue.js photo Vue.js

    ๐Ÿ–– Vue.js is a progressive, incrementally-adoptable JavaScript framework for building UI on the web.

  • Typescript photo Typescript

    TypeScript is a superset of JavaScript that compiles to clean JavaScript output.

  • TensorFlow photo TensorFlow

    An Open Source Machine Learning Framework for Everyone

  • Django photo Django

    The Web framework for perfectionists with deadlines.

  • D3 photo D3

    Bring data to life with SVG, Canvas and HTML. ๐Ÿ“Š๐Ÿ“ˆ๐ŸŽ‰

Recommend Topics

  • javascript

    JavaScript (JS) is a lightweight interpreted programming language with first-class functions.

  • web

    Some thing interesting about web. New door for the world.

  • server

    A server is a program made to process requests and deliver data to clients.

  • Machine learning

    Machine learning is a way of modeling and interpreting data that allows a piece of software to respond intelligently.

  • Game

    Some thing interesting about game, make everyone happy.

Recommend Org

  • Facebook photo Facebook

    We are working to build community through open source technology. NB: members must have two-factor auth.

  • Microsoft photo Microsoft

    Open source projects and samples from Microsoft.

  • Google photo Google

    Google โค๏ธ Open Source for everyone.

  • D3 photo D3

    Data-Driven Documents codes.