Code Monkey home page Code Monkey logo

ng-apexcharts's People

Contributors

0xmattdoyle avatar coder-shanks avatar dalejodc avatar damingerdai avatar davidmarquezf avatar dependabot[bot] avatar djabif avatar ekorian avatar epelc avatar fouad-j avatar junedchhipa avatar kamleshkoringa avatar kover avatar ktanaka101 avatar kydronepilot avatar matthiee avatar micdenny avatar mjanatzek avatar mokeev1995 avatar morrisjdev avatar nileshbhagwat avatar ottopic avatar phhetz avatar pshields avatar rokerkony avatar sp90 avatar zip-fa avatar

Stargazers

 avatar  avatar  avatar  avatar  avatar  avatar  avatar  avatar  avatar  avatar  avatar  avatar  avatar  avatar  avatar  avatar  avatar  avatar  avatar  avatar  avatar  avatar  avatar  avatar  avatar  avatar  avatar  avatar  avatar  avatar  avatar  avatar  avatar  avatar  avatar  avatar  avatar  avatar  avatar  avatar  avatar  avatar  avatar  avatar  avatar  avatar  avatar  avatar  avatar  avatar  avatar  avatar  avatar  avatar  avatar  avatar  avatar  avatar  avatar  avatar  avatar  avatar  avatar  avatar  avatar  avatar  avatar  avatar  avatar  avatar  avatar  avatar  avatar  avatar  avatar  avatar  avatar  avatar  avatar  avatar  avatar  avatar  avatar  avatar  avatar  avatar  avatar  avatar  avatar  avatar  avatar  avatar  avatar  avatar  avatar  avatar  avatar  avatar  avatar  avatar

Watchers

 avatar  avatar  avatar  avatar  avatar  avatar  avatar

ng-apexcharts's Issues

Using ng-apexcharts within ionic

Hi when I try to use this module (in an ionic project), I get complaints that "ApexCharts" is not defined... I figure that is something to do with the script you are pointing to in the angular.json file - ionic projects don't have this file (and adding it doesn't seem to trigger anything.)
Do you know how I would define that instruction for an ionic build, I haven't managed to find anyone with similar issue. Trying to avoid using highcharts, apex is much more beautiful out of the box.
Thanks so much for your work so far!

ApexCharts is not defined

Hi, First of all, I congratulate you for this work. Great work! I wanted to use ng-apexcharts in my project. but I get this error. please help me..

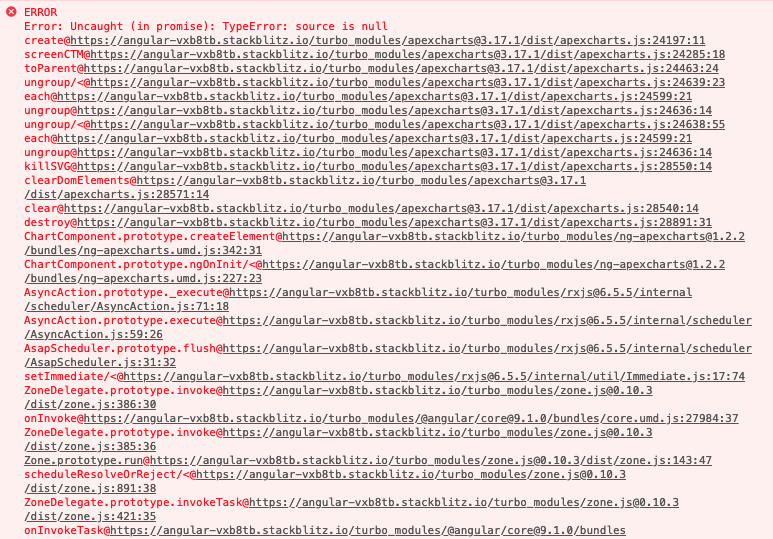
ReferenceError: ApexCharts is not defined
at ChartComponent.push../node_modules/ng-apexcharts/fesm5/ng-apexcharts.js.ChartComponent.createElement (ng-apexcharts.js:132)
at AsapAction. (ng-apexcharts.js:58)

app.module.ts:
import { NgApexchartsModule } from 'ng-apexcharts';

### Angular CLI:
{ "$schema": "./node_modules/@angular/cli/lib/config/schema.json", "version": 1, "newProjectRoot": "projects", "projects": { "ang-route1": { "root": "", "sourceRoot": "src", "projectType": "application", "prefix": "app", "schematics": {}, "architect": { "build": { "builder": "@angular-devkit/build-angular:browser", "options": { "outputPath": "dist/ang-route1", "index": "src/index.html", "main": "src/main.ts", "polyfills": "src/polyfills.ts", "tsConfig": "src/tsconfig.app.json", "assets": [ "src/favicon.ico", "src/assets" ], "styles": [ "src/styles.css" ], "scripts": [ "./node_modules/apexcharts/dist/apexcharts.min.js" ], "es5BrowserSupport": true }, "configurations": { "production": { "fileReplacements": [ { "replace": "src/environments/environment.ts", "with": "src/environments/environment.prod.ts" } ], "optimization": true, "outputHashing": "all", "sourceMap": false, "extractCss": true, "namedChunks": false, "aot": true, "extractLicenses": true, "vendorChunk": false, "buildOptimizer": true, "budgets": [ { "type": "initial", "maximumWarning": "2mb", "maximumError": "5mb" } ] } } }, "serve": { "builder": "@angular-devkit/build-angular:dev-server", "options": { "browserTarget": "ang-route1:build" }, "configurations": { "production": { "browserTarget": "ang-route1:build:production" } } }, "extract-i18n": { "builder": "@angular-devkit/build-angular:extract-i18n", "options": { "browserTarget": "ang-route1:build" } }, "test": { "builder": "@angular-devkit/build-angular:karma", "options": { "main": "src/test.ts", "polyfills": "src/polyfills.ts", "tsConfig": "src/tsconfig.spec.json", "karmaConfig": "src/karma.conf.js", "styles": [ "src/styles.css" ], "scripts": [], "assets": [ "src/favicon.ico", "src/assets" ] } }, "lint": { "builder": "@angular-devkit/build-angular:tslint", "options": { "tsConfig": [ "src/tsconfig.app.json", "src/tsconfig.spec.json" ], "exclude": [ "**/node_modules/**" ] } } } }, "ang-route1-e2e": { "root": "e2e/", "projectType": "application", "prefix": "", "architect": { "e2e": { "builder": "@angular-devkit/build-angular:protractor", "options": { "protractorConfig": "e2e/protractor.conf.js", "devServerTarget": "ang-route1:serve" }, "configurations": { "production": { "devServerTarget": "ang-route1:serve:production" } } }, "lint": { "builder": "@angular-devkit/build-angular:tslint", "options": { "tsConfig": "e2e/tsconfig.e2e.json", "exclude": [ "**/node_modules/**" ] } } } } }, "defaultProject": "ang-route1" }

### package.json :
"@angular/animations": "~7.2.0", "@angular/common": "~7.2.0", "@angular/compiler": "~7.2.0", "@angular/core": "~7.2.0", "@angular/forms": "~7.2.0", "@angular/platform-browser": "~7.2.0", "@angular/platform-browser-dynamic": "~7.2.0", "@angular/router": "~7.2.0", "apexcharts": "^3.6.7", "core-js": "^2.5.4", "ng-apexcharts": "^1.0.1", "popper.js": "^1.14.7", "rxjs": "~6.3.3", "tslib": "^1.9.0", "zone.js": "~0.8.26"

Issue with using candlestick chart

I've posted my issue with apex-chart as well just in case...

apexcharts/apexcharts.js#975

But for some reason, the xaxis tooltip is stuck in place. Also notice how when I zoom in, the candles do NOT scale accordingly. Please let me know if Im missing a config or if I have conflicting configs setup. See link above for config details.

stock_chart_issues

Timeline Datalabels not showing

Hello, I am working on using the Timeline chart in an Angular project. I am working off of this example provided in your documentation https://codesandbox.io/s/apx-timeline-colors-hrjlc?from-embed=&file=/src/app/app.component.ts:2277-2397 My issue is that the labels for the data do not appear when I configure dataLabels: { enabled: true } even though it works in the codesandbox.
image
I am using this config, which was copied from the above example with some small modifications

chartOptions = {
      series: [
        {
          data: [
            {
              x: 'Analysis',
              y: [new Date('2019-02-05').getTime(), new Date('2019-03-04').getTime()],
              fillColor: '#008FFB',
            },
            {
              x: 'Design',
              y: [new Date('2019-03-04').getTime(), new Date('2019-03-08').getTime()],
              fillColor: '#00E396',
            },
            {
              x: 'Coding',
              y: [new Date('2019-03-07').getTime(), new Date('2019-03-10').getTime()],
              fillColor: '#775DD0',
            },
            {
              x: 'Analysis',
              y: [new Date('2019-03-07').getTime(), new Date('2019-03-22').getTime()],
              fillColor: '#008FFB',
            },
            {
              x: 'Testing',
              y: [new Date('2019-03-08').getTime(), new Date('2019-03-12').getTime()],
              fillColor: '#FEB019',
            },
            {
              x: 'Deployment',
              y: [new Date('2019-03-12').getTime(), new Date('2019-03-17').getTime()],
              fillColor: '#FF4560',
            },
          ],
        },
      ],
      chart: {
        height: 350,
        type: 'rangeBar',
      },
      plotOptions: {
        bar: {
          horizontal: true,
          distributed: true,
          dataLabels: {
            hideOverflowingLabels: false,
          },
        },
      },
      dataLabels: {
        enabled: true,
        formatter: (val, opts) => {
          return  opts.w.globals.labels[opts.dataPointIndex];

        },
        style: {
          colors: ['#f3f4f5', '#fff']
        }
      },
      xaxis: {
        type: 'datetime',
        position: 'top',
        min: new Date('2019-02-01').getTime(),
        max: new Date('2019-04-01').getTime(),
        tickAmount: 4
      },
      yaxis: {
        show: true,
      },
    };

If there is any other information you would like me to provide please let me know

Possible Unhandled Promise Rejection: TypeError: "i.style is undefined"

I'm facing issue with this module
Possible Unhandled Promise Rejection: TypeError: "i.style is undefined"

value apexcharts.min.js:6 value apexcharts.min.js:6 value apexcharts.min.js:6 value apexcharts.min.js:6 value apexcharts.min.js:6 tt apexcharts.min.js:6 q apexcharts.min.js:6 value apexcharts.min.js:6 resizeTimer apexcharts.min.js:6 invokeTask7Angular

COde below
apexOpt = { chart: { type: 'line' }, series: [{ name: 'sales', data: [30,40,35,50,49,60,70,91,125] }], xaxis: { categories: [1991,1992,1993,1994,1995,1996,1997, 1998,1999] } }

<apx-chart [series]="apexOpt.series" [chart]="apexOpt.chart" [title]="'title'"></apx-chart>

Toolbar tools not working

Hi, I am currently having an issue getting toolbar options to appear e.g. ZOOMIN, ZOOMOUT. I have the following in my .ts file:

@ViewChild('chartObj') chartObj: ChartComponent;

  chart = {
    type: 'bar',
    toolbar: {
      show: true,
      tools: {
        download: true,
        selection: true,
        zoom: true,
        zoomin: true,
        zoomout: true,
        pan: true,
        customIcons: []
      },
      autoSelected: 'zoom' 
    },
  };
  series = [{
    name: 'sales',
    data: [30, 40, 35, 50, 49, 60, 70, 91, 125]
  }];
  xaxis = {
    categories: [1991, 1992, 1993, 1994, 1995, 1996, 1997, 1998, 1999]
  };

and HTML:

<apx-chart #chartObj [series]="series" [chart]="chart" [xaxis]="xaxis"></apx-chart>

Currently the graph renders with no errors but only the Download Menu Icon appears.

ANGULAR version 6.0.8

Cannot read property 'updateOptions' of undefined

Hi,

In some particular cases, when the root element property set on creation and I try to update chart options (in my case trying to set height), I got this:

ERROR TypeError: Cannot read property 'updateOptions' of undefined
    at ChartComponent.push../node_modules/ng-apexcharts/fesm5/ng-apexcharts.js.ChartComponent.updateOptions (ng-apexcharts.js:156). 

The chart object inside ng-apexcharts created using setTimeout and because setTimeout has a delay, minimum 4ms as described in specs, I should use something like this setTimeout(callbackFn, 5). In here asapScheduler, Promise.resolve().then() or window.postMessage can be used for decrease delay.

I've cloned your repo and tried these changes using Promises and asapScheduler - works fine.

TypeError: r.node.getBBox is not a function

Hey @junedchhipa, I hope you're doing well. Since our team implemented the apex-chart all our unit tests (for components that uses apex) get failed.

Uncaught (in promise): TypeError: r.node.getBBox is not a function
    TypeError: r.node.getBBox is not a function

      at new create (../../node_modules/apexcharts/dist/apexcharts.common.js:6:363832)
      at create.bbox (../../node_modules/apexcharts/dist/apexcharts.common.js:6:364039)
      at t.value (../../node_modules/apexcharts/dist/apexcharts.common.js:6:25530)
      at ../../node_modules/apexcharts/dist/apexcharts.common.js:6:168277
          at Array.map (<anonymous>)
      at t.value (../../node_modules/apexcharts/dist/apexcharts.common.js:6:167680)
      at t.value (../../node_modules/apexcharts/dist/apexcharts.common.js:6:172523)
      at t.value (../../node_modules/apexcharts/dist/apexcharts.common.js:6:171960)
      at t.value (../../node_modules/apexcharts/dist/apexcharts.common.js:14:38662)
      at t.create (../../node_modules/apexcharts/dist/apexcharts.common.js:6:3406)
      at ../../node_modules/apexcharts/dist/apexcharts.common.js:14:37322
      at new ZoneAwarePromise (../../node_modules/zone.js/dist/zone.js:931:29)
      at t.value (../../node_modules/apexcharts/dist/apexcharts.common.js:14:36815)
      at ChartComponent.Object.<anonymous>.ChartComponent.render (../../node_modules/ng-apexcharts/bundles/ng:/ng-apexcharts/lib/chart/chart.component.ts:172:26)
      at ChartComponent.Object.<anonymous>.ChartComponent.createElement (../../node_modules/ng-apexcharts/bundles/ng:/ng-apexcharts/lib/chart/chart.component.ts:168:10)
      at AsapAction.work (../../node_modules/ng-apexcharts/bundles/ng:/ng-apexcharts/lib/chart/chart.component.ts:85:12)
      at AsapAction.Object.<anonymous>.AsyncAction._execute (../../node_modules/rxjs/src/internal/scheduler/AsyncAction.ts:122:12)
      at AsapAction.Object.<anonymous>.AsyncAction.execute (../../node_modules/rxjs/src/internal/scheduler/AsyncAction.ts:97:24)
      at AsapScheduler.Object.<anonymous>.AsapScheduler.flush (../../node_modules/rxjs/src/internal/scheduler/AsapScheduler.ts:17:26)
      at runIfPresent (../../node_modules/rxjs/src/internal/util/Immediate.ts:8:5)
      at ../../node_modules/rxjs/src/internal/util/Immediate.ts:16:34
      at ZoneDelegate.Object.<anonymous>.ZoneDelegate.invoke (../../node_modules/zone.js/dist/zone.js:391:26)
      at ProxyZoneSpec.Object.<anonymous>.ProxyZoneSpec.onInvoke (../../node_modules/zone.js/dist/proxy.js:129:39)
      at ZoneDelegate.Object.<anonymous>.ZoneDelegate.invoke (../../node_modules/zone.js/dist/zone.js:390:52)
      at Object.onInvoke (../../../packages/core/src/zone/ng_zone.ts:273:25)
      at ZoneDelegate.Object.<anonymous>.ZoneDelegate.invoke (../../node_modules/zone.js/dist/zone.js:390:52)
      at Zone.Object.<anonymous>.Zone.run (../../node_modules/zone.js/dist/zone.js:150:43)
      at ../../node_modules/zone.js/dist/zone.js:910:34
      at ZoneDelegate.Object.<anonymous>.ZoneDelegate.invokeTask (../../node_modules/zone.js/dist/zone.js:423:31)
      at ProxyZoneSpec.Object.<anonymous>.ProxyZoneSpec.onInvokeTask (../../node_modules/zone.js/dist/proxy.js:160:39)
      at ZoneDelegate.Object.<anonymous>.ZoneDelegate.invokeTask (../../node_modules/zone.js/dist/zone.js:422:60)
      at Object.onInvokeTask (../../../packages/core/src/zone/ng_zone.ts:262:25)
      at ZoneDelegate.Object.<anonymous>.ZoneDelegate.invokeTask (../../node_modules/zone.js/dist/zone.js:422:60)
      at Zone.Object.<anonymous>.Zone.runTask (../../node_modules/zone.js/dist/zone.js:195:47)
      at drainMicroTaskQueue (../../node_modules/zone.js/dist/zone.js:601:35)
      at resolvePromise (../../node_modules/zone.js/dist/zone.js:852:31)
      at new ZoneAwarePromise (../../node_modules/zone.js/dist/zone.js:934:17)
      at t.value (../../node_modules/apexcharts/dist/apexcharts.common.js:14:36815)
      at ChartComponent.Object.<anonymous>.ChartComponent.render (../../node_modules/ng-apexcharts/bundles/ng:/ng-apexcharts/lib/chart/chart.component.ts:172:26)
      at ChartComponent.Object.<anonymous>.ChartComponent.createElement (../../node_modules/ng-apexcharts/bundles/ng:/ng-apexcharts/lib/chart/chart.component.ts:168:10)
      at AsapAction.work (../../node_modules/ng-apexcharts/bundles/ng:/ng-apexcharts/lib/chart/chart.component.ts:85:12)
      at AsapAction.Object.<anonymous>.AsyncAction._execute (../../node_modules/rxjs/src/internal/scheduler/AsyncAction.ts:122:12)
      at AsapAction.Object.<anonymous>.AsyncAction.execute (../../node_modules/rxjs/src/internal/scheduler/AsyncAction.ts:97:24)
      at AsapScheduler.Object.<anonymous>.AsapScheduler.flush (../../node_modules/rxjs/src/internal/scheduler/AsapScheduler.ts:17:26)
      at runIfPresent (../../node_modules/rxjs/src/internal/util/Immediate.ts:8:5)
      at ../../node_modules/rxjs/src/internal/util/Immediate.ts:16:34
      at ZoneDelegate.Object.<anonymous>.ZoneDelegate.invoke (../../node_modules/zone.js/dist/zone.js:391:26)
      at ProxyZoneSpec.Object.<anonymous>.ProxyZoneSpec.onInvoke (../../node_modules/zone.js/dist/proxy.js:129:39)
      at ZoneDelegate.Object.<anonymous>.ZoneDelegate.invoke (../../node_modules/zone.js/dist/zone.js:390:52)
      at Object.onInvoke (../../../packages/core/src/zone/ng_zone.ts:273:25)
      at ZoneDelegate.Object.<anonymous>.ZoneDelegate.invoke (../../node_modules/zone.js/dist/zone.js:390:52)
      at Zone.Object.<anonymous>.Zone.run (../../node_modules/zone.js/dist/zone.js:150:43)
      at ../../node_modules/zone.js/dist/zone.js:910:34
      at ZoneDelegate.Object.<anonymous>.ZoneDelegate.invokeTask (../../node_modules/zone.js/dist/zone.js:423:31)
      at ProxyZoneSpec.Object.<anonymous>.ProxyZoneSpec.onInvokeTask (../../node_modules/zone.js/dist/proxy.js:160:39)
      at ZoneDelegate.Object.<anonymous>.ZoneDelegate.invokeTask (../../node_modules/zone.js/dist/zone.js:422:60)
      at Object.onInvokeTask (../../../packages/core/src/zone/ng_zone.ts:262:25)
      at ZoneDelegate.Object.<anonymous>.ZoneDelegate.invokeTask (../../node_modules/zone.js/dist/zone.js:422:60)
      at Zone.Object.<anonymous>.Zone.runTask (../../node_modules/zone.js/dist/zone.js:195:47)
      at drainMicroTaskQueue (../../node_modules/zone.js/dist/zone.js:601:35)

Custom Tooltip issue with capturing component variables

Hello,

I was trying to make a custom tooltip but the one that can show some variable values from my Angular component - but, it doesn't work.

Since it's pretty hard to explain in writing, I have forked yours area-basic CodeSandbox here and added tooltip config.

You can check src/App/app.component.ts on line 84 that custom tooltip function getTooltip1 is set and working, but if you try and change it to getTooltip2 it doesn't work because this.message is undefined when called from ApexCharts...

Could you please look at that example and see if there is a solution to this issue?

Thank you

error when wanting to create a chart

After following the installation steps, I added the following:

HTML:
<apx-chart #chartObj>

TS:
import {ChartComponent} from 'ng-apexcharts';

myClass() {
@ViewChild('chartObj') charter: ChartComponent;

anyFunc() {
const options = { ....... }
const chart = new ApexCharts(this.charter, options);
chart.render();
}
}

The error I have is the following:
captura

Any idea what is happening? I already loaded the scripts to angular.json and imported NgApexchartsModule in my module:
import {NgApexchartsModule} from 'ng-apexcharts';

From already thank you very much!

Cannot find module 'ng-apexcharts'

HI i first of all thanks for the angular wrapper. Great work. I thought of using the library for one of my projects and i get the following error when i try to import the module into the application as follows.

import { AppComponent } from './app.component';
import { NgApexchartsModule } from 'ng-apexcharts';

ERROR in src/app/app.module.ts(14,36): error TS2307: Cannot find module 'ng-apexcharts'

image

I have followed the same steps as mentioned in the the docs and it doesnt seem to be working. Can you please look into the issue and let me know if there are any workarounds/Solution for this. Thanks.

My working environment:

Package JSON:

"@angular/animations": "~7.0.0",
    "@angular/common": "~7.0.0",
    "@angular/compiler": "~7.0.0",
    "@angular/core": "~7.0.0",
    "@angular/forms": "~7.0.0",
    "@angular/http": "~7.0.0",
    "@angular/platform-browser": "~7.0.0",
    "@angular/platform-browser-dynamic": "~7.0.0",
    "@angular/router": "~7.0.0",
    "apexcharts": "^3.6.4",
    "core-js": "^2.5.4",
    "ng-apexcharts": "^1.0.0",
    "rxjs": "~6.3.3",
    "zone.js": "~0.8.26"

Angular CLi

{
  "$schema": "./node_modules/@angular/cli/lib/config/schema.json",
  "version": 1,
  "newProjectRoot": "projects",
  "projects": {
    "try": {
      "root": "",
      "sourceRoot": "src",
      "projectType": "application",
      "prefix": "app",
      "schematics": {
        "@schematics/angular:component": {
          "styleext": "scss"
        }
      },
      "architect": {
        "build": {
          "builder": "@angular-devkit/build-angular:browser",
          "options": {
            "outputPath": "dist/try",
            "index": "src/index.html",
            "main": "src/main.ts",
            "polyfills": "src/polyfills.ts",
            "tsConfig": "src/tsconfig.app.json",
            "assets": [
              "src/favicon.ico",
              "src/assets"
            ],
            "styles": [
              "src/styles.scss"
            ],
            "scripts": [
              "node_modules/apexcharts/dist/apexcharts.min.js"
            ]
          },
          "configurations": {
            "production": {
              "fileReplacements": [
                {
                  "replace": "src/environments/environment.ts",
                  "with": "src/environments/environment.prod.ts"
                }
              ],
              "optimization": true,
              "outputHashing": "all",
              "sourceMap": false,
              "extractCss": true,
              "namedChunks": false,
              "aot": true,
              "extractLicenses": true,
              "vendorChunk": false,
              "buildOptimizer": true,
              "budgets": [
                {
                  "type": "initial",
                  "maximumWarning": "2mb",
                  "maximumError": "5mb"
                }
              ]
            }
          }
        },
        "serve": {
          "builder": "@angular-devkit/build-angular:dev-server",
          "options": {
            "browserTarget": "try:build"
          },
          "configurations": {
            "production": {
              "browserTarget": "try:build:production"
            }
          }
        },
        "extract-i18n": {
          "builder": "@angular-devkit/build-angular:extract-i18n",
          "options": {
            "browserTarget": "try:build"
          }
        },
        "test": {
          "builder": "@angular-devkit/build-angular:karma",
          "options": {
            "main": "src/test.ts",
            "polyfills": "src/polyfills.ts",
            "tsConfig": "src/tsconfig.spec.json",
            "karmaConfig": "src/karma.conf.js",
            "styles": [
              "src/styles.scss"
            ],
            "scripts": [
              "node_modules/apexcharts/dist/apexcharts.min.js"
            ],
            "assets": [
              "src/favicon.ico",
              "src/assets"
            ]
          }
        },
        "lint": {
          "builder": "@angular-devkit/build-angular:tslint",
          "options": {
            "tsConfig": [
              "src/tsconfig.app.json",
              "src/tsconfig.spec.json"
            ],
            "exclude": [
              "**/node_modules/**"
            ]
          }
        }
      }
    },
    "try-e2e": {
      "root": "e2e/",
      "projectType": "application",
      "prefix": "",
      "architect": {
        "e2e": {
          "builder": "@angular-devkit/build-angular:protractor",
          "options": {
            "protractorConfig": "e2e/protractor.conf.js",
            "devServerTarget": "try:serve"
          },
          "configurations": {
            "production": {
              "devServerTarget": "try:serve:production"
            }
          }
        },
        "lint": {
          "builder": "@angular-devkit/build-angular:tslint",
          "options": {
            "tsConfig": "e2e/tsconfig.e2e.json",
            "exclude": [
              "**/node_modules/**"
            ]
          }
        }
      }
    }
  },
  "defaultProject": "try"
}

Chart is not being destroyed when parent component destroyed

When you destroy a parent component that has an <apx-chart> in it, the underlying ApexChart is not being destroyed. That causes errors on page resize since the component is still active but not on the DOM anymore. It's also causing a memory leak.

Here's a Stackblitz link for the reproduction: Stackblitz

To reproduce the issue;

  1. Open the Console from your browser's dev tools since Stackblitz's console doesn't catch the error.
  2. Go to Route1 to initialize the chart
  3. Go to Route2 and then resize the preview pane.
  4. Errors will be printed on the console

In the example, if I destroy the ChartComponent manually on Route1Component's ngOnDestroy hook, everything works perfectly fine.

Is there a reason that the

this.chartObj.destroy();

is not being called on ngOnDestroy of the ChartComponent?

I've also checked the Vue wrapper of the ApexCharts and it seems that the chart.destroy() method is being called on the beforeDestroy() lifecycle hook of the component to properly destroy the chart: vue-apexcharts component #L61

changes in type ApexXAxis and ApexLegend

I have faced issue while changing colors of x axis labels and legend labels colors with predefined types , so i have done changes in types and its working now.
In ApexLegend it should be
colors:string[ ] | string instead of colors:string

In ApexXAxis it should be
colors? :string[ ] | string instead of colors? :string[ ]

TypeError: e.setAttribute is not a function when try to call dataURI() method or download the chart as PNG

Hi guys!

I have an issue with downloading chart both through the toolbar button and forming chart as a base64 string through dataURI() method. This issue appears with the last version of Apex Charts (3.17.0). With version 3.15.0 everything works fine.

core.js:6185 ERROR Error: Uncaught (in promise): TypeError: e.setAttribute is not a function TypeError: e.setAttribute is not a function at t.value (apexcharts.esm.js:6) at apexcharts.esm.js:6 at new ZoneAwarePromise (zone-evergreen.js:960) at t.value (apexcharts.esm.js:6) at t.value (apexcharts.esm.js:14) at ChartComponent.dataURI (ng-apexcharts.js:280) at VehicleAnalyticsComponent.sendViaEmail (vehicle-analytics.component.ts:238) at VehicleAnalyticsComponent_mat_tab_46_div_4_Template_button_click_1_listener (vehicle-analytics.component.html:118) at executeListenerWithErrorHandling (core.js:21693) at wrapListenerIn_markDirtyAndPreventDefault (core.js:21735) at resolvePromise (zone-evergreen.js:798) at resolvePromise (zone-evergreen.js:750) at zone-evergreen.js:860 at ZoneDelegate.invokeTask (zone-evergreen.js:399) at Object.onInvokeTask (core.js:41264) at ZoneDelegate.invokeTask (zone-evergreen.js:398) at Zone.runTask (zone-evergreen.js:167) at drainMicroTaskQueue (zone-evergreen.js:569) at ZoneTask.invokeTask [as invoke] (zone-evergreen.js:484) at invokeTask (zone-evergreen.js:1621)

Missing types

Trying to use fontWeight on ApexTitleSubtitle.

I can see this is now added in the source code, but when will 1.2.1 will be released please?

Graph in Angular Material tabs throws error when resizing (needs destroy())

Hi, I have a graph that is contained in an Angular Material tab. Resizing etc. works perfectly while in that tab however if I navigate to another tab and resize the window it throws the following error from the previous graph:

Error: <path> attribute d: Expected number, "M NaN NaN A 0 0 …"
Error: <path> attribute d: Expected number, "M NaN NaN A 0 1 …"
Error: <g> attribute transform: Expected number, "translate(NaN, NaN) scale(…"
Error: <g> attribute transform: Expected number, "translate(NaN, 20)".

I suspect this error is being caused by the graph not being destroyed correctly by the component lifecycle hooks. I have confirmed that when navigating to another tab that the graph-containing tab is destroyed (using ngIf) however it appears the graph remains.

So i tried to use the .destroy() method outlined here:
https://apexcharts.com/docs/methods/#destroy

with the following code:

@ViewChild('columnChartObj') columnChartObj: ChartComponent;
this.columnChartObj.chart.destroy();

however it seems the destroy method has not been implemented yet. Is that correct of have i misunderstood something?

Angular 9 compatibility

Hi,

can you add compatibility with Angular 9?
Currently when I'm doing npm install I'm getting those warnings:

npm WARN [email protected] requires a peer of @angular/common@^8.0.0 but none is installed. You must install peer dependencies yourself.
npm WARN [email protected] requires a peer of @angular/core@^8.0.0 but none is installed. You must install peer dependencies yourself.

Thank you in advance.

Update ApexTooltip interface to support enabledOnSeries property

Hi, this is my first time ever submitting an issue to an open source project. Please feel free to delete if unnecessary.

Issue: ApexTooltip does not support the correct type for the enabledOnSeries property

Currently: export interface ApexTooltip { ... enabledOnSeries?: undefined | boolean; ... }

Apex Docs: https://apexcharts.com/docs/options/tooltip/

enabledOnSeries: Array
Show tooltip only on certain series in a multi-series chart. Provide indices of those series which you would like to be shown.

On click call another function

 this.chartOptions = {
      series: [],
        chart: {
          background: '#ffffff',
        type: 'bar',
        height: 'auto',
        toolbar: {
          show: false
        },
        zoom: {
          enabled: false
        },
        events: {
          click(event, chartContext, config) {
            console.log(config.seriesIndex);
            console.log(config.dataPointIndex); 
            this.getProcessData(config.seriesIndex, config.dataPointIndex);
          }
        }
      },

I cannot call another function (ERROR TypeError: this.getProcessData is not a function)

Create/update changelog

For people wondering if the latest release would introduce any breaking change that might break their code would be very useful to have a changelog

angular 8/9 + ivy problem

Hello,

I have problem with ng-apexcharts and angular 8 or 9 with ivy compiler.
Let's say I have the template:

<apx-chart
  [chart]="data.options.chart"
  [labels]="data.options.labels"
  [legend]="data.options.legend"
  [dataLabels]="data.options.dataLabels"
  [series]="data.series"
></apx-chart>

and configuration:

  data = {
    options: {
      dataLabels: {
        enabled: false,
      },
      legend: {
        position: 'bottom',
      },
      labels: ['AirBnB', 'Booking', 'Booking'],
      chart: {
        height: '360',
        type: 'donut'
      },
    },
    series: [55, 35, 10]
  };

Everything is extremely easy.
But when I use that with ivy compiler (doesn't matter 8 or 9 version of angular) then I got an error:

ERROR in src/app/panel/statistics/statistics.component.html:2:3 - error TS2322: Type '{ height: string; type: string; }' is not assignable to type 'ApexChart'.
  Types of property 'type' are incompatible.
    Type 'string' is not assignable to type 'ChartType'.

2   [chart]="data.options.chart"
    ~~~~~~~~~~~~~~~~~~~~~~~~~~~~

  src/app/panel/statistics/statistics.component.ts:6:16
    6   templateUrl: './statistics.component.html',
                     ~~~~~~~~~~~~~~~~~~~~~~~~~~~~~
    Error occurs in the template of component StatisticsComponent.
src/app/panel/statistics/statistics.component.html:4:3 - error TS2322: Type '{ position: string; }' is not assignable to type 'ApexLegend'.
  Types of property 'position' are incompatible.
    Type 'string' is not assignable to type '"bottom" | "top" | "right" | "left"'.

4   [legend]="data.options.legend"
    ~~~~~~~~~~~~~~~~~~~~~~~~~~~~~~

  src/app/panel/statistics/statistics.component.ts:6:16
    6   templateUrl: './statistics.component.html',
                     ~~~~~~~~~~~~~~~~~~~~~~~~~~~~~
    Error occurs in the template of component StatisticsComponent.

Can you help me with that?

Resize

Hello, check this issue on apexchartsjs: apexcharts/apexcharts.js#330, I facing the same throuble with ng-apexcharts.
For some reason, my chart doesn't resize when my div resize. If I use devtools and resize reduce the screen size, the chart update size.

Performance for large dataset

Hi.. I am using an apex chart with multiple Y axis. Today I have a problem with large data set. It works perfectly if my dataset is less than 100 points for each line chart. But above that, it stuck to load data and some time after page becomes unresponsive. On the features page of apexcharts(https://apexcharts.com/features/), they have shown support of rendering a large number of data points. (25000 point) but I cant . For showing the problem, I used the below stackblitz page.

https://stackblitz.com/edit/ngapexcharts-demo

Just replace below function in demo,

addSeries() {
  this.data = []
  this.xData = []

  for(var i=0;i<10000;i++){
    this.data.push(new FormControl(this.getRandomArbitrary(0, 100)))
    this.xData.push(new FormControl(i))
  }

  this.form = new FormGroup({
      title: new FormControl('Basic Chart'),
      type: new FormControl('line'),
      height: new FormControl(350),
      series: new FormArray([
        new FormGroup({
          name: new FormControl('Series'),
          type: new FormControl('line'),
          data: new FormArray(this.data)
        })
      ]),
      xaxis: new FormArray(this.xData)
    });
  }

and click on Add series button.
Will you please help me regarding this problem?
Thanks in advance..!!

'schedule' of undefined

template code

<apx-chart #chart
                           [series]="[{name: 'test', data: [1, 2, 3]}]"
                           [xaxis]="{ categories: ['Jan', 'Feb', 'Mar'] }"
                           [chart]="chartx"
                           [grid]="gridx"
                           [title]="{ text: 'Title' }"
                           [stroke]="{curve: 'straight'}"
                           [dataLabels]="{enabled: false}"
                           [autoUpdateSeries]="false"></apx-chart>

js code

@ViewChild('chart') chart: ChartComponent;

  chartx = {
    height: 350,
    type: 'line',
    zoom: {
      enabled: false
    },
    shadow: {
      enabled: true,
      color: '#000',
      top: 18,
      left: 7,
      blur: 10,
      opacity: 1
    }
  };

  gridx = {
    row: {
      colors: ['#f3f3f3', 'transparent'],
      opacity: 0.5
    }
  };

ERROR TypeError: Cannot read property 'schedule' of undefined
at ChartComponent.ngOnChanges (ng-apexcharts.js:46)

Hi, I just tries to use Apex, and I got this problem, anyone knows why? how to fix?
Thanks.Regards.

maybe relevant? #5 @kover

Unable to load huge data into heat map

Heatmap chart is not able to load large amount of the data i.e 20000 like that. The whole application is getting stuck. There is no issue with api call or data format. All are working fine untill when the chart is loading data rhe whole application is freezing.

Feature Request: stroke - line charts -dash line

Hi - We are trying to create a line chart showing predictive vs historical data, this is my sample series data
{date: "2017-08-01T00:00:00.000Z", WaterLevel: -72.85, datatype: "historical"}
{date: "2017-09-01T00:00:00.000Z", WaterLevel: -77.63, datatype: "historical"}
{date: "2017-10-01T00:00:00.000Z", WaterLevel: -78.6932173137006, datatype: "historical"}
{date: "2019-10-01T00:00:00.000Z", WaterLevel: -61.6932173137006, datatype: "predictive"}
{date: "2019-10-01T00:00:00.000Z", WaterLevel: -50.6932173137006, datatype: "predictive"}

In the sample screenshot I provided, the solid line represents the historical data and the dotted line is the predictive data, would it be possible for stroke property to access this "datatype" property in my series so that I could plot the predictive data as dotted lines, and plot the historical data as a solid line (same as what I have on my attached screenshot).. thanks in advance for your help

Screenshot 2020-04-01 at 10 20 40 AM

Issue with Apex plot options.

HELLO, I am using your NG-APEXCHARTS library. Thank you very much for this. I have found a Bug , it would be great if you could fix this. So, the bug is about the Apex plot options of the Radial bar chart. It has an option to give Dropshadow, however, this option is not present in the angular library, that option is throwing an error and also it is getting rendered to and casting a shadow.

Support Angular 8

Hi,

can you support Angular 8 as well?
Now I have:

npm WARN [email protected] requires a peer of @angular/common@^7.1.0 but none is installed. You must install peer dependencies yourself.
npm WARN [email protected] requires a peer of @angular/core@^7.1.0 but none is installed. You must install peer dependencies yourself.

Thank you!

ApexTooltip interface is incorrect

Specifically this section:

y?: {
        show?: boolean;
        title?: {
            formatter?(seriesName: string): string;
        };
        formatter?(val: number): string;
    };

should be

y?: {
        show?: boolean;
        title?: {
            formatter?(seriesName: string): string;
        };
        formatter?(val: number, { series, seriesIndex, dataPointIndex, w }): string;
    };

Dynamically load apexcharts

Hi, can the apexcharts js be dynamically / lazy loaded? It's a large file and not needed on all pages. Would be good if it can be loaded on demand just as required like a few other angular libs.

Pass options object - Feature Request

Great work on this and apex charts in general, really appreciate the hardwork and love charts. I was just wondering why the decision was made that instead of passing an single Options object to cover all configuration, that we have to pass/bind each type of option (chart, series, legend etc).

It would be easier to consume the apex charts demos if the angular component followed the same pattern of a single options object.

So instead of:

<apx-chart [series]="chartData" [legend]="lengend" [labels]="labels" [chart]="chart" [plotOptions]="plotOptions" [fill]="fill">

we would have:

<apx-chart [options]="options">

I've taken a look at the code and see that once the chart is initialized it does build this options object, so why not allow passing it directly?

If you're open to pull requests, let me know and I'll try and make the change but wanted your thoughts before doing so.

Updating series/labels causing the chart to disappear after a while

I have used sample at https://codesandbox.io/s/apx-donut-simple-8fnji?from-embed but since it is quiet unrealistic (no one provides the chart data inside the constructor) I have made it a little bit more real-world by removing the constructor and placing the initial data in ngOnInit. Then I change the series and labels in a setTimeout callback (simulating the data is coming from a server). What happens is that the chart starts drawing (with animation) and before reaching let's say 10% of the animation it disappears. Full code at https://codesandbox.io/s/apx-donut-simple-tj28q

In general this is how I change the original sample class:

constructor() {}

  ngOnInit(): void {
    this.chartOptions = {
      series: [],
      chart: {
        type: "donut"
      },
      labels: [],
      responsive: [
        {
          breakpoint: 480,
          options: {
            chart: {
              width: 200
            },
            legend: {
              position: "bottom"
            }
          }
        }
      ]
    };

    setTimeout(() => {
      this.chartOptions.series = [44, 55, 13, 43, 22];
      this.chartOptions.labels = ["1", "2", "3", "4", "5"];
    }, 100);
  }

Notice the constructor is now empty, the initial values of series and labels are empty arrays and their values are changed 100ms after ngOnInit executes.

It is important that initial values (inside ngOnInit) of the series and labels to be empty arrays. If they contain something, the problem does not occur.

Feature Request @Output

Appreciate the great work.
Regarding ng-apexcharts implementation I think it is a bug.
If we have for example
@ViewChild('myChart') myChart: ChartComponent .... ngAfterViewInit() { this.myChart.resetSeries()}
will return an error since the creation of private chartObj in ChartComponent is in the microtask queue.and is not created yet, we get the myChart instance but the chartObj propriety is still undefined
the quick solution is
ngAfterViewInit() { Promise.resolve(null).then(() => this.myChart.resetSeries()); } will work since will be scheduled in the microtask queue after the chartObj creation.
A better aproach will be ChartComponet to emit the reference to the ChartComponent after rendering
@Output() chartReady: EventEmitter<ChartComponent> = new EventEmitter(); ... async render(): Promise<void> { return await this.chartObj.render(); } this.render().then(() => chartReady.emit(this))
then in parent component <apx-chart ... (chartReady)="doSomethingwithChartComonent($event)"></apx-chart>
PS the asapScheduler is not helping and is not needed also @ViewChild

Compile ERROR in ./node_modules/ng-apexcharts/fesm5/ng-apexcharts.js

It doesnt work with ng-apexcharts.

But it does work with "ng serve"

npm run-script ng build -- --prod --aot --vendor-chunk --common-chunk --delete-output-path --buildOptimizer --base-href /

ERROR in ./node_modules/ng-apexcharts/fesm5/ng-apexcharts.js
Module build failed: Error: Debug Failure. False expression.
at Object.assertDefined (\node_modules@angular-devkit\build-optimizer\node_modules\typescript\lib\typescript.js:4507:13)

angular 6.1.10
"typescript": "^2.8.0",
"apexcharts": "~3.11.2",
"ng-apexcharts": "~1.2.1",

Heat map Load failed

I am try to load 562X562 matrix it is not loading. It is crashing whole application

Recommend Projects

  • React photo React

    A declarative, efficient, and flexible JavaScript library for building user interfaces.

  • Vue.js photo Vue.js

    🖖 Vue.js is a progressive, incrementally-adoptable JavaScript framework for building UI on the web.

  • Typescript photo Typescript

    TypeScript is a superset of JavaScript that compiles to clean JavaScript output.

  • TensorFlow photo TensorFlow

    An Open Source Machine Learning Framework for Everyone

  • Django photo Django

    The Web framework for perfectionists with deadlines.

  • D3 photo D3

    Bring data to life with SVG, Canvas and HTML. 📊📈🎉

Recommend Topics

  • javascript

    JavaScript (JS) is a lightweight interpreted programming language with first-class functions.

  • web

    Some thing interesting about web. New door for the world.

  • server

    A server is a program made to process requests and deliver data to clients.

  • Machine learning

    Machine learning is a way of modeling and interpreting data that allows a piece of software to respond intelligently.

  • Game

    Some thing interesting about game, make everyone happy.

Recommend Org

  • Facebook photo Facebook

    We are working to build community through open source technology. NB: members must have two-factor auth.

  • Microsoft photo Microsoft

    Open source projects and samples from Microsoft.

  • Google photo Google

    Google ❤️ Open Source for everyone.

  • D3 photo D3

    Data-Driven Documents codes.