
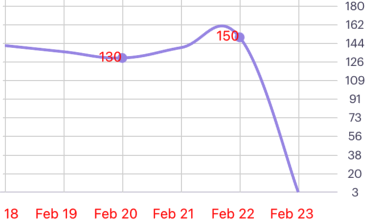
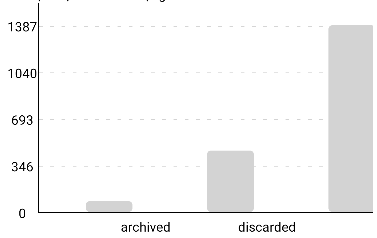
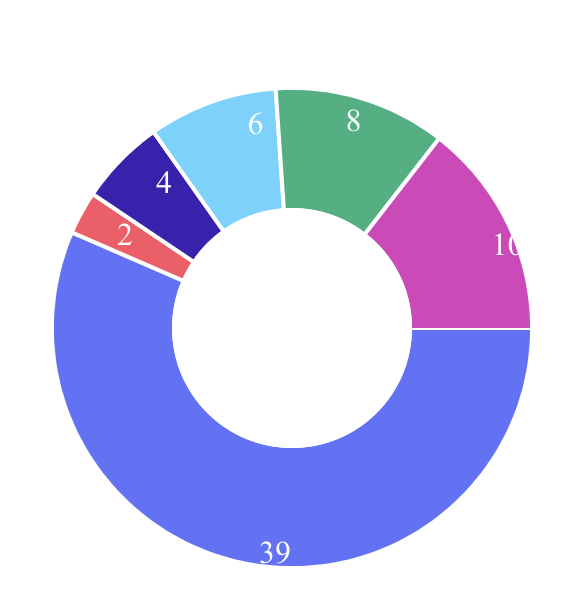
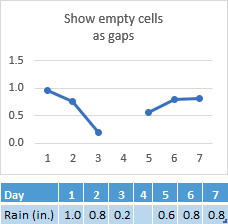
The most complete library for Bar, Line, Area, Pie, Donut, Stacked Bar and Population Pyramid charts in React Native. Allows 2D, 3D, gradient, animations and live data updates.
To bring Life to your data
- Plenty of features with minimal code
- Apply animations to your charts on load and on value change, just by adding a prop
- Smooth animations implemented using LayoutAnimation
- Clickable and scrollable
- Three-D and gradient effects
- Fully customizable (see the props)
- Detailed documentation with examples
- Support for combined Bar and Line charts
The web counterpart of this library is public now. Try out our new reactJS library- react-gifted-charts
The exact same piece of code that you write to render charts in react-native, can be used to render charts in reactJS using this library!


 |
 |
 |
 |
 |
 |
npm install react-native-gifted-charts react-native-linear-gradient react-native-svgnpx expo install react-native-gifted-charts expo-linear-gradient react-native-svgPlease note that react-native-svg and react-native-linear-gradient/expo-linear-gradient are needed for the library to work, so make sure they are installed in your project.
The simplest usage of various types of charts can be done as below-
import { BarChart, LineChart, PieChart, PopulationPyramid } from "react-native-gifted-charts";

// ...
const data=[ {value:50}, {value:80}, {value:90}, {value:70} ]

<BarChart data = {data} />
<LineChart data = {data} />
<PieChart data = {data} />
<PopulationPyramid data = {[{left:10,right:12}, {left:9,right:8}]} />

// For Horizontal Bar chart, just add the prop horizontal to the <BarChart/> component

<BarChart data = {data} horizontal />

// For Area chart, just add the prop areaChart to the <LineChart/> component

<LineChart data = {data} areaChart />

// For Donut chart, just add the prop donut to the <PieChart/> component

<PieChart data = {data} donut />1. BarChart, Horizontal BarChart and Stacked Bar Chart props
2. LineChart and AreaChart props
3. PieChart and DonutChart props
4. Population Pyramid props
This project exists thanks to all the people who contribute.
Dear developers! Your small contribution can make someone's day 😊
One of the ways you can contribute is to address an open issue.
Sometimes people report issues which don't exist, or request for features which are already present. Such issues can be addressed without pushing any code to the repo. Just show them in the comments how to do it.
See the contributing guide to learn how to contribute to the repository and the development workflow.
MIT


