PerfGun (Gatling) and PerfMeter (JMeter) have a custom InfluxDB Listener that is automatically added to test for reporting.
Carrier provides Grafana dashboards for both tools to monitor test results.
You can install InfluxDB and Grafana using a Carrier installer. In this case, all the necessary databases and dashboards will be set up automatically.
If you already have Grafana installed, you can import the dashboards and data sources from the Carrier Repository.
It is also necessary to have InfluxDB installed with the databases created (jmeter, gatling, comparison, telegraf, thresholds).
Example how to import PerfMeter dashboard using Curl:
curl -s https://raw.githubusercontent.com/carrier-io/carrier-io/master/grafana_dashboards/perfmeter_dashboards.json | curl -X POST "http://${FULLHOST}/grafana/api/dashboards/db" -u admin:${GRAFANA_PASSWORD} --header "Content-Type: application/json" -d @-
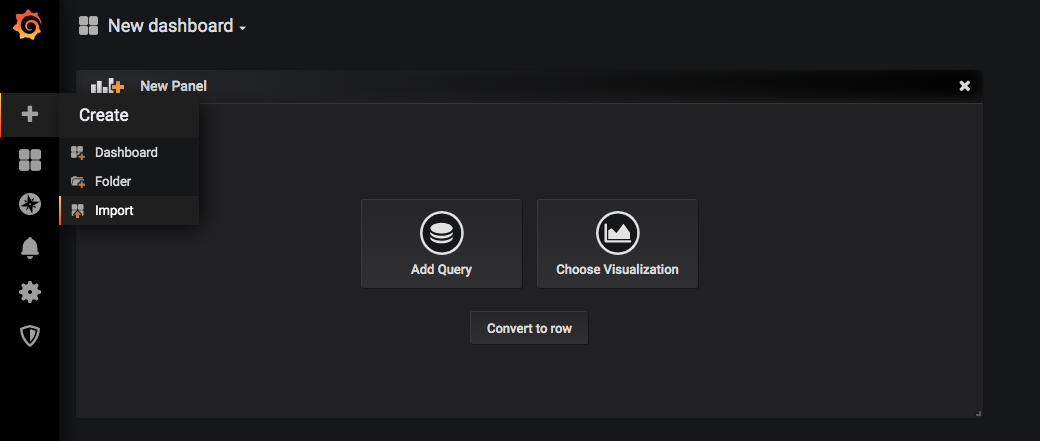
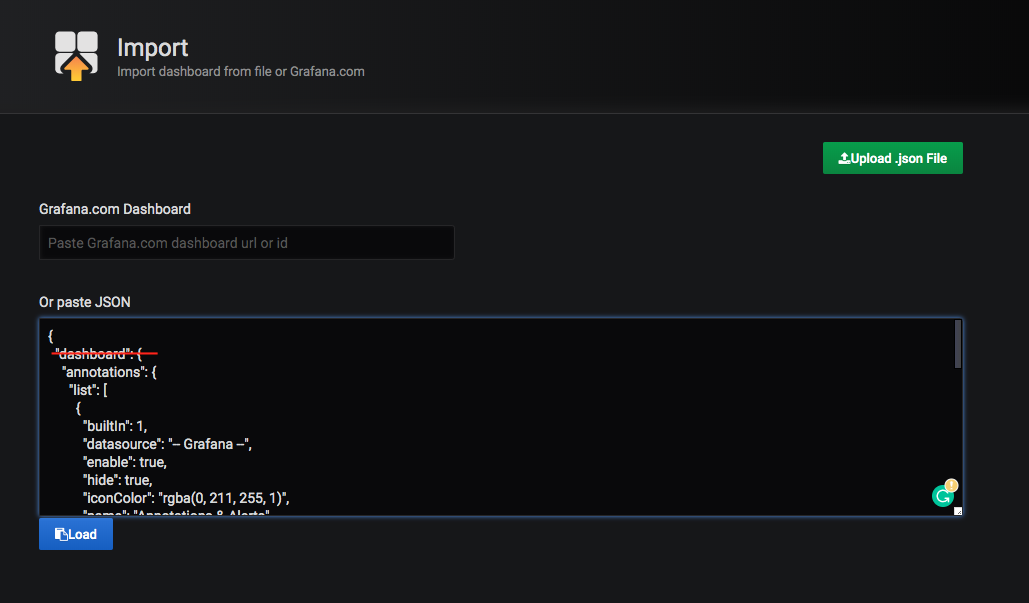
You can also import dashboards manually. But in this case you need to remove the "dashboard" key and its closing bracket from the JSON-file.
Screenshots of manual import of the dashboard are presented below.
Example how to import PerfMeter data source using Curl:
curl -s https://raw.githubusercontent.com/carrier-io/carrier-io/master/influx_datasources/datasource_jmeter | curl -X POST "http://${FULLHOST}/grafana/api/datasources" -u admin:password --header "Content-Type: application/json" -d @-
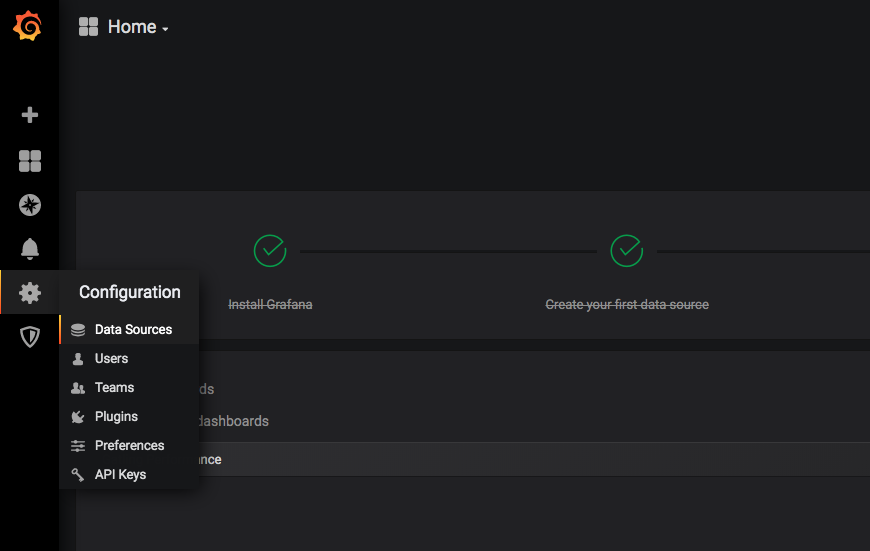
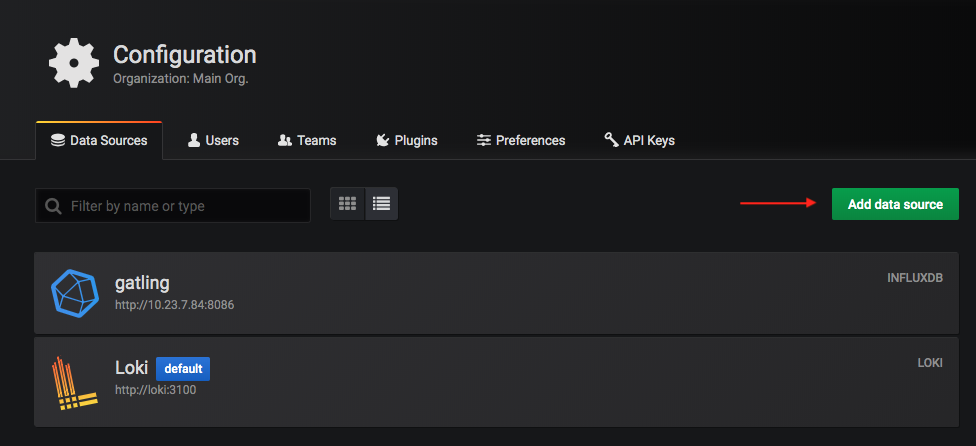
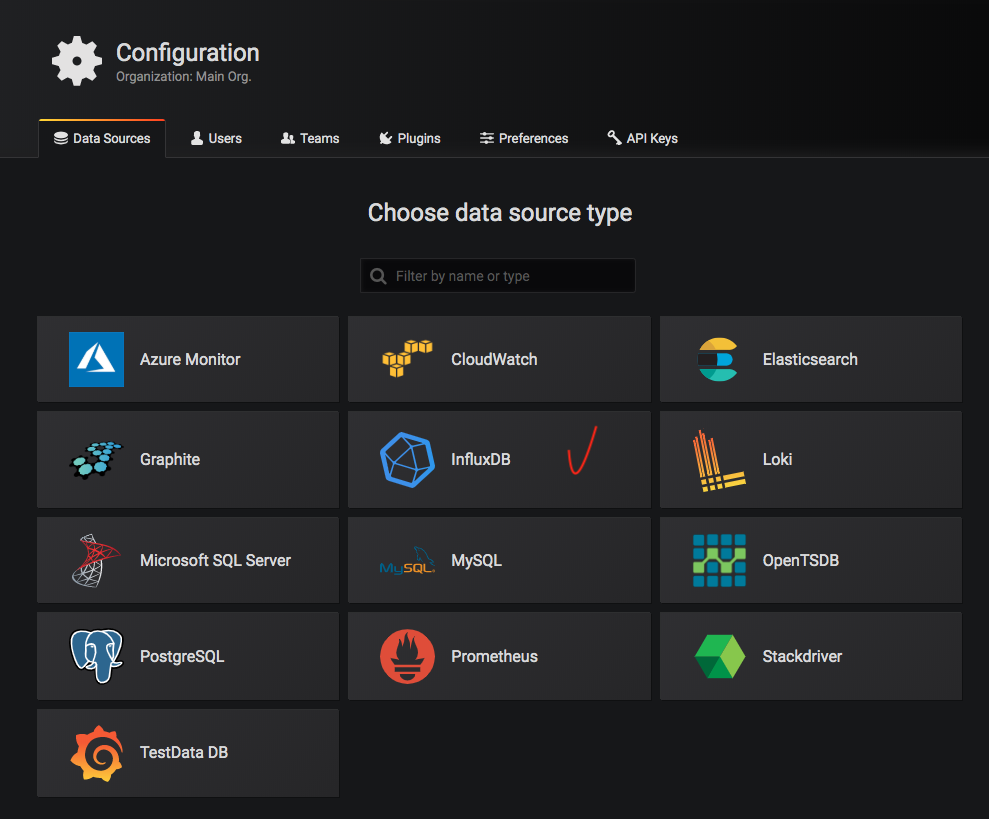
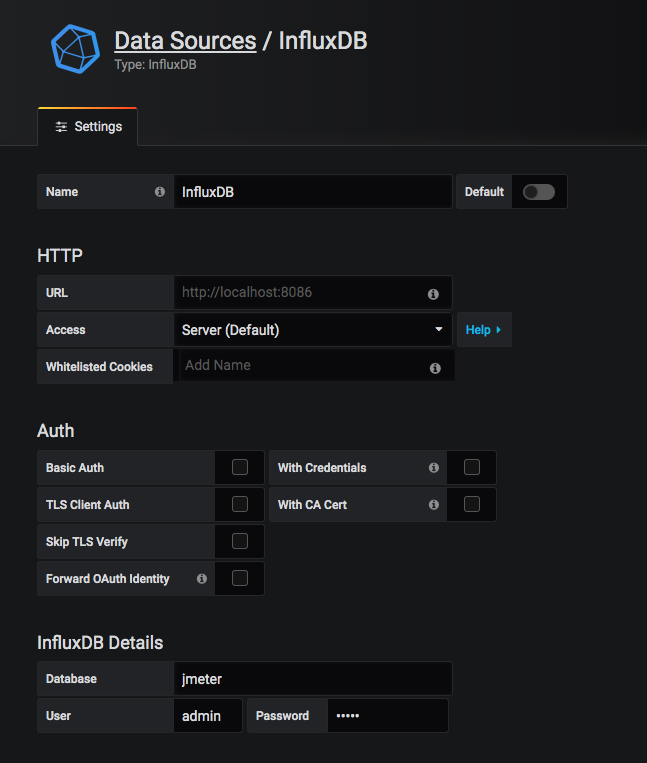
You can also create a data source manually. Go to the Configuration menu "Data source", press "Add data source", select "InfluxDB" and fill in all the necessary fields.
Screenshots are presented below.
During the test execution all performance metrics are being saved to InfluxDB and displayed in Grafana.
Grafana allows us to review performance tests results using different filters which helps us to divide executed tests by parameters (e.g.: Simulation name, Test type, Environment, Users count, etc.).

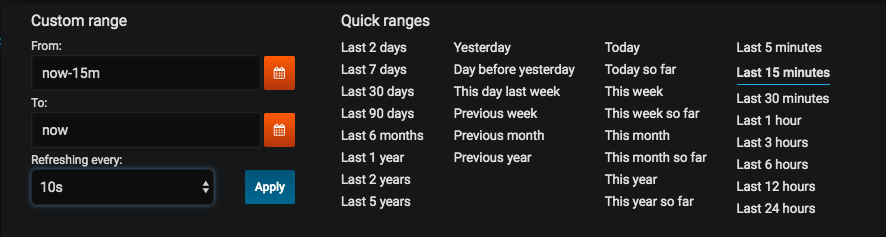
You can pick necessary time range in which you want to see your results. You can also set the "Refreshing every:" option. This allows you to automatically update the dashboard at specified intervals.
After all filters set-up properly you will be able to see results of test execution.
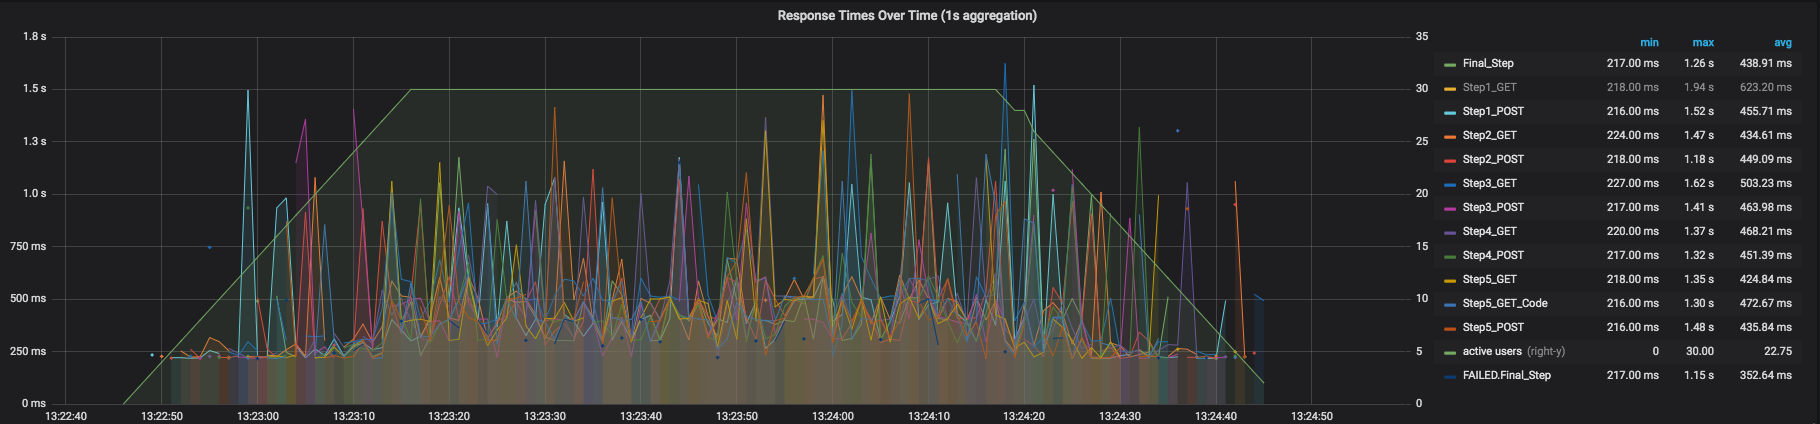
The first block consists of 6 panels with overall information.

The second block of the dashboard named “Response Times Over Time” contains a chart where you can see Response time for all requests or only for chosen in the right side of the block.
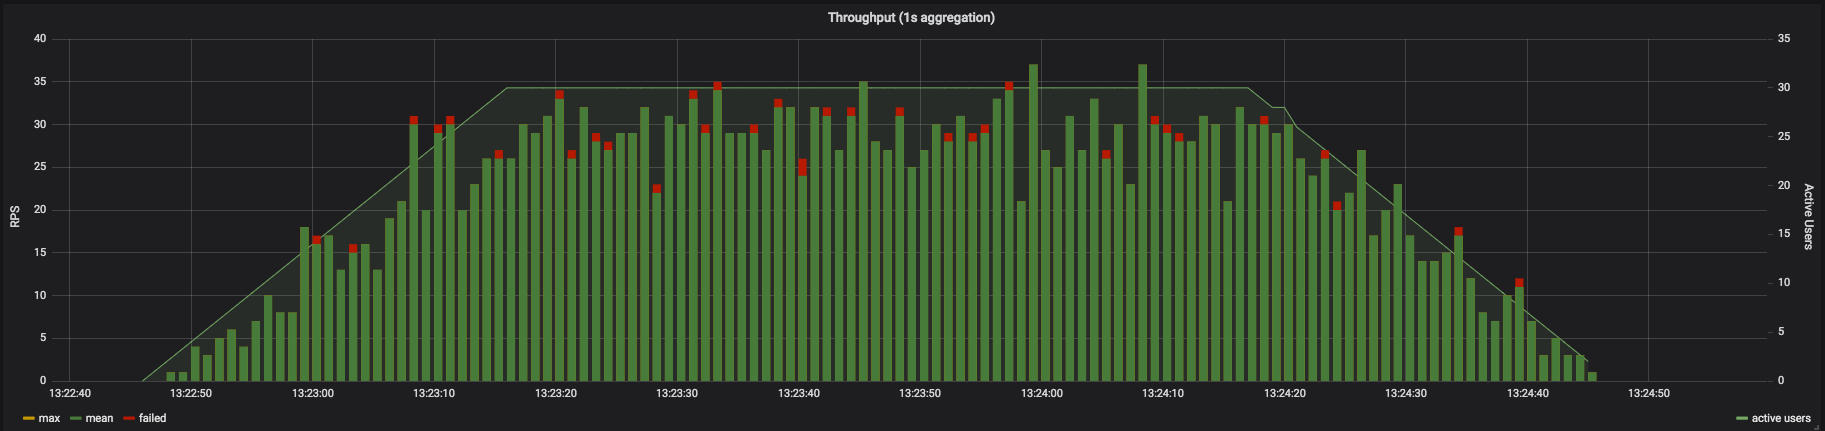
The third block of the dashboard, called "Throughput", contains a graph showing the change in throughput over time.
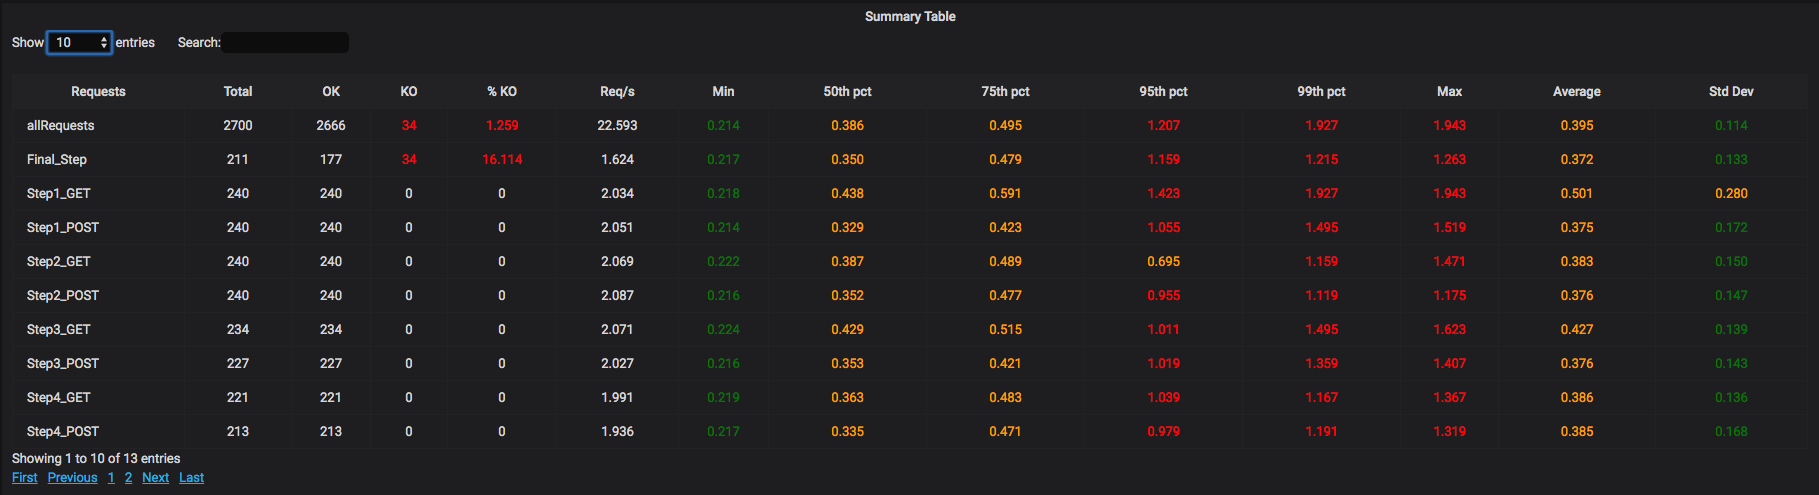
The last block of the dashboard called "Summary table" contains a table consisting of detailed statistics for each request. In case of empty table refresh the page.
The capacity of a system is the total workload it can handle without violating predetermined key performance acceptance criteria.
A capacity test ran to determine your server’s saturation point, saturation area and failure point.
Capacity testing ran in conjunction with capacity planning, which you use to plan for future growth, such as an increased user base or increased volume of data. For example, to accommodate future loads, you need to know how many additional resources (such as processor capacity, memory usage, disk capacity, or network bandwidth) are necessary to support future usage levels.
Capacity testing helps you to identify a scaling strategy in order to determine whether you should scale up or scale out.
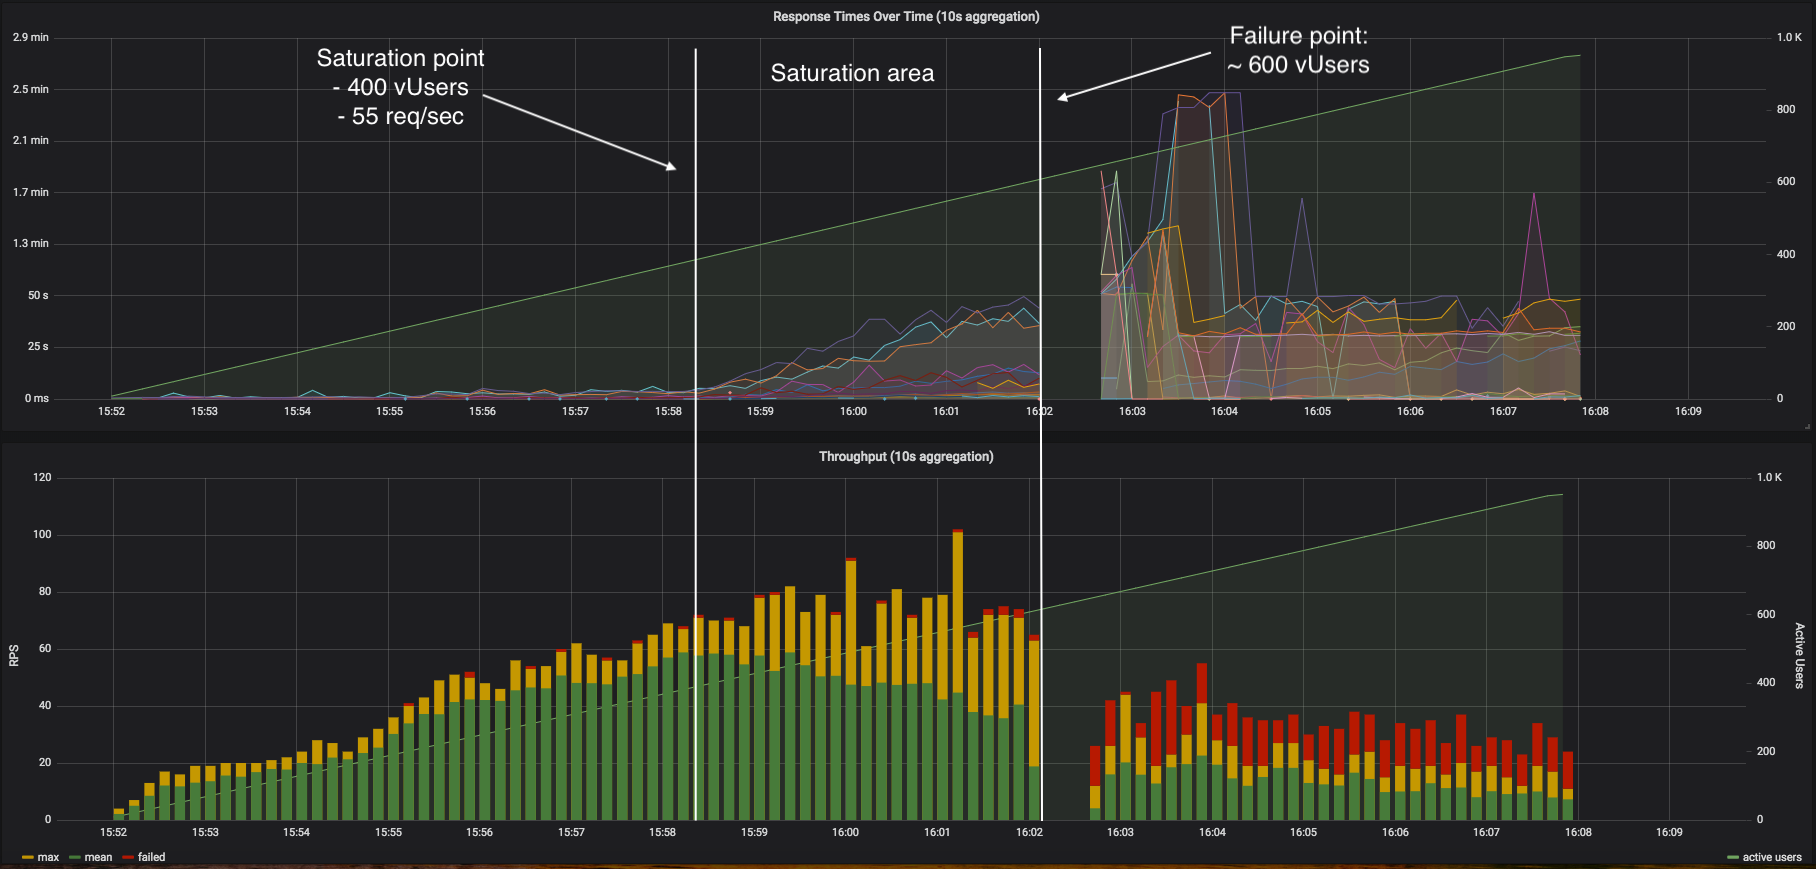
Saturation point - the point when system throughput stops to grow, while pressure (concurrent users) continue to grow. Saturation point should be used to determine if hardware resources is planned carefully, e.g. if saturation come w/o all system resources utilized, it may be considered as ineffective resource usage. Saturation point should be used as an input in planning of scaling strategy for a particular system.
Saturation area is time from saturation point to a failure point, while pressure on a system is growing. Saturation area is a time system have to scale up to avoid reaching failure point.
Failure point is a point when % of failed requests or % of responses exceeded maximum expected time reached the allowed limit (e.g. 1%). This point considered to be user attrition point - users stops using the system in this state because of unsatisfactory experience.
A screenshot of the saturation point, saturation area and failure point is presented below.
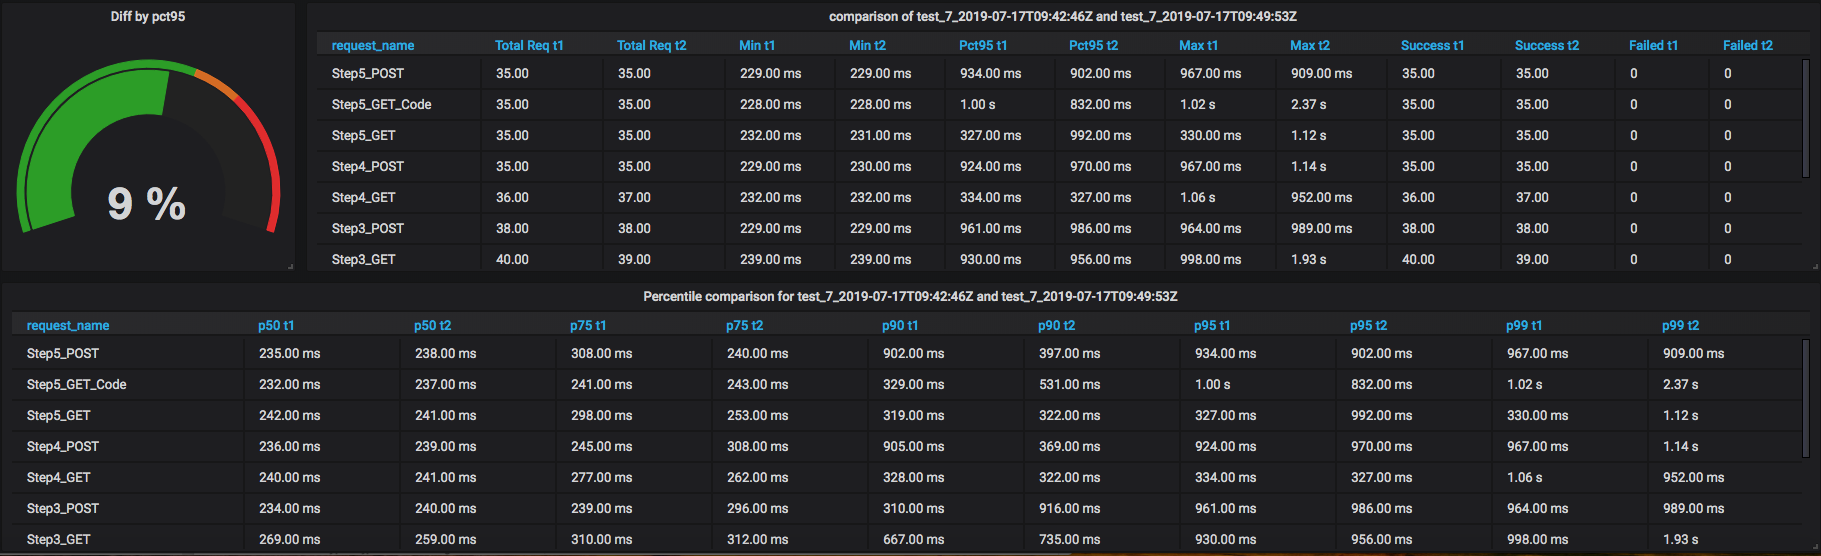
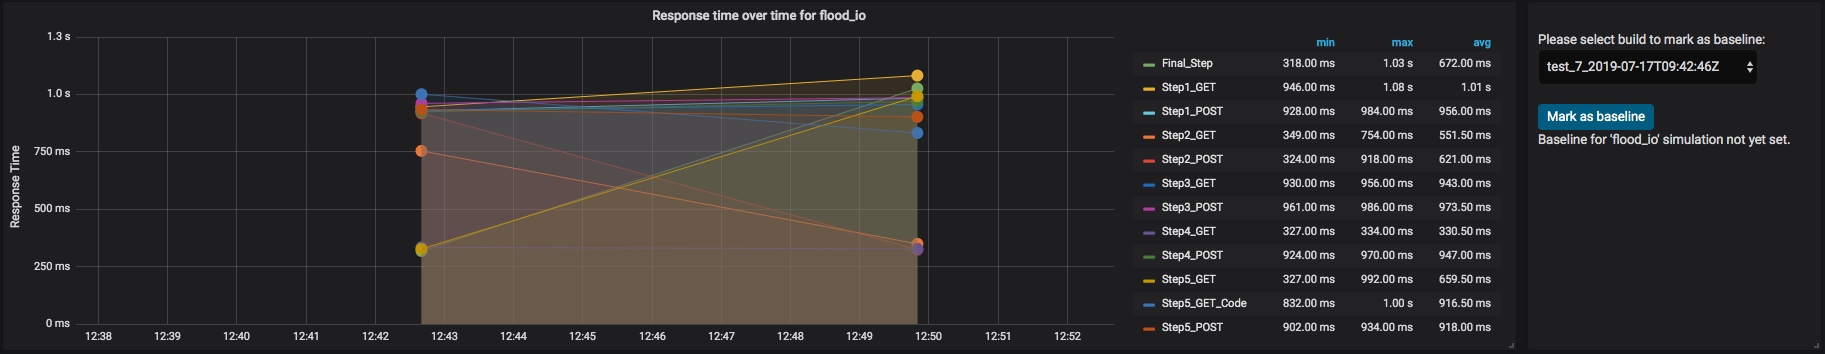
There are some cases when you need to compare performance results between different test executions for each request.
Carrier provides Grafana dashboard for this purpose. Setup is performed automatically if you are using the Carrier installer. Or you can import it yourself if you already have a Grafana installed.
Example how to import Comparison dashboard using Curl:
curl -s https://raw.githubusercontent.com/carrier-io/carrier-io/master/grafana_dashboards/performance_comparison_dashboard.json | curl -X POST "http://${FULLHOST}/grafana/api/dashboards/db" -u admin:${GRAFANA_PASSWORD} --header "Content-Type: application/json" -d @-
Grafana allows us to review performance test results using different filters which helps us to divide executed tests by parameters (e.g.: Simulation name, Duration, User count, etc.).

Once all the filters have been configured correctly, you will be able to see a comparison of the results for the selected tests.
There are 3 main sections on the dashboard.
The first one shows a chart of the response time with a comparison of the selected tests for each request. To the right of this chart you can select one of the tests and mark it as baseline.
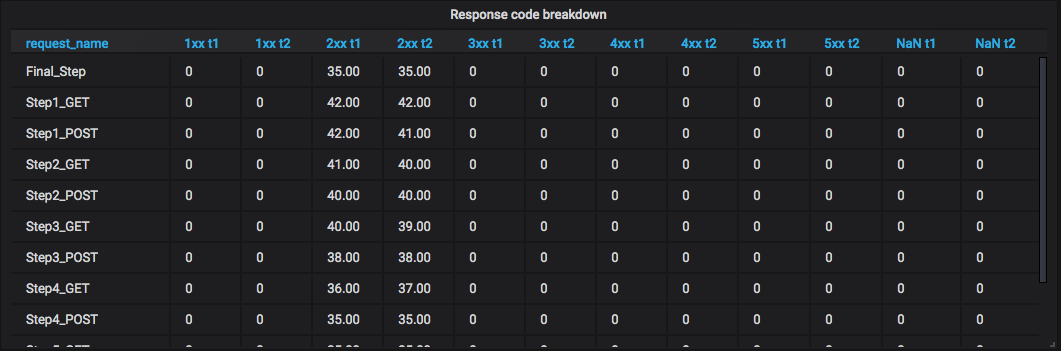
The second section contains tables with the distribution of all requests by response code.
The last section contains tables comparing the response time for each request.