Code Monkey home page Code Monkey logo

cinnamon's Introduction

ReadTheDocs_ License_ PyPi_

Introduction to CinnaMon

CinnaMon is a Python library which allows to monitor data drift on a machine learning system. It provides tools to study data drift between two datasets, especially to detect, explain, and correct data drift.

⚡️ Quickstart

As a quick example, let's illustrate the use of CinnaMon on the breast cancer data where we voluntarily introduce some data drift.

Setup the data and build a model

>>> import pandas as pd
>>> from sklearn import datasets
>>> from sklearn.model_selection import train_test_split
>>> from xgboost import XGBClassifier

# load breast cancer data
>>> dataset = datasets.load_breast_cancer()
>>> X = pd.DataFrame(dataset.data, columns = dataset.feature_names)
>>> y = dataset.target

# split data in train and valid dataset
>>> X_train, X_valid, y_train, y_valid = train_test_split(X, y, test_size=0.3, random_state=2021)

# introduce some data drift in valid by filtering with 'worst symmetry' feature
>>> y_valid = y_valid[X_valid['worst symmetry'].values > 0.3]
>>> X_valid = X_valid.loc[X_valid['worst symmetry'].values > 0.3, :].copy()

# fit a XGBClassifier on the training data
>>> clf = XGBClassifier(use_label_encoder=False)
>>> clf.fit(X=X_train, y=y_train, verbose=10)

Initialize ModelDriftExplainer and fit on train and validation data

>>> import cinnamon
>>> from cinnamon.drift import ModelDriftExplainer

# initialize a drift explainer with the built XGBClassifier and fit it on train
# and valid data
>>> drift_explainer = ModelDriftExplainer(model=clf)
>>> drift_explainer.fit(X1=X_train, X2=X_valid, y1=y_train, y2=y_valid)

Detect data drift by looking at main graphs and metrics

# Distribution of logit predictions
>>> cinnamon.plot_prediction_drift(drift_explainer, bins=15)

image

We can see on this graph that because of the data drift we introduced in validation data the distribution of predictions are different (they do not overlap well). We can also compute the corresponding drift metrics:

# Corresponding metrics
>>> drift_explainer.get_prediction_drift()
[{'mean_difference': -3.643428434667366,
'wasserstein': 3.643428434667366,
'kolmogorov_smirnov': KstestResult(statistic=0.2913775225333014, pvalue=0.00013914094110123454)}]

Comparing the distributions of predictions for two datasets is one of the main indicator we use in order to detect data drift. The two other indicators are:

  • distribution of the target (see get_target_drift)
  • performance metrics (see get_performance_metrics_drift)

Explain data drift by computing the drift importances

Drift importances can be thought as equivalent of feature importances but in terms of data drift.

# plot drift importances
>>> cinnamon.plot_tree_based_drift_importances(drift_explainer, n=7)

image

Here the feature worst symmetry is rightly identified as the one which contributes the most to the data drift.

More

See "notes" below to explore all the functionalities of CinnaMon.

🛠 Installation

CinnaMon is intended to work with Python 3.7 or above. Installation can be done with pip:

$ pip install cinnamon

🔗 Notes

  • CinnaMon documentation
  • The two main classes of CinnaMon are ModelDriftExplainer and AdversarialDriftExplainer
  • CinnaMon supports both model specific and model agnostic methods for the computation of drift importances. More information here.
  • CinnaMon can be used with any model or ML pipeline thanks to model agnostic mode.
  • See notebooks in the examples/ directory to have an overview of all functionalities. Notably:

    These two notebooks also go deeper into the topic of how to correct data drift, making use of AdversarialDriftExplainer

  • See also the slide presentation of the CinnaMon library. And the video presentation.

👍 Contributing

Check out the contribution section.

📝 License

CinnaMon is free and open-source software licensed under the MIT.

cinnamon's People

Contributors

yohannlefaou avatar

Stargazers

 avatar  avatar  avatar  avatar  avatar  avatar  avatar  avatar  avatar  avatar  avatar  avatar  avatar  avatar  avatar  avatar  avatar  avatar  avatar  avatar  avatar  avatar  avatar  avatar  avatar  avatar  avatar  avatar  avatar  avatar  avatar  avatar  avatar  avatar  avatar  avatar  avatar  avatar  avatar  avatar  avatar  avatar  avatar  avatar  avatar  avatar  avatar  avatar  avatar  avatar  avatar  avatar  avatar  avatar  avatar  avatar  avatar  avatar  avatar  avatar  avatar  avatar  avatar  avatar  avatar  avatar  avatar  avatar  avatar  avatar  avatar  avatar  avatar  avatar  avatar

Watchers

 avatar  avatar  avatar  avatar  avatar  avatar  avatar  avatar  avatar

cinnamon's Issues

Some feedback and some questions

Hi!

This looks like a great project! I have a few concerns about using a hypothesis based test for comparison of drift - reason being, how do you account for the multiple comparison's problem? https://en.wikipedia.org/wiki/Multiple_comparisons_problem

You do get some more explanatory power by looking at the plots, to be sure. I was thinking maybe you could include some permutation tests to deal with this, instead of relying on KS? Here is a reference: http://sia.webpopix.org/statisticalTests2.html and here is some in Python: https://ericschles.github.io/cuny_intro_to_ds_book/12/1/AB_Testing.html?highlight=permutation (important to note even though this is my teaching resource, it is lifted from some content from berkeley).

Anyway, great job!

error after trying to execute the command: "from cinnamon.drift import ModelDriftExplainer"

[1I ] am getting the following error when trying to execute code from Quickstart or [breast_cancer_xgboost_binary_classif.ipynb] in a section containing "from cinnamon.drift import ModelDriftExplainer":

ModuleNotFoundError Traceback (most recent call last)
~\AppData\Local\Temp/ipykernel_10348/627594479.py in
1 # Initialize ModelDriftExplainer and fit it on train and validation data
----> 2 from cinnamon.drift import ModelDriftExplainer
3
4 # initialize a drift explainer with the built XGBClassifier and fit it on train
5 # and valid data

~\AppData\Roaming\Python\Python39\site-packages\cinnamon\drift_init_.py in
1 from .adversarial_drift_explainer import AdversarialDriftExplainer
----> 2 from .model_drift_explainer import ModelDriftExplainer

~\AppData\Roaming\Python\Python39\site-packages\cinnamon\drift\model_drift_explainer.py in
7 from ..model_parser.i_model_parser import IModelParser
8 from .adversarial_drift_explainer import AdversarialDriftExplainer
----> 9 from ..model_parser.xgboost_parser import XGBoostParser
10
11 from .drift_utils import compute_drift_num, plot_drift_num

~\AppData\Roaming\Python\Python39\site-packages\cinnamon\model_parser\xgboost_parser.py in
2 import pandas as pd
3 from typing import Tuple
----> 4 from .single_tree import BinaryTree
5 import xgboost
6 from .abstract_tree_ensemble_parser import AbstractTreeEnsembleParser

~\AppData\Roaming\Python\Python39\site-packages\cinnamon\model_parser\single_tree.py in
1 import numpy as np
----> 2 from treelib import Tree
3 from ..common.constants import TreeBasedDriftValueType
4
5 class BinaryTree:

ModuleNotFoundError: No module named 'treelib'

​[2] When I'm executing the code chunk "# fit an XGBClassifier on the training data" from "Quickstart" I've got this warning:

[20:53:12] WARNING: C:/Users/Administrator/workspace/xgboost-win64_release_1.5.1/src/learner.cc:1115: Starting in XGBoost 1.3.0, the default evaluation metric used with the objective 'binary:logistic' was changed from 'error' to 'logloss'. Explicitly set eval_metric if you'd like to restore the old behavior.
XGBClassifier(base_score=0.5, booster='gbtree', colsample_bylevel=1,
colsample_bynode=1, colsample_bytree=1, enable_categorical=False,
gamma=0, gpu_id=-1, importance_type=None,
interaction_constraints='', learning_rate=0.300000012,
max_delta_step=0, max_depth=6, min_child_weight=1, missing=nan,
monotone_constraints='()', n_estimators=100, n_jobs=6,
num_parallel_tree=1, predictor='auto', random_state=0,
reg_alpha=0, reg_lambda=1, scale_pos_weight=1, subsample=1,
tree_method='exact', use_label_encoder=False,
validate_parameters=1, verbosity=None)

I use Python 3.8.8/ Win10 installed on the AMD Ryzen with integrated graphics (AMD).
Environment: Anaconda

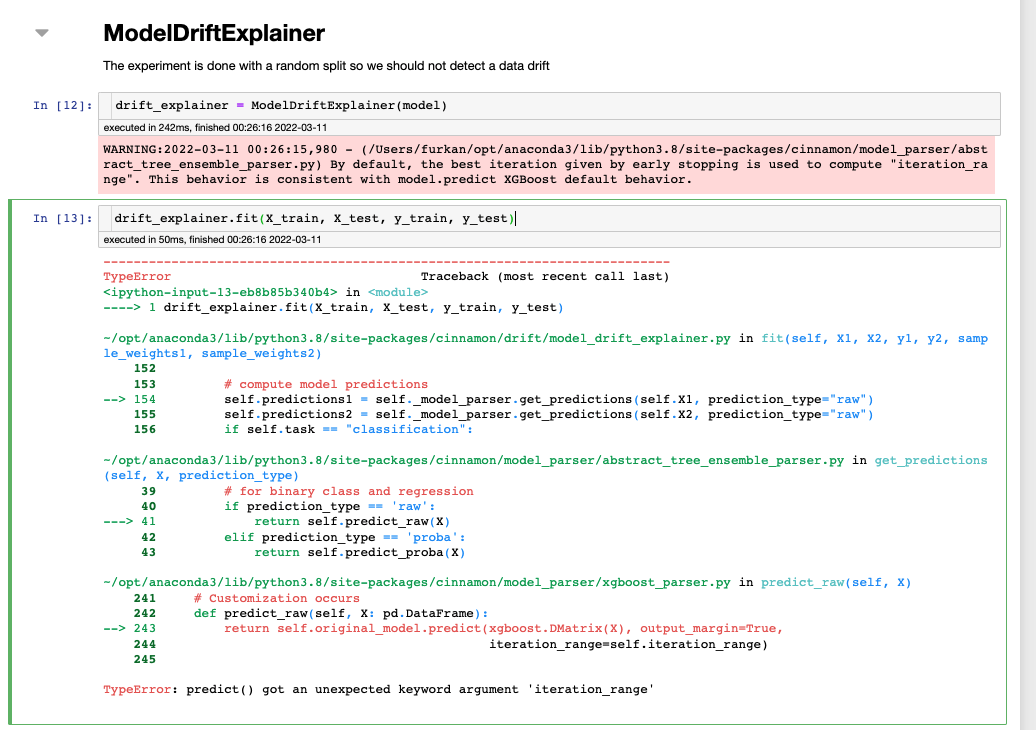
TypeError: predict() got an unexpected keyword argument 'iteration_range'

Hi cinnamon team,
Firstly, thanks for bringing such a cool package!

I was working with your package and I have come across the following error. Then, I checked your example notebook examples/boston_XGBoost_ModelDriftExplainer.ipynb, to be sure whether I used it correctly, but got the same error:

TypeError: predict() got an unexpected keyword argument 'iteration_range'

Screenshot 2022-03-11 at 00 26 44

Could you please let me know how to overcome this issue (maybe I am using an obsolete version of a package)?

Environment details:

  • macOS v.12.1
  • Python 3.8.8
  • cinnamon==0.1.2
  • xgboost==1.4.2

Thanks for your help in advance!

Recommend Projects

  • React photo React

    A declarative, efficient, and flexible JavaScript library for building user interfaces.

  • Vue.js photo Vue.js

    🖖 Vue.js is a progressive, incrementally-adoptable JavaScript framework for building UI on the web.

  • Typescript photo Typescript

    TypeScript is a superset of JavaScript that compiles to clean JavaScript output.

  • TensorFlow photo TensorFlow

    An Open Source Machine Learning Framework for Everyone

  • Django photo Django

    The Web framework for perfectionists with deadlines.

  • D3 photo D3

    Bring data to life with SVG, Canvas and HTML. 📊📈🎉

Recommend Topics

  • javascript

    JavaScript (JS) is a lightweight interpreted programming language with first-class functions.

  • web

    Some thing interesting about web. New door for the world.

  • server

    A server is a program made to process requests and deliver data to clients.

  • Machine learning

    Machine learning is a way of modeling and interpreting data that allows a piece of software to respond intelligently.

  • Game

    Some thing interesting about game, make everyone happy.

Recommend Org

  • Facebook photo Facebook

    We are working to build community through open source technology. NB: members must have two-factor auth.

  • Microsoft photo Microsoft

    Open source projects and samples from Microsoft.

  • Google photo Google

    Google ❤️ Open Source for everyone.

  • D3 photo D3

    Data-Driven Documents codes.