A step-by-step guide on a complete microservices architecture using Spring Boot and Spring Cloud.
- Part 1 The Basic
- Part 2 Service Discovery
- Part 3 Service routing and Security
- Part 4 Microservice Monitoring
- Part 5 Log aggregation with Elastic Stack

In this part we are going to create a new Microservices using Spring Boot, adding circuit breaker to them, create a Configuration server and use it in our microservices.
We are going to create a new and simple microservice using Spring boot. Let's start with create a new Spring Boot project using Spring Initialir or using IntelliJ with dependencies as follow:
LombokJava annotation library helps to reduce boilerplate code.Spring WebBuild web, including RESTful, applications using Spring MVC. Uses Apache Tomcat as the default embedded container.Resilience4J - Spring Cloud Circuit BreakerSpring Cloud Circuit breaker with Resilience4j as the underlying implementation.Config Client - Spring Cloud Configuration ClientClient that connects to a Spring Cloud Config Server to fetch the application's configuration.

What is Circuit breaker?
Spring cloud circuit breaker use Resilience4J as the underlaying implementation.

Using latest version of Spring Cloud Circuit Breaker to create a circuit breaker in our code using CircuitBreakerFactory API.
Spring Cloud Circuit breaker provides an abstraction across different circuit breaker implementations. It provides a consistent API to use in your applications allowing you the developer to choose the circuit breaker implementation that best fits your needs for your app.
To add circuit breaker to our code first we need to create a default circuit breaker factory bean as follow:
@Bean
@ConditionalOnBean
public Customizer<Resilience4JCircuitBreakerFactory> defaultCustomizer() {
	return factory -> factory.configureDefault(
		id -> new Resilience4JConfigBuilder(id)
			.timeLimiterConfig(
        TimeLimiterConfig.custom().timeoutDuration(Duration.ofSeconds(3)).build()
      ).circuitBreakerConfig(CircuitBreakerConfig.ofDefaults()).build());
}
And a rest template bean:
@Bean
public RestTemplate getRestTemplate() {
	return new RestTemplate();
}
And then we can autowired them as follow:
@RestController
@RequestMapping("/api")
public class ApplicationController {

    private RestTemplate restTemplate;
    private CircuitBreakerFactory circuitBreakerFactory;

    public ApplicationController(RestTemplate restTemplate, CircuitBreakerFactory circuitBreakerFactory) {
        this.restTemplate = restTemplate;
        this.circuitBreakerFactory = circuitBreakerFactory;
    }

    @GetMapping("/getMethod")
    public ResponseEntity getMethod() {
        return circuitBreakerFactory.create("slow").run(
                () -> restTemplate.getForEntity("/slow-api-call", String.class),
                throwable -> ResponseEntity.status(HttpStatus.BAD_REQUEST).build()
        );
    }

}
Create at new Spring Cloud Config project as follow:

Spring Cloud Config provides server-side and client-side support for externalized configuration in a distributed system. With the Config Server, you have a central place to manage external properties for applications across all environments. The concepts on both client and server map identically to the Spring
EnvironmentandPropertySourceabstractions, so they fit very well with Spring applications but can be used with any application running in any language.
Add @EnableConfigServer annotation to your main Spring boot application class.
@SpringBootApplication
@EnableConfigServer
public class ConfigServiceApplication {

	public static void main(String[] args) {
		SpringApplication.run(ConfigServiceApplication.class, args);
	}

}
For example we will config the server to use GitHub backend, add these properties to your application.properties or bootstrap.properties file as below example:
spring.cloud.config.server.git.uri=https://github.com/your-github-account-name/config-service.git
spring.cloud.config.server.git.clone-on-start=true
spring.profiles.active=local,dev,prod

spring.cloud.config.server.git.search-paths=microservice-01,microservice-02,microservice-03
Your GitHub structure repo can look like this:
config-service
  - microservice-01
    - application.properties
    - application-dev.properties
    - application-prod.properties
  - microservice-02
    - application.properties
    - application-dev.properties
    - application-prod.properties
  - microservice-03
    - application.properties
    - application-dev.properties
    - application-prod.properties
config-service is the root directory
microservice-0x is under directory to keep our properties organized by resources
Properties file structure are link this:
application-{profile}.properties for example.
Now let's say in Microservice-01/application-dev.properties you have this property:
api-url=http://your-api-host/api/vi/endpoint
We will use this in next section below. And here is an example of the Configuration endpoint:

By using Spring Cloud Configuration Client we can connect our Microservice to use Configuration Server. We need this dependency in our pom.xml:
<dependency>
	<groupId>org.springframework.cloud</groupId>
	<artifactId>spring-cloud-starter-config</artifactId>
</dependency>
Let's say we have this config in microservice-01, to read properties from our Configuration Server we could have a placeholder like below:
@Value("${api-url}")
private String apiUrl;
That's should be all to read properties from our Spring Cloud Configuration Server.
In this part we going to create a new Spring Boot application with Spring cloud Netflix Eureka. The project created link below:

The Eureka server is an implementation of service discovery pattern in mincroservices. Client can register themselves so that others can discover them.
To enable Eureka server you can add @EnableEurekaServer annotation to your spring boot application class.
The following class show a minimal Eureka server configuration.
@SpringBootApplication
@EnableEurekaServer
public class EurekaServiceApplication {

  public static void main(String[] args) {
    SpringApplication.run(EurekaServiceApplication.class, args);
  }

}
And add properties to application.properties:
eureka.instance.hostname=localhost
eureka.client.register-with-eureka=false
eureka.client.fetch-registry=false
eureka.server.wait-time-in-ms-when-sync-empty=0To register Eureka client to our Eureka server first we need to include dependency:
<dependency>
  <groupId>org.springframework.cloud</groupId>
  <artifactId>spring-cloud-starter-netflix-eureka-client</artifactId>
</dependency>
And in properties file we will define Eureka server location so that our client can find and register it to the server.
eureka.instance.prefer-ip-address=true
# for Eureka server with Basic auth
eureka.client.service-url.defaultZone=http://${eureka.username}:${eureka.password}@${eureka.hostname}:${eureka.server.port}/eureka/

# for Eureka server
eureka.client.service-url.defaultZone=http://localhost:3456/eureka/Once the Eureka server is up we can access to the dash board on http://localhost:3456/.

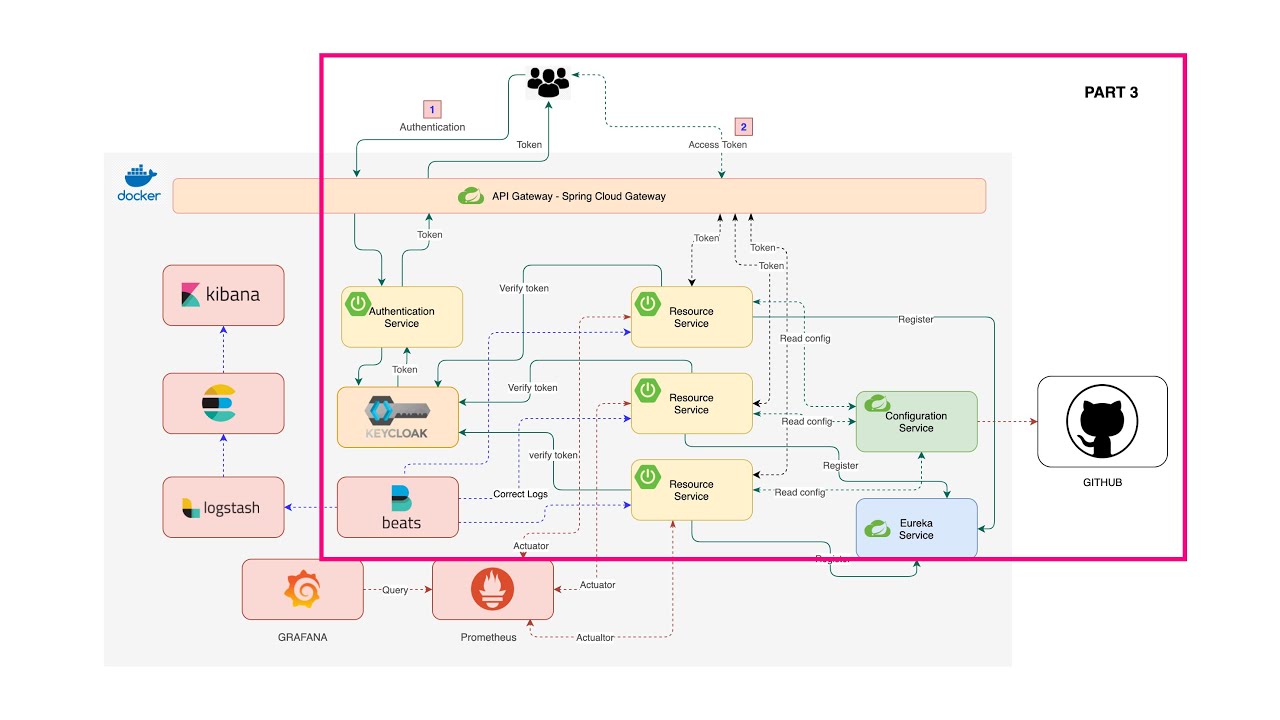
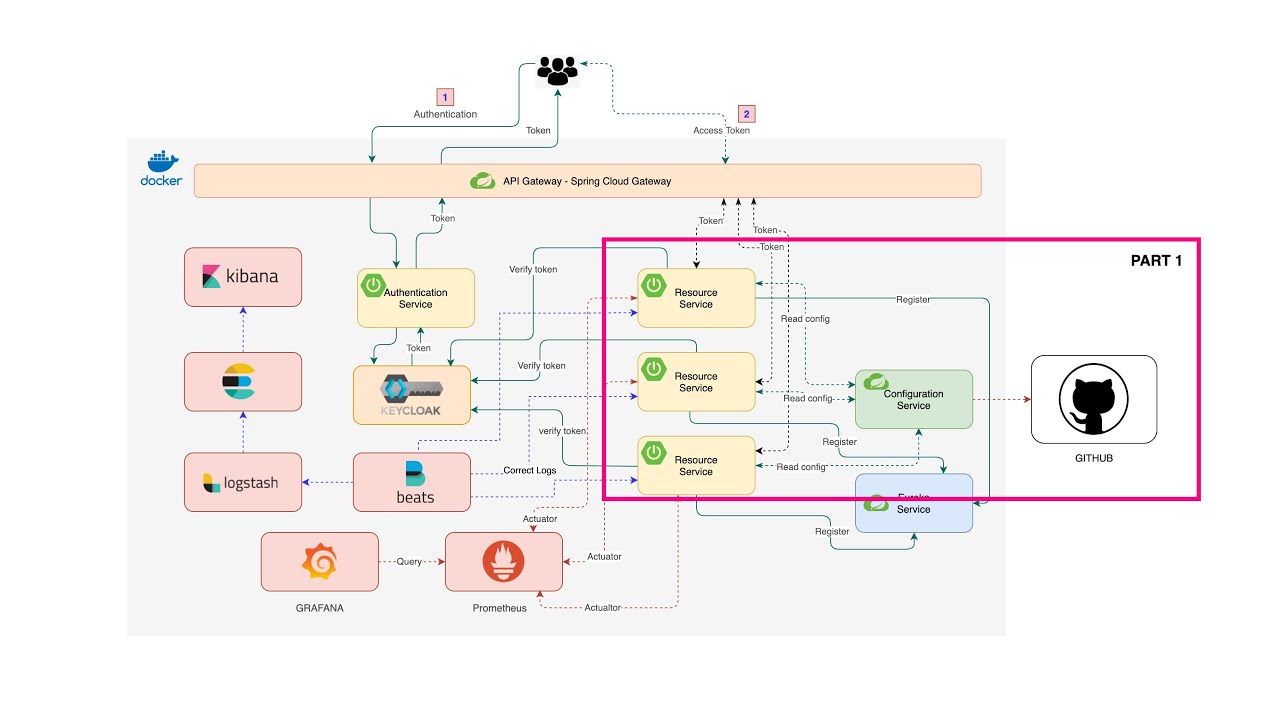
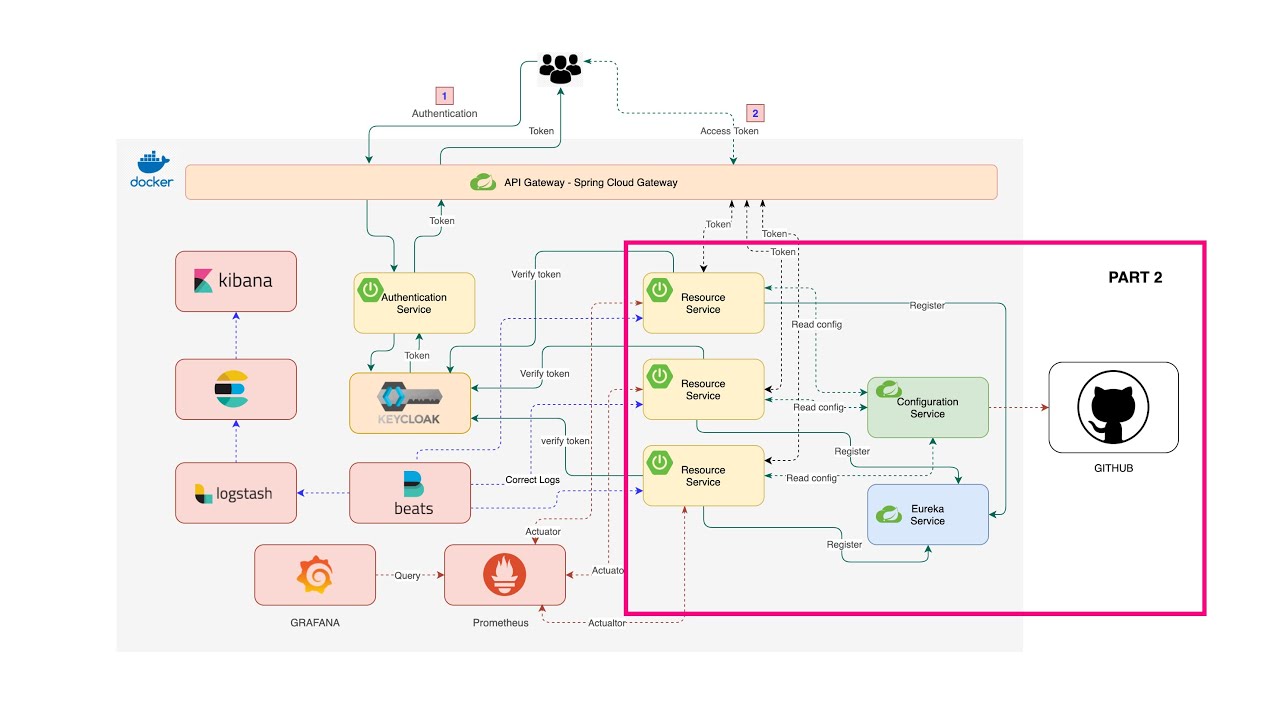
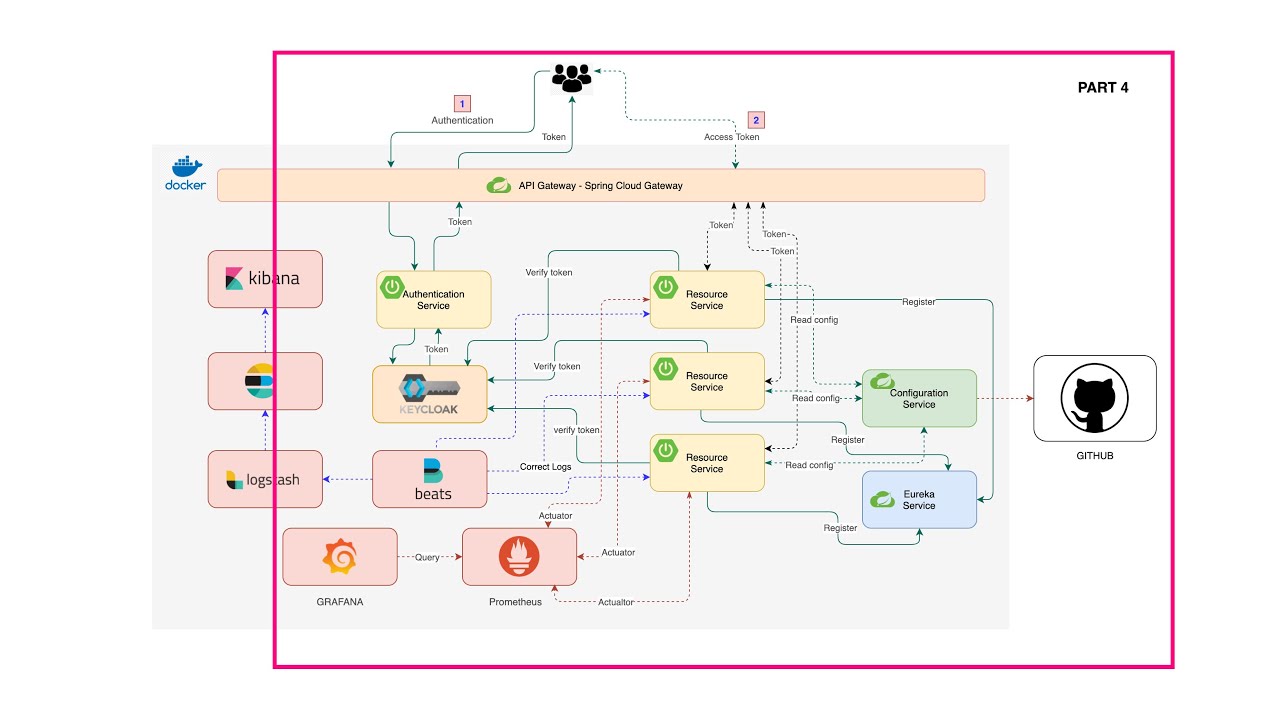
In this part we going to build a Spring Cloud Gateway and Authentication server with Keycloak server. Then we are going to connect and route our microservices to the Gateway and also add security to them as the picture below.

The diagram below provides a high-level of how Spring Cloud Gateway works:

First, let's create a Spring Boot application with Spring Cloud Gateway. A minimal dependencies will be as show below:

Next, config and route the services in the properties file as show below.
spring.cloud.gateway.routes[0].id=microservice-01-id
spring.cloud.gateway.routes[0].uri=microservice-01-uri
spring.cloud.gateway.routes[0].predicates[0]=Path=microservice-01-path
spring.cloud.gateway.routes[1].id=microservice-02-id
spring.cloud.gateway.routes[1].uri=microservice-02-uri
spring.cloud.gateway.routes[1].predicates[0]=Path=microservice-02-path
spring.cloud.gateway.routes[2].id=microservice-03-id
spring.cloud.gateway.routes[2].uri=microservice-03-uri
spring.cloud.gateway.routes[2].predicates[0]=Path=microservice-03-path
Now we can access to microservices via our Gateway and it will routes to the right direction.
We will install Keycloak server and run it inside Docker together with all of our services. Start by download and install Docker on your machine, you can find the download link here Docker Desktop.
- Download Docker

Then on the command promt run this command to pull the Keycloak image into Docker
docker pull quay.io/keycloak/keycloak:15.0.2 And to run Keycloak server, excute this command
docker run -p 8080:8080 -e KEYCLOAK_USER=admin -e KEYCLOAK_PASSWORD=admin quay.io/keycloak/keycloak:15.0.2 Keycloak will be running on port 8080 with admin as login username and password.
We are going to use OAuth2 Password grant types in this example.
The Password grant is used when the application exchanges the user’s username and password for an access token. This is exactly the thing OAuth was created to prevent in the first place, so you should never allow third-party apps to use this grant.
-
Access Keycloak server on http://localhost:8080 and add new Realm

-
Add new user

-
Add new Client

-
Config client

-
Config client

-
Testing Keycloak config with Postman

Now we are going to create a new Spring Boot application that will act as the Authentication server on top of Keycloak server so that client don't have direct access to it.
Start with create a Spring Boot application:

Now Client will send JWT token to our Microservices and it will now need to validate the token with Keycloak authentication server.
How Spring Cloud OAuth2 Resource Server work with Keycloak Server?
Start by add Spring cloud oauth2 resource server to our microservice by include the following dependency to pom.xml:
<dependency>
	<groupId>org.springframework.boot</groupId>
	<artifactId>spring-boot-starter-oauth2-resource-server</artifactId>
	<exclusions>
		<exclusion>
			<groupId>com.nimbusds</groupId>
			<artifactId>nimbus-jose-jwt</artifactId>
		</exclusion>
	</exclusions>
</dependency>
And then add JWT issuer url for our Microservice to use for validating the token in properties file
# Best place for this property is to put it in the Configuration Server
spring.security.oauth2.resourceserver.jwt.issuer-uri=http://localhost:8080/auth/realms/api-realm
Now our microservices should be ready to except the call with JWT token and it will be able to veridate it with Keycloak server.
In this part we will continue adding monitoring server to our microservices.
We will use Prometheus and Grafana for the monitoring servers.
Diagram below show high-level of how these work togehter.

To implement all these with our microservices first we need to add some dependencies to our microservices.
- Add Spring Boot Actuator to enable
/actuator/prometheusend point
<dependency>
	<groupId>org.springframework.boot</groupId>
	<artifactId>spring-boot-starter-actuator</artifactId>
</dependency>- Add Micrometer registry dependency
<dependency>
	<groupId>io.micrometer</groupId>
	<artifactId>micrometer-registry-prometheus</artifactId>
</dependency>
Next, we need to allow access to /actuator/prometheus by adding a SecurityConfiguration class as below and keep other end poit secured by Keycloak.
@Configuration
public class SecurityConfiguration extends WebSecurityConfigurerAdapter {

    @Override
    protected void configure(HttpSecurity http) throws Exception {
        http.authorizeRequests()
                .mvcMatchers("/actuator/prometheus").permitAll()
                .anyRequest()
                .authenticated()
                .and()
                .oauth2ResourceServer()
                .jwt();
    }
}
Next, add some properties to properties file
management.endpoints.web.exposure.include=prometheus # Only allow access to prometheus endpoint
management.endpoint.health.show-details=always
management.metrics.tags.application=Application-Name
Prometheus is an open-source systems monitoring and alerting toolkit.
Prometheus collects and stores its metrics as time series data, i.e. metrics information is stored with the timestamp at which it was recorded, alongside optional key-value pairs called labels.
Pull Prometheus image to Docker use this command
docker pull prom/prometheusWe will make some custom configuration on to of the original one. To do this we will create a Dockerfile and our custom configuration file.
- Dockerfile
FROM prom/prometheus

ADD prometheus.yml /etc/prometheus/prometheus.yml- prometheus.yml
global:
  scrape_interval: 10s

scrape_configs:
  - job_name: 'crypto_micrometer'
    metrics_path: '/actuator/prometheus'
    scrape_interval: 5s
    static_configs:
      - targets: ['localhost:8077']
Then build Docker image
docker build -t prometheus-spring-bootAnd then run it on Docker
docker run -d -p 9090:9090 prometheus-spring-bootNow you should be able to access to Prometheus dashboard with broswer at http://localhost:9090

And graph

Grafana is also an open-source for running data analytics. We are going to use it for pulling up metrics from Prometheus server.
- Pull Grafana Docker image
docker pull grafana/grafana- Run Grafana server
docker run -p 3000:3000 grafana/grafana- Login

- Add Data Source / Prometheus

- Test Data source

- Import Dashboard

- And the Dashboard

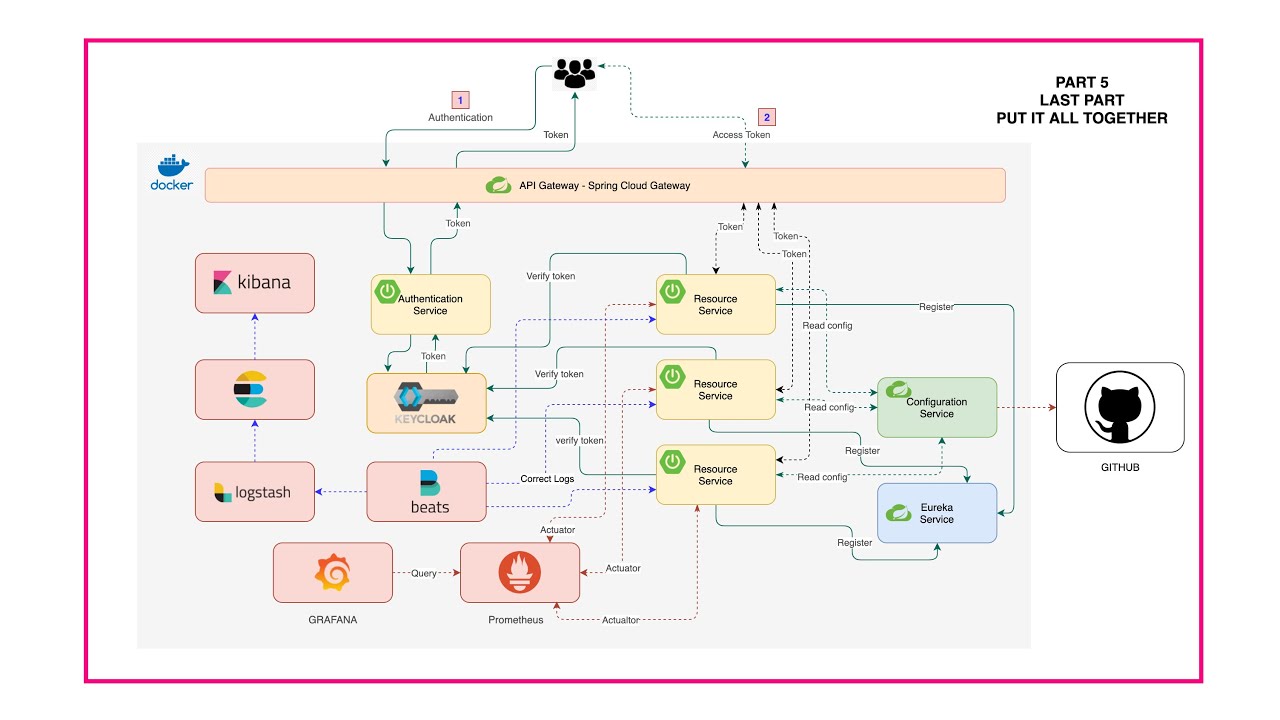
In this part we are going to implement service log aggregation with Filebeat, Logstash, Elasticsearch and Kibana.
Diagram below show hight-level over view.

Filebeat collecting logs from Docker container and send it to Logstash and Logstash sent over to Elasticsearch and then to Kibana.
First step is to add spring-cloud-starter-sleuth to our microservices and config logback log configuration on Docker.
Add Spring Cloud Sleuth dependency
<dependency>
	<groupId>org.springframework.cloud</groupId>
	<artifactId>spring-cloud-starter-sleuth</artifactId>
</dependency>
And Logstash Logback Encoder to provide logback encoders, layouts and apenders to log in JSON.
<dependency>
	<groupId>net.logstash.logback</groupId>
	<artifactId>logstash-logback-encoder</artifactId>
	<version>6.6</version>
</dependency>
Next, add logback-config.xml the Logback configuration file
<?xml version="1.0" encoding="UTF-8" ?>
<configuration>
  <include resource="org/springframework/boot/logging/logback/defaults.xml"/>
  <springProperty scope="context" name="authentication_service" source="spring.application.name" />

  <appender name="jsonConsoleAppender" class="ch.qos.logback.core.ConsoleAppender">
    <encoder class="net.logstash.logback.encoder.LoggingEventCompositeJsonEncoder" >
      <providers>
        <timestamp>
          <timeZone>UTC</timeZone>
        </timestamp>
        <version/>
        <logLevel/>
        <message/>
        <loggerName/>
        <threadName/>
        <context/>
        <patterns>
          <omitEmptyFields>true</omitEmptyFields>
          <pattern>
            {
              "trace": {
                "trace_id": "%mdc{X-B3-TraceId}",
                "span_id": "%mdc{X-B3-SpanId}",
                "parent_span_id": "%mdc{X-B3-ParentSpanId}",
                "exportable": "%mdc{X-Span-Export"
              }
            }
          </pattern>
        </patterns>
        <mdc>
          <excludeMdcKeyName>traceId</excludeMdcKeyName>
          <excludeMdcKeyName>spanId</excludeMdcKeyName>
          <excludeMdcKeyName>parentId</excludeMdcKeyName>
          <excludeMdcKeyName>spanExportable</excludeMdcKeyName>
          <excludeMdcKeyName>X-B3-TraceId</excludeMdcKeyName>
          <excludeMdcKeyName>X-B3-SpanId</excludeMdcKeyName>
          <excludeMdcKeyName>X-B3-ParentSpanId</excludeMdcKeyName>
          <excludeMdcKeyName>X-Span-Export</excludeMdcKeyName>
        </mdc>
        <stackTrace/>
      </providers>
    </encoder>
  </appender>

  <root level="INFO">
    <appender-ref ref="jsonConsoleAppender"/>
  </root>

</configuration>Next we need to pull and run servers on Docker container, we will use Docker-compose to keep everything in same place.
Here is the docker-compose file:
version: "1.0"
services:

  elasticsearch:
    image: docker.elastic.co/elasticsearch/elasticsearch:7.14.2
    ports:
      - "9200:9200"
    environment:
      - "discovery.type=single-node"
      - "ES_JAVA_OPTS=-Xms512m -Xmx512m"
    volumes:
      - ./elasticsearch/data:/usr/share/elasticsearch/data:rw

  logstash:
    image: docker.elastic.co/logstash/logstash:7.14.2
    ports:
      - "25826:25826"
      - "5044:5044"
    volumes:
      - ./logstash/pipeline:/usr/share/logstash/pipeline:ro
    restart: on-failure
    depends_on:
      - elasticsearch

  kibana:
    image: docker.elastic.co/kibana/kibana:7.14.2
    ports:
      - "5601:5601"
    restart: on-failure
    depends_on:
      - elasticsearch

  filebeat:
    image: docker.elastic.co/beats/filebeat:7.14.2
    volumes:
      - ./filebeat/filebeat_config.yml:/usr/share/filebeat/filebeat.yml:ro
      - /var/lib/docker/containers:/var/lib/docker/containers:ro
      - /var/run/docker.sock:/var/run/docker.sock:ro
      - ./filebeat/data:/usr/share/filebeat/data:rw
    user: root
    restart: on-failure
    depends_on:
      - logstash
Logstash configuration file in /logstash/pipeline/logstash.conf
input {
    beats {
        port => 5044
    }
}

output {
    elasticsearch {
        hosts => "localhost:9200"
    }
}
And /filebeat/filebeat_config.xml
filebeat.autodiscover:
  providers:
    - type: docker
      labels.dedot: true
      templates:
        - condition:
            contains:
              container.labels.collect_logs_with_filebeat: "true"
          config:
            - type: container
              format: docker
              paths:
                - "/var/lib/docker/containers/${data.docker.container.id}/*.log"
              processors:
                - decode_json_fields:
                    when.equals:
                      docker.container.labels.decode_log_event_to_json_object: "true"
                    fields: ["message"]
                    target: ""
                    overwrite_keys: true

output.logstash:
  hosts: "localhost:5044"
Now you can excute the command to run docker-compose file, if those docker image not existed so it will be auto pull by the docker.
docker-compose upAnd now we need to restart our service with extra label as below example
docker run -d -p 9999:9999 --label collect_logs_with_filebeat="true" --label decode_log_event_to_json_object="true" microservice-01:latestAll if you have many you can put everything in the docker-compose file.
Check Elasticsearch http://localhost:9200 if it is up and runnin you will see somthing like below screen

Kibana navigate to http://localhost:5601 to config and create index pattern

Create index pattern

Create logstash-* index pattern

Finaly we will have all working as below.

To stop the container you can run docker-compose down
