Code Monkey home page Code Monkey logo

echarts2shiny's Introduction

ECharts2Shiny

CRAN Status Badge

Drawing

Drawing

As an R package, ECharts2Shiny can help embed the interactive charts plotted by Apache ECharts (incubating) library into our Shiny application. Currently, we can support
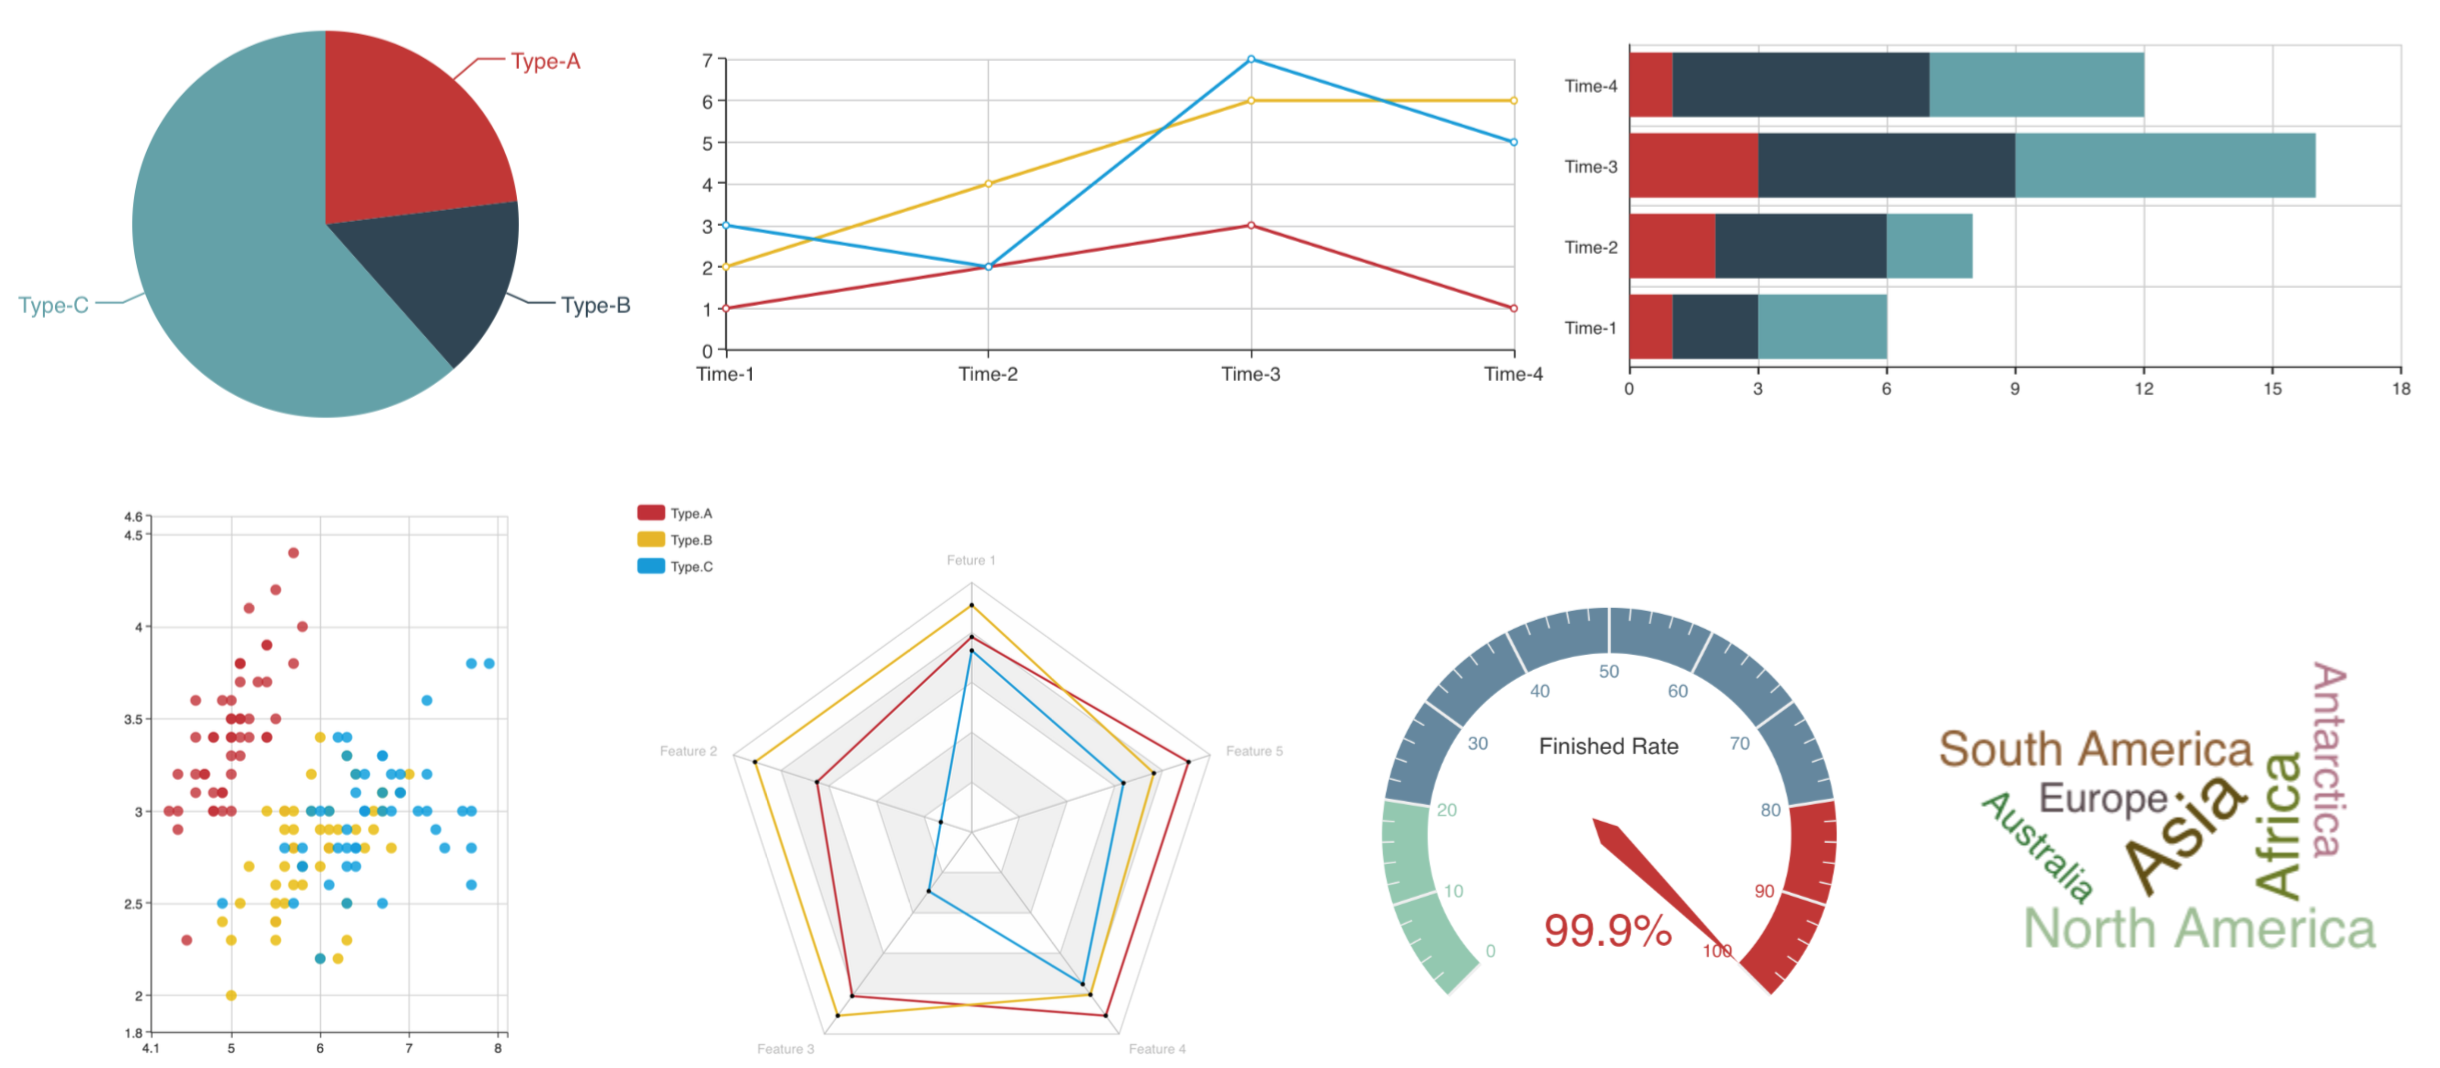
  • Pie charts
  • Line charts
  • Bar charts
  • Scatter plots
  • Radar chart
  • Gauge
  • Word Cloud
  • Tree Map
  • Heat Map

Contents

How to Install

From CRAN,

install.packages("ECharts2Shiny")

For the latest development version, please install from GitHub

library(devtools)
install_github("XD-DENG/ECharts2Shiny")

Examples

library(shiny)
library(ECharts2Shiny)

# Prepare sample data for plotting --------------------------
dat <- data.frame(c(1, 2, 3),
                  c(2, 4, 6))
names(dat) <- c("Type-A", "Type-B")
row.names(dat) <- c("Time-1", "Time-2", "Time-3")

# Server function -------------------------------------------
server <- function(input, output) {
  # Call functions from ECharts2Shiny to render charts
  renderBarChart(div_id = "test", grid_left = '1%', direction = "vertical",
                 data = dat)
}

# UI layout -------------------------------------------------
ui <- fluidPage(
  # We MUST load the ECharts javascript library in advance
  loadEChartsLibrary(),
  
  tags$div(id="test", style="width:50%;height:400px;"),
  deliverChart(div_id = "test")
)

# Run the application --------------------------------------
shinyApp(ui = ui, server = server)

Drawing

(For more examples, please refer to the /examples folder)

List of Examples

License

ECharts2Shiny package itself is under GPL-2.

The ECharts JS library is under BSD license (ECharts).

ECharts2Shiny包

CRAN Status Badge

Drawing

Drawing

ECharts2Shiny作为一个R包,可以帮助在Shiny应用程序中插入由ECharts库绘出的交互图形。当前支持的图形包括

  • 饼图 (pie chart)
  • 折线图 (line chart)
  • 柱形图 (bar chart)
  • 散点图 (scatter chart)
  • 雷达图 (radar chart)
  • 仪表盘 (gauge)
  • 词云 (word cloud)
  • 矩形树图 (Tree Map)
  • 热力图 (heat map)

目录

安装

CRAN版本

install.packages("ECharts2Shiny")

由GitHub安装最新开发版本

library(devtools)
install_github("XD-DENG/ECharts2Shiny")

例子

library(shiny)
library(ECharts2Shiny)

# Prepare sample data for plotting --------------------------
dat <- data.frame(c(1, 2, 3),
                  c(2, 4, 6))
names(dat) <- c("Type-A", "Type-B")
row.names(dat) <- c("Time-1", "Time-2", "Time-3")

# Server function -------------------------------------------
server <- function(input, output) {
  # Call functions from ECharts2Shiny to render charts
  renderBarChart(div_id = "test", grid_left = '1%', direction = "vertical",
                 data = dat)
}

# UI layout -------------------------------------------------
ui <- fluidPage(
  # We MUST load the ECharts javascript library in advance
  loadEChartsLibrary(),
  
  tags$div(id="test", style="width:50%;height:400px;"),
  deliverChart(div_id = "test")
)

# Run the application --------------------------------------
shinyApp(ui = ui, server = server)

Drawing

(请参考/examples 文件夹以获得更多实例信息)

实例列表

许可证

ECharts2Shiny 包使用GLP-2许可证。

The ECharts JS库使用BSD许可证(ECharts)。

echarts2shiny's People

Contributors

hansz00 avatar haozhu233 avatar xd-deng avatar yihengli avatar

Stargazers

 avatar  avatar  avatar  avatar  avatar  avatar  avatar  avatar  avatar  avatar  avatar  avatar  avatar  avatar  avatar  avatar  avatar  avatar  avatar  avatar  avatar  avatar  avatar  avatar  avatar  avatar  avatar  avatar  avatar  avatar  avatar  avatar  avatar  avatar  avatar  avatar  avatar  avatar  avatar  avatar  avatar  avatar  avatar  avatar  avatar  avatar  avatar  avatar  avatar  avatar  avatar  avatar  avatar  avatar  avatar  avatar  avatar  avatar  avatar  avatar  avatar  avatar  avatar  avatar  avatar  avatar  avatar  avatar  avatar  avatar  avatar  avatar  avatar  avatar  avatar  avatar  avatar  avatar  avatar  avatar  avatar  avatar  avatar  avatar  avatar  avatar  avatar  avatar  avatar  avatar  avatar  avatar  avatar  avatar  avatar  avatar  avatar  avatar  avatar  avatar

Watchers

 avatar  avatar  avatar  avatar  avatar  avatar  avatar  avatar  avatar  avatar  avatar  avatar  avatar  avatar  avatar  avatar  avatar  avatar  avatar  avatar  avatar

echarts2shiny's Issues

Switch between Bar Chart and Line Chart

magicType: {show: true, type: ['line', 'bar']},

myChart.showLoading();

$.get('data/asset/data/obama_budget_proposal_2012.list.json', function (obama_budget_2012) {
    myChart.hideLoading();

    option = {
        tooltip : {
            trigger: 'item'
        },
        toolbox: {
            show : true,
            feature : {
                mark : {show: true},
                dataView : {show: true, readOnly: false},
                magicType: {show: true, type: ['line', 'bar']},
                restore : {show: true},
                saveAsImage : {show: true}
            }
        },
        calculable : true,
        legend: {
            data:['Growth', 'Budget 2011', 'Budget 2012'],
            itemGap: 5
        },
        grid: {
            top: '12%',
            left: '1%',
            right: '10%',
            containLabel: true
        },
        xAxis: [
            {
                type : 'category',
                data : obama_budget_2012.names
            }
        ],
        yAxis: [
            {
                type : 'value',
                name : 'Budget (million USD)',
                axisLabel: {
                    formatter: function (a) {
                        a = +a;
                        return isFinite(a)
                            ? echarts.format.addCommas(+a / 1000)
                            : '';
                    }
                }
            }
        ],
        dataZoom: [
            {
                show: true,
                start: 94,
                end: 100
            },
            {
                type: 'inside',
                start: 94,
                end: 100
            },
            {
                show: true,
                yAxisIndex: 0,
                filterMode: 'empty',
                width: 30,
                height: '80%',
                showDataShadow: false,
                left: '93%'
            }
        ],
        series : [
            {
                name: 'Budget 2011',
                type: 'bar',
                data: obama_budget_2012.budget2011List
            },
            {
                name: 'Budget 2012',
                type: 'bar',
                data: obama_budget_2012.budget2012List
            }
        ]
    };

    myChart.setOption(option);

});

Issue with radar chart with like 9 features

Hello,

I just reviewed your example with shiny radar chart, it seems in the case when you have many features such as 9, your output would be almost blank unless you define the shape = "circle"

renderTreeMap doesn't accept JSON as data

Hi,

Thanks for your work.
According to the documentation, renderTreeMap should accept JSON data, however it doesn't. Even the examples used a JSON look alike: the keys have no quotes. How can I convert my JSON data whose keys have quotes to have no quotes like the one required by renderTreeMap?

great package

Great package and excited that you are making eCharts available to R. Is there a reason for not using the htmlwidgets framework? It would be great to have eCharts available for all R contexts. Thanks so much for your work on this.

How to use this package in modules

Hi Xiaodong,

I try to use this package to display a pie chart in my shiny app including modules, but there is no error and no plot shown.

ui.R

library(shiny)
library(ECharts2Shiny)

fluidPage(
  h1("Test shiny app"),
  sidebarLayout(
    sidebarPanel(
      id = "User_input",
      h1(
        textOutput("edit_inv_title"), 
        class = "text-center"
      ),
      input_ui("input")
    ),
    mainPanel(
      graph_ui("graph")
    )
  )
)

server.R

function(input, output, session){
  
  input_list <- callModule(input_module, "input")
  
  observeEvent(input_list(),{
    callModule(graph_module, "graph", input_list = input_list)
  })
}

global.R

source("modules/graph.R")
source("modules/input.R")

input.R

input_ui <- function(id){

  ns <- NS(id)
  
  tagList(
    selectInput(
      ns("select_box"),
      "Choose what content you wanna check",
      choices = c("A",
                  "B",
                  "C",
                  "D",
                  "E"))
  )
}

input_module <- function(input, output, session){
  
  input_list <- reactive({
    list("select" = input$select_box
    )
  })
  return(input_list)
}

graph.R

library(ECharts2Shiny)

graph_ui <- function(id){
  
  ns <- NS(id)
  loadEChartsLibrary()
  
  tagList(
    tags$div(id="test", style="width:50%;height:400px;"),
    deliverChart(div_id = ns("pie_chart"),
                 running_in_shiny = T)
  )
  
}

graph_module <- function(input, output, session, input_list = NULL){
  
  p1 <- reactive({
    
    if(input_list()[["select"]] == "A"){
      
     dat <- data.frame(
       name = c("A", "B", "C", "D"),
       value = c(10,20,30,40)
     )
      option_list <- list(
        "data" = dat
        )
    }
  })
  

  observeEvent(p1()$data, {renderPieChart(
    div_id = 'pie_chart',
    data = p1()$data
  )})
}

NA values in data.frame

It seems like if we have NA values in the data frame, the plots will not properly show up, though NA are originally supported by Echarts. Any ideas?

add X axis name, Y axis name.

var data = echarts.dataTool.prepareBoxplotData([
    [850, 740, 900, 1070, 930, 850, 950, 980, 980, 880, 1000, 980, 930, 650, 760, 810, 1000, 1000, 960, 960]
]);

option = {
    title: [
        {
            text: 'upper: Q3 + 1.5 * IRQ \nlower: Q1 - 1.5 * IRQ',
            borderColor: '#999',
            borderWidth: 1,
            textStyle: {
                fontSize: 14
            },
            left: '10%',
            top: '90%'
        }
    ],


    tooltip: {
        trigger: 'item',
        axisPointer: {
            type: 'shadow'
        }
    },


    grid: {
        left: '10%',
        right: '10%',
        bottom: '15%'
    },


    xAxis: {
        type: 'category',
        name:"X",
        data: data.axisData,
        boundaryGap: true,
        nameGap: 30,
        splitArea: {
            show: false
        },
        axisLabel: {
            formatter: 'expr {value}'
        },
        splitLine: {
            show: false
        }
    },


    yAxis: {
        type: 'value',
        name: 'km/s minus 299,000',
        splitArea: {
            show: true
        }
    },


    series: [
        {
            name: 'boxplot',
            type: 'boxplot',
            data: data.boxData,
            tooltip: {
                formatter: function (param) {
                    return [
                        'Experiment ' + param.name + ': ',
                        'upper: ' + param.data[4],
                        'Q3: ' + param.data[3],
                        'median: ' + param.data[2],
                        'Q1: ' + param.data[1],
                        'lower: ' + param.data[0]
                    ].join('<br/>')
                }
            }
        },
        {
            name: 'outlier',
            type: 'scatter',
            data: data.outliers
        }
    ]
};

Add line width, scatter size, point type and line type feature

For line charts, example ECharts code:

option = {
    title: {
        text: '折线图堆叠'
    },
    tooltip: {
        trigger: 'axis'
    },
    legend: {
        data:['邮件营销','联盟广告','视频广告','直接访问','搜索引擎']
    },
    grid: {
        left: '3%',
        right: '4%',
        bottom: '3%',
        containLabel: true
    },

    xAxis: {
        type: 'category',
        boundaryGap: false,
        data: ['周一','周二','周三','周四','周五','周六','周日']
    },
    yAxis: {
        type: 'value'
    },
    series: [
        {
            name:'邮件营销',
            type:'line',

            data:[120, 132, 101, 134, 90, 230, 210]
        },
        {
            name:'联盟广告',
            type:'line',

            data:[220, 182, 191, 234, 290, 330, 310]
        },
        {
            name:'视频广告',
            type:'line',

            data:[150, 232, 201, 154, 190, 330, 410]
        },
        {
            name:'直接访问',
            type:'line',
           itemStyle:{normal:{lineStyle: {width:5}}},
            data:[320, 332, 301, 334, 390, 330, 320]
        },
        {
            name:'搜索引擎',
            type:'line',
            itemStyle:{normal:{lineStyle: {width:0.5}}},
            data:[820, 932, 901, 934, 1290, 1330, 1320]
        }
    ]

};

New Feature: 矩形树图

NORMAL

    var option = {
        tooltip : {
            trigger: 'item',
            formatter: "{b}: {c}"
        },
        toolbox: {
            show : true,
            feature : {
                mark : {show: true},
                dataView : {show: true, readOnly: false},
                restore : {show: true},
                saveAsImage : {show: true}
            }
        },
        calculable : false,
        series : [
            {
                name:'Main Chart',
                type:'treemap',
                itemStyle: {
                    normal: {
                        label: {
                            show: true,
                            formatter: "{b}"
                        },
                        borderWidth: 1
                    },
                    emphasis: {
                        label: {
                            show: true
                        }
                    }
                },
                data:[
                    {
                        name: 'A',
                        value: 6,
                        children: [
                        {
                            name: 'A-1',
                            value: 6
                        },
                        {
                            name: 'A-2',
                            value: 3
                        },
                        {
                            name: 'A-3',
                            value: 3
                        }
                    ]
                    },
                    {
                        name: 'B',
                        value: 6,
                        children: [
                            {name : 'B-1',
                                value:10
                            },
                            {
                                name:"B-2",
                                value:2
                            }
                            ]
                    },
                    {
                        name: 'C',
                        value: 4
                    },
                    {
                        name: 'D',
                        value: 1
                    },
                    {
                        name: 'E',
                        value: 1
                    },
                    {
                        name: 'F',
                        value: 1
                    },
                    {
                        name: 'G',
                        value: 1
                    }
                ]
            }
        ]
    };

Step Line Chart

option = {
    title: {
        text: 'Step Line'
    },
    tooltip: {
        trigger: 'axis'
    },
    legend: {
        data:['Step Start', 'Step Middle', 'Step End']
    },
    grid: {
        left: '3%',
        right: '4%',
        bottom: '3%',
        containLabel: true
    },
    toolbox: {
        feature: {
            saveAsImage: {}
        }
    },
    xAxis: {
        type: 'category',
        data: ['Mon', 'Tue', 'Wed', 'Thu', 'Fri', 'Sat', 'Sun']
    },
    yAxis: {
        type: 'value'
    },
    series: [
        {
            name:'Step Start',
            type:'line',
            step: 'start',
            symbol:'circle',
            symbolSize:30,
            data:[120, 132, 101, 134, 90, 230, 210]
        },
        {
            name:'Step Middle',
            type:'line',
            step: 'middle',
            symbol:'triangle',
            symbolSize:20,
            data:[220, 282, 201, 234, 290, 430, 410]
        },
        {
            name:'Step End',
            type:'line',
            step: 'end',
            symbol: 'rect',
            symbolSize:20,
            data:[450, 432, 401, 454, 590, 530, 510]
        }
    ]
};

Auto-scale for scatter plots

Users should be able to choose if they want the scatter plots to be auto-scalable or they want to fix the ranges of X-axis and Y-axis.

ECharts2Shiny is conflict with shinydashboard

when I ECharts2Shiny and want to use with shinydashboard
the ui code like this 👍
library(shiny)
library(shinydashboard)
library(ECharts2Shiny)
dashboardPage(

We HAVE TO to load the ECharts javascript library in advance

loadEChartsLibrary()
tags$div(id="test", style="width:80%;height:300px;"),
deliverChart(div_id = "test")
)

the debug message is 👍
Warning: Error in tagAssert: Expected tag to be of type header
Stack trace (innermost first):
41: tagAssert
40: dashboardPage
1: runApp
Error in tagAssert(header, type = "header", class = "main-header") :
Expected tag to be of type header

Wordcloud plots to much on resize

When I resize the window of my browser, my wordcloud is "over plotted" with words and it just keeps plotting words, even though there is no space for them – thus plotting words on top of each other.

Eg. this example will fail, if you try to resize the window after you run the shiny app.

library(shiny)
library(ECharts2Shiny)

server <- function(input, output) {
  
  name <- c("salvationist", "mullion", "reality", "precedential", "externalism", "issuer", "ofaolin", "anatolian", "sanborn", "parasitic", "unviolative", "louvar", "gomphiasis", "finder", "holosericeous", "heavenwardness", "broomcorn", "brilliance", "gink", "cardanus", "nondiligence", "actuaries", "bibl", "ridden", "baronized", "ruralize", "jollify", "agrobiologic", "hamiltonian", "amazon", "bradyauxetically", "gnat", "vinylating", "cajeput", "hopple", "tensionless", "envisaged", "bok", "nondecorative", "desilverize", "somniorum", "henna", "internidal", "antimissile", "predisliked", "feeling", "whangdoodle", "dejectedness", "contumaciousness", "redaction", "redoubt", "xanthosiderite", "likeability", "court", "iliad", "muffle", "pinging", "trieste", "palliasse", "jesuitically", "decamerous", "mercerizing", "kahuna", "overfactitious", "administratively", "loxodromy", "colonate", "pocked", "reinfusing", "incardinate", "unremonstrant", "nonfacultative", "junkie", "mithraism", "outdespatch", "nutria", "arcaded", "tumescent", "affecting", "prepronouncing", "unsatanic", "overbred", "jackassness", "bibliophilic", "unapprehendable", "tauranga", "intermetallic", "circumjacency", "isiacal", "unexcrescent", "unrebated", "overplentiful", "pahang", "excruciate", "dematerialising", "unmigratory", "renvoi", "overprecise", "nonrustable", "outspinned")
  value <- sample(1:100, 100, replace=FALSE)
  
  wcdata <- data.frame(name, value, stringsAsFactors = FALSE)
  
  renderWordcloud(div_id = "test", data = wcdata)
  
}

ui <- fluidPage(
  loadEChartsLibrary(),
  div(id="test", style="width:100%;height:500px;"),
  deliverChart(div_id = "test"),
  title = "Shiny UI version"
)

shinyApp(ui = ui, server = server)

ECharts2Shiny even treactive problem (data error)

ECharts2Shiny seems not to process the reactive

library(shiny)
library(ECharts2Shiny)
library(DT)

ui <- fluidPage(# App title ----
titlePanel("Uploading Files"),

            sidebarLayout(
              sidebarPanel(
                fileInput(
                  "file1",
                  "Choose CSV File",
                  multiple = FALSE,
                  accept = c("text/csv",
                             "text/comma-separated-values,text/plain",
                             ".csv")
                ),
                actionButton("do", "RUN")
                
                # Horizontal line ----
              ),
              
              mainPanel(
                DT::dataTableOutput("mytable"),
                deliverChart(div_id = "echart"),
                plotOutput('basic')
              )
              
            ))

analysis <- function(data_up) {
expr <-
read.table(
data_up,
header = TRUE,
sep = "\t",
fill = TRUE,
row.names = 1
)
expr <- as.matrix(expr)
resu_list <- list(resu = expr[1:10, 1:3], exp = expr[1:100, 1:3])
}

server <- function(input, output) {
results <- eventReactive(input$do, {
inFile <- input$file1
if (is.null(inFile))
return(NULL)
analysis(inFile$datapath)
})

output$mytable <- DT::renderDataTable({
withProgress(
message = 'Calculation in progress',
detail = 'This may take a while...',
value = 0,
expr = {
df <- results()
result <- df$resu
}
)
DT::datatable(
result,
extensions = 'Buttons',
options = list(
language = list(url = '//cdn.datatables.net/plug-ins/1.10.11/i18n/English.json'),
searchHighlight = TRUE,
dom = 'lBfrtip',
scrollX = TRUE,
fixedColumns = list(leftColumns = 2, rightColumns = 1),
buttons = c('csv', 'excel', 'pdf'),
lengthMenu = c(10, 20, 50, -1)
)
)
})

output$basic <- renderPlot({
plot(results()$exp, type = 'l')

})

renderLineChart(
div_id = "echart",
data = results()$exp,
step = "null",
show.legend = FALSE,
show.tools = TRUE,
show.slider.axis.x = TRUE,
font.size.axis.x = 0.2
)

}
shinyApp(ui, server)

Theme parameter of renderGauge() has no effect

Hello,

I am trying to add a Gauge and currently look at the manual for renderGauge. I notice that the suggested theme options ( "default", "roma", "infographic", "macarons", "vintage", "shine", "caravan", "dark-digerati", "jazz", and "london") produce the same result when I run the example from the manual:

if (interactive()) {
  library(shiny)
  library(ECharts2Shiny)
  
  
  # Server function -------------------------------------------
  server <- function(input, output) {
    # Call functions from ECharts2Shiny to render charts
    renderGauge(div_id = "test",rate = 99, gauge_name = "Finish Rate", theme = "dark-digerati")
  }
  
  # UI layout -------------------------------------------------
  ui <- fluidPage(
    # We MUST load the ECharts javascript library in advance
    loadEChartsLibrary(),
    
    tags$div(id="test", style="width:50%;height:400px;"),
    deliverChart(div_id = "test")
  )
  
  # Run the application --------------------------------------
  shinyApp(ui = ui, server = server)
}

Is this only me? I am trying to replicate the design found here that looks really awesome, but I can't. Thank you!

Data Labels in Echarts2Shiny

I see the labels when I hover over the bars. However I would like to have a option to add printable labels on top or inside of the bars. Is it possible within this package?

Best,
Baptista

Add hyperlink (URL) to the widget, like the bar in the bar charts

To implement this feature for Pie charts, Line charts, Bar charts, word cloud.

Example of Bar Charts

<!DOCTYPE html>
<html>
<head>
    <meta charset="utf-8">
    <title>ECharts</title>
    <!-- 引入 echarts.js -->
    <script src="echarts.min.js"></script>
</head>
<body>
    <!-- 为ECharts准备一个具备大小(宽高)的Dom -->
 <div id="main" style="width: 600px;height:400px;"></div>
    <script type="text/javascript">
        // 基于准备好的dom,初始化echarts实例
        var myChart = echarts.init(document.getElementById('main'));

        // 指定图表的配置项和数据
        var option = {
            title: {
                text: 'ECharts 入门示例'
            },
            tooltip: {},
            legend: {
                data:['销量']
            },
            xAxis: {
                data: ["衬衫","羊毛衫","雪纺衫","裤子","高跟鞋","袜子"]
            },
            yAxis: {},
            series: [{
                name: '销量',
                type: 'bar',
                data: [5, 20, 36, 10, 10, 20]
            }]
        };

        // 使用刚指定的配置项和数据显示图表。
        myChart.setOption(option);

            myChart.on('click', function (param){
                    var name=param.name;
                    if(name=="衬衫"){
                        window.location.href="http://me.seekingqed.com";
                    }else if(name=="羊毛衫"){
                        window.location.href="https://github.com";
                    }else if(name=="雪纺衫"){
                        window.location.href="https://google.com";
                    }else{
                        window.location.href="https://nus.com.sg";
                    }                       
                });
                myChart.on('click',eConsole);


    </script>
</body>
</html>

Add Radar Chart

option = {
    tooltip: {},

    legend: {
        data: ['Type A', 'Type B', "Type C"]
    },
    radar: {

        // shape: 'circle',

        indicator: [
           { name: 'A', max: 6500},
           { name: 'B', max: 16000},
           { name: 'C', max: 30000},
           { name: 'D', max: 38000},
           { name: 'E', max: 52000}
        ]
    },
    series: [{
        type: 'radar',

        // areaStyle: {normal: {}},
         itemStyle: {
                    normal: {
                        lineStyle: {
                          width:3
                        }
                    },
                    emphasis : {
                        areaStyle: {color:'rgba(0,250,0,0.3)'}
                    }
                },

        data : [
            {
                value : [4300, 10000, 25000, 35000, 50000],
                name : 'Type A'
            },
             {
                value : [5000, 14000, 28000, 31000, 42000],
                name : 'Type B'
            },
                        {
                value : [4000, 2000, 9000, 29000, 35000],
                name : 'Type C'
            },
        ]
    }]
};

Add Boxplot

var data = echarts.dataTool.prepareBoxplotData([
    [850, 740, 900, 1070, 930, 850, 950, 1000, 960, 960, 1500],
    [210,280,250],
    [100, 200, 110]

]);

option = {

    tooltip: {
        trigger: 'item',
        axisPointer: {
            type: 'shadow'
        }
    },


    grid: {
        left: '10%',
        right: '10%',
        bottom: '5%'
    },


    xAxis: {
        type: 'category',
        name:"X Axis name here",
        data: ['A', 'B', "C"],
        boundaryGap: true,
        nameGap: 3,
        axisLabel: {
            formatter: '{value}'
        }
    },


    yAxis: {
        type: 'value',
        name: 'Give Y axis name here'
    },


    series: [
        {
            name: 'boxplot',
            type: 'boxplot',
            data: data.boxData,
            tooltip: {
                formatter: function (param) {
                    return [
                        param.name + ': ',
                        'upper: ' + param.data[4],
                        'Q3: ' + param.data[3],
                        'median: ' + param.data[2],
                        'Q1: ' + param.data[1],
                        'lower: ' + param.data[0]
                    ].join('<br/>')
                }
            }
        },
        {
            name: 'outlier',
            type: 'scatter',
            data: data.outliers
        }
    ]
};

Data Format

As we have diverse kinds of charts, we need to prepare data into diverse formats.

Currently, the data formats we allow seems "too" diverse, like for pie charts, we use column names to lable data; for lines charts, we column names together with row names; for scatter plot, we have a separate column to leble observations.

This may be confusing for users.

We need to think seriously about how we unify the data format for diverse charts.

增强NA值的处理

你好,

我在使用该包render条形图时发现NA值的处理不是很好。

为了符合函数的需要,我把数据转换成为了矩阵的形式

image

实际上,某一列只有一行才有有值。虽然绘图显示的时候已经做好了处理,但条形图显示信息的时候还是会显示有NA值的。怎么去掉这些数据呢?

image

祝好,

诗翔

Issues and suggestions

Hello,
Thanks for the great package, I love how slick it is, and how easy it is to work with.
I have a few roadblocks that I've encountered while trying to work it, though.

  1. In line charts, is it possible to toggle off one of the lines by default?
  2. I can't find any way to edit tooltips on hover. For example, I am working with a stacked percentage bar chart, and have two columns that I'm plotting with: % complete and % incomplete. When the % complete is 100, I do not want "% incomplete: 0" to show. Additionally, I would like to show other information in the tooltip as well.
  3. I am not getting any warnings, but ECharts does not plot bar charts when there is more than 10 items, and does not plot pie charts when there is more than 30 items. Is there any hard limitation to this or would it be possible to extend charts to more items?
  4. "Theme" does not seem to do anything. I've tried with macarons, London, vintage, etc.
    renderBarChart(div_id = "chartBar",
                     direction = "horizontal", grid_left = "10%",
                     stack_plot = TRUE,
                     data = dat_2, 
                     theme = "shine")
  1. Also, I would like to disable some of the tools in the tool panel, but currently I can only disable the whole tool panel.
  2. And finally, would it be possible to add functionality for adding a background image to the plots?
    Thanks!

Echarts2Shiny and Shinyapps.io

@XD-DENG
Hi, wondering do you by any chance use or know shinyapps.io? I am currently using this platform for all my shiny apps.

I recently used a package named "rsconnect" (https://github.com/rstudio/rsconnect) to deploy the code to their server. For any package installed from github, it should smoothly get installed from their server as well.
library(devtools) install_github('XD-DENG/ECharts2Shiny')

However, for ECharts2Shiny I got following message:

`Preparing to deploy application...DONE
Uploading bundle for application: 117613...DONE
Deploying bundle: 519952 for application: 117613 ...
Waiting for task: 220596791
building: Parsing manifest
building: Building image: 511546
building: Building package: ECharts2Shiny

########################## Begin Task Log
########################### End Task Log

Error: Unhandled Exception: Child Task 220596793 failed: Error building image: Error fetching ECharts2Shiny (0.1.5) source. unable to satisfy package: ECharts2Shiny (0.1.5)`

For some reason, shinyapps still goes to CRAN to fetch this package instead of Github. (So version doen't match) I doubt if somewhere in the package force the installation to go that way?

Alternatively, if I use install.packages('ECharts2Shiny'), the deployment will be no problem (for ver 0.1.2). Any advice?

Users should be able to choose to have lable in pie chart or not

Example code:

http://echarts.baidu.com/demo.html#pie-roseType

option = {
    title : {
        text: '南丁格尔玫瑰图',
        subtext: '纯属虚构',
        x:'center'
    },
    tooltip : {
        trigger: 'item',
        formatter: "{a} <br/>{b} : {c} ({d}%)"
    },
    legend: {
        x : 'center',
        y : 'bottom',
        data:['rose1','rose2','rose3','rose4','rose5','rose6','rose7','rose8']
    },
    toolbox: {
        show : true,
        feature : {
            mark : {show: true},
            dataView : {show: true, readOnly: false},
            magicType : {
                show: true,
                type: ['pie', 'funnel']
            },
            restore : {show: true},
            saveAsImage : {show: true}
        }
    },
    calculable : true,
    series : [
        {
            name:'半径模式',
            type:'pie',
            radius : [20, 110],
            center : ['25%', '50%'],
            roseType : 'radius',
            label: {
                normal: {
                    show: false
                },
                emphasis: {
                    show: true
                }
            },
            lableLine: {
                normal: {
                    show: false
                },
                emphasis: {
                    show: true
                }
            },
            data:[
                {value:10, name:'rose1'},
                {value:5, name:'rose2'},
                {value:15, name:'rose3'},
                {value:25, name:'rose4'},
                {value:20, name:'rose5'},
                {value:35, name:'rose6'},
                {value:30, name:'rose7'},
                {value:40, name:'rose8'}
            ]
        },
        {
            name:'面积模式',
            type:'pie',
            radius : [30, 110],
            center : ['75%', '50%'],
            roseType : 'area',
            data:[
                {value:10, name:'rose1'},
                {value:5, name:'rose2'},
                {value:15, name:'rose3'},
                {value:25, name:'rose4'},
                {value:20, name:'rose5'},
                {value:35, name:'rose6'},
                {value:30, name:'rose7'},
                {value:40, name:'rose8'}
            ]
        }
    ]
};

map

this package support for emap?

Add Scatter chart

Example JS code

option = {
    tooltip: {
        trigger: 'axis',
        axisPointer:{
            show: true,
            type : 'cross',
        }
    },

    legend: {
        data:['I','II']
    },

//    xAxis: [
//        {gridIndex: 0, min: -2, max: 20}
 //   ],
//    yAxis: [
 //       {gridIndex: 0, min: -10, max: 15}
 //   ],

    xAxis : [
        {
            type : 'value',
            scale:true
        }
    ],
    yAxis : [
        {
            type : 'value',
            scale:true
        }
    ],

    toolbox: {
        show : true,
        feature : {
            dataZoom : {show: true},
            restore : {show: true},
            saveAsImage : {show: true}
        }
    },

    series: [
        {
            name: 'I',
            type: 'scatter',
            symbolSize: 20,
            data: [
                        [10.0, 8.04],
                        [8.0, 6.95],
                        [13.0, -7.58]
                   ]
        },
         {
            name: 'II',
            type: 'scatter',
            symbolSize: 20,
            data:  [
                        [-1.0, 4.26],
                        [12.0, 10.84],
                        [7.0, 4.82],
                        [5.0, -5.68]
                    ]
        }
    ]
};

New Features & Big Changes in Version 0.1.5

[1] Line Charts, Bar Charts and Scatter Plots can deal with NA values now.

[2] Added font.size.legend argument for all charts with legend bar applicable, to help users better customize the legend bar.

[3] Added arguments font.size.axis.x, font.size.axis.y, rotate.axis.x, and rotate.axis.y for line charts, bar charts, and scatter plots. These arguments can help users better customize the charts.

[4] Added Heat Map function.

Respond to the change in reactive data

The current version can use reactive data from reactive() function. BUT, if there is any change in the reactive data, actually the chart can't update automatically.

This is a big drawback.

What we would want is: once the data is updated, the chart should respnd to the change too, i.e., the chart should be updated automatically.

how to use connect option?

the echarts has connect options which can connect multi plot, does Echarts2Shiny support this feature?

Add custom themes for ECharts 3.0 to ECharts2Shiny?

Hi - I've created a collection of custom themes for ECharts 3.0 and I was asked on Twitter for a way to reference the themes in Shiny - Here's a link to the tweet: https://twitter.com/d8aninja/status/849694305946148864

I found your ECharts2Shiny R package googling Rstats and Shiny - I'm not familiar with either.

Would it be at all possible for these custom themes to be incorporated into your ECharts2Shiny R package?

Here's a link to the GitHub post where I've uploaded two zip files that contain JS theme files and example charts: apache/echarts#5360

If this is something that wouldn't be difficult for you to do, I think some Rstats programmers would appreciate the extra themes.

Thanks, Janet

New Features & Big Changes Since Version 0.1.2

  1. Added STACK line plot;
  2. Added STACK bar plot.
  3. For bar chart, added one more option about "stack" or "tiled", so that end-users can choose and change between "stack" and "tiled" in the final interactive charts;
  4. Added options to determine if we show legends or not, and if we show tool bar or not.
  5. Added Scatter plots (including the auto.scale argument for it).
  6. We use includeScript() function to help include JS files into the apps, so that we no longer need to explicitly build a "www" folder and copy the JS scripts into the users' Shiny apps. This is a quite big progress for this pacakge.
  7. Figured out the reactive data issue. Previously, if we use reactive() function to introduce some data and use it to plot with this package, we will encounter scope error. But now we can use reactive data seamlessly (by making use of isolate() function in our functions). This is a big progress too.
  8. Additiaonlly, regarding the reactive data, we solved the issue in which the chart can't respond to the change in the reactive data. That is, we can use input$ to change the reactive data, but the chart will not be updated accordingly automatically. Fortunately, we found that this issue can be perfectly solved by using the chart rendering function together with the observeEvent() function.
  9. Added Radar charts feature.
  10. Added wordcloud feature using the extension publised by ECharts team recently.

HTML ui

Hi

I was wondering, what I need to do for ECharts2Shiny to work with HTML ui?

Conflict Caused by Word Cloud Extension

As we're using a separate extension for word cloud feature, seems like it caused some conflicts with other charts.

If we plot word clouds and other charts in one app, we get error.

Recommend Projects

  • React photo React

    A declarative, efficient, and flexible JavaScript library for building user interfaces.

  • Vue.js photo Vue.js

    🖖 Vue.js is a progressive, incrementally-adoptable JavaScript framework for building UI on the web.

  • Typescript photo Typescript

    TypeScript is a superset of JavaScript that compiles to clean JavaScript output.

  • TensorFlow photo TensorFlow

    An Open Source Machine Learning Framework for Everyone

  • Django photo Django

    The Web framework for perfectionists with deadlines.

  • D3 photo D3

    Bring data to life with SVG, Canvas and HTML. 📊📈🎉

Recommend Topics

  • javascript

    JavaScript (JS) is a lightweight interpreted programming language with first-class functions.

  • web

    Some thing interesting about web. New door for the world.

  • server

    A server is a program made to process requests and deliver data to clients.

  • Machine learning

    Machine learning is a way of modeling and interpreting data that allows a piece of software to respond intelligently.

  • Game

    Some thing interesting about game, make everyone happy.

Recommend Org

  • Facebook photo Facebook

    We are working to build community through open source technology. NB: members must have two-factor auth.

  • Microsoft photo Microsoft

    Open source projects and samples from Microsoft.

  • Google photo Google

    Google ❤️ Open Source for everyone.

  • D3 photo D3

    Data-Driven Documents codes.