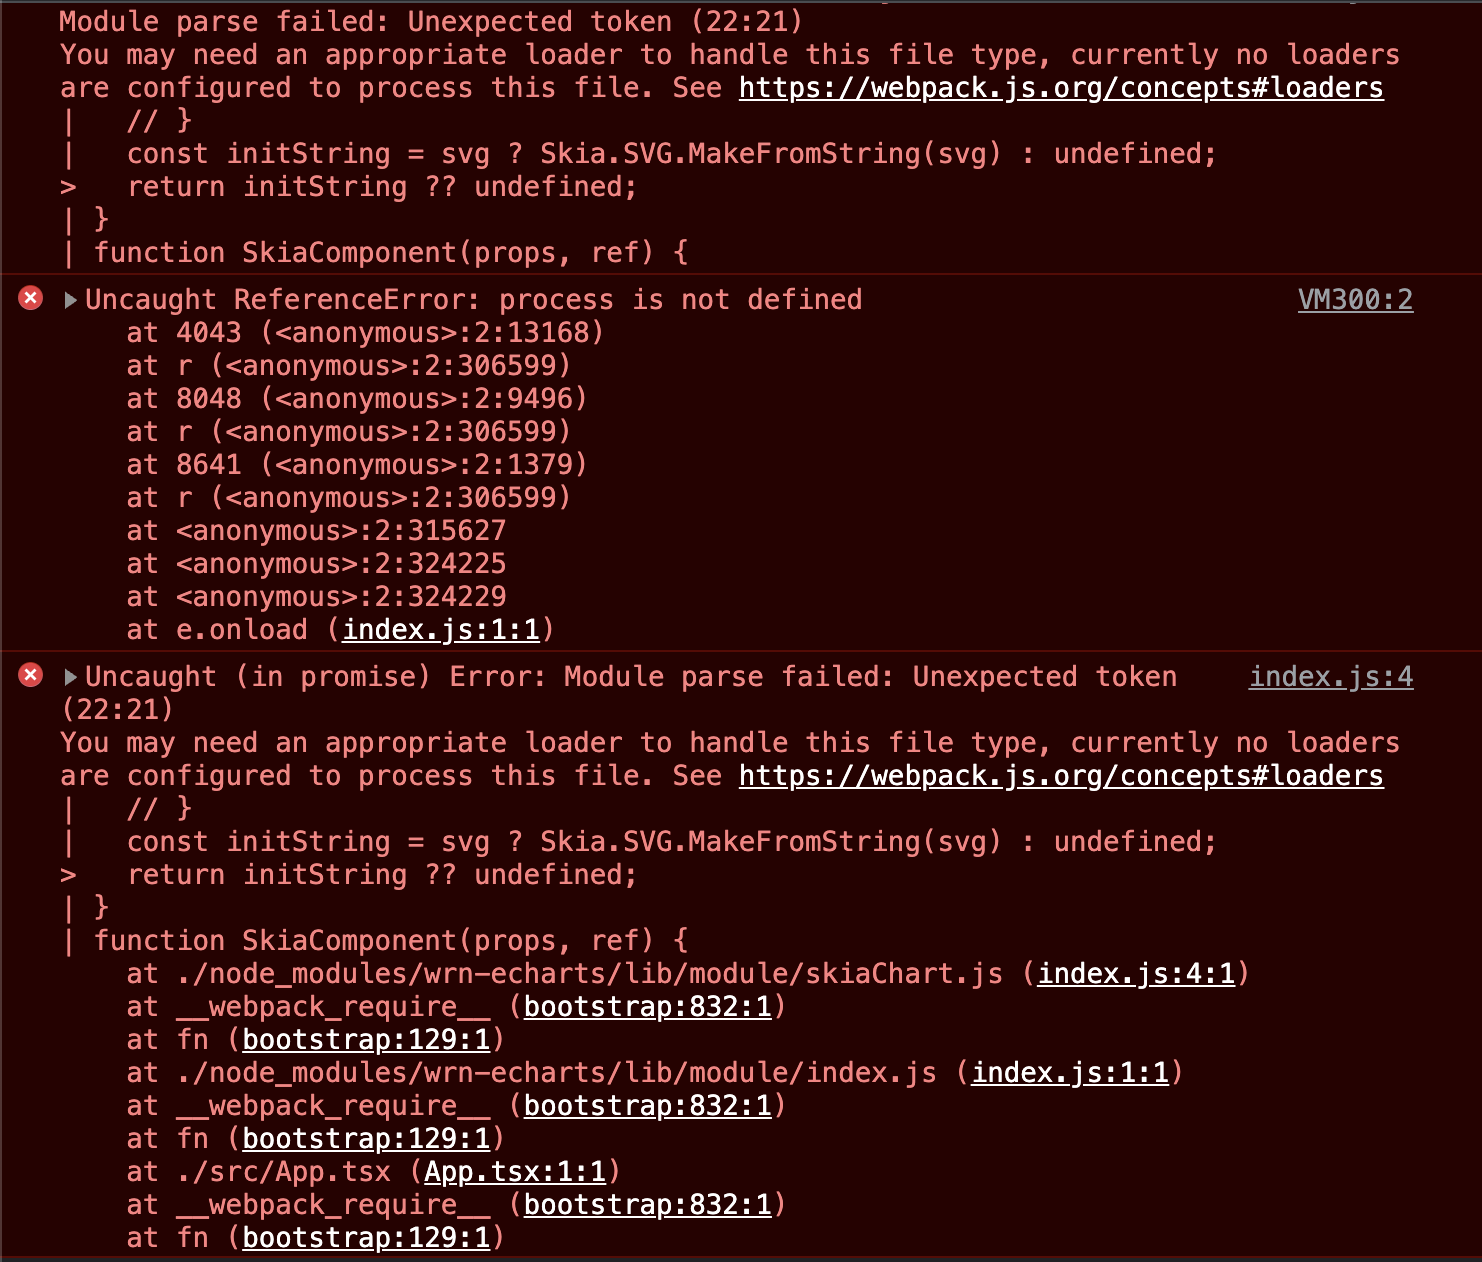
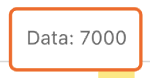
SvgChart option 增加 markPoint 不显示
const option = {
animation: true,
tooltip: {
show: false,
},
grid: {
top: "20%",
left: 17,
right: 17,
bottom: "20%",
},
xAxis: [
{
type: "time",
axisLabel: {
fontSize: 10,
align: "center",
showMaxLabel: true,
formatter: "{MM}.{dd}",
},
axisPointer: {
type: "shadow",
},
axisLine: {
show: true,
lineStyle: {
color: "#CCD2E3",
align: "left",
cap: "round",
},
},
splitLine: {
show: true,
interval: 0,
lineStyle: {
type: "dashed",
},
},
axisTick: {
show: false,
},
},
],
yAxis: [
{
show: false,
type: "value",
min: 0,
max: 100,
interval: 20,
axisTick: {
lineStyle: {
color: "rgba(104, 183, 219, 0.2)",
},
},
axisLabel: {
formatter: "{value}",
fontSize: 10,
color: "#333",
},
},
],
series: [
{
name: "效率",
type: "line",
symbol: "circle",
connectNulls: true,
symbolSize: 6,
itemStyle: {
color: "#77C176",
},
labelLine: {
lineStyle: {
color: "#f00",
},
},
lineStyle: {
width: 1,
color: "#77C176",
},
label: {
show: true,
position: "top",
distance: 8,
formatter: "{@[1]}%",
fontSize: 10,
color: "#77C176",
fontWeight: "400",
lineHeight: 11,
},
markPoint: {
emphasis: {
disabled: true,
},
animation: false,
data: [
{
name: "markPoint",
value: "",
xAxis: "2022-04-24",
yAxis: 0,
symbol: "circle",
symbolSize: [10, 10],
itemStyle: { color: "#FFC700" },
},
],
},
data: [
["2022-04-18", 10],
["2022-04-19", 20],
["2022-04-20", "unchecked"],
["2022-04-21", "x"],
["2022-04-22", 100],
["2022-04-23", "checkable"],
["2022-04-24", "today"],
],
},
],
};
"@wuba/react-native-echarts": "^1.0.0"
"echarts": "^5.4.2",
![dependabot[bot] avatar](https://avatars.githubusercontent.com/in/29110?v=4 "dependabot[bot]")