Code Monkey home page Code Monkey logo

atom-bugs's Introduction

This repository has been moved to willyelm/xatom-debug

apm standard apm

Atom Bugs

Atom Bugs is a super simple Javascript debugger for Atom

overview

Features

  • In Atom editor 
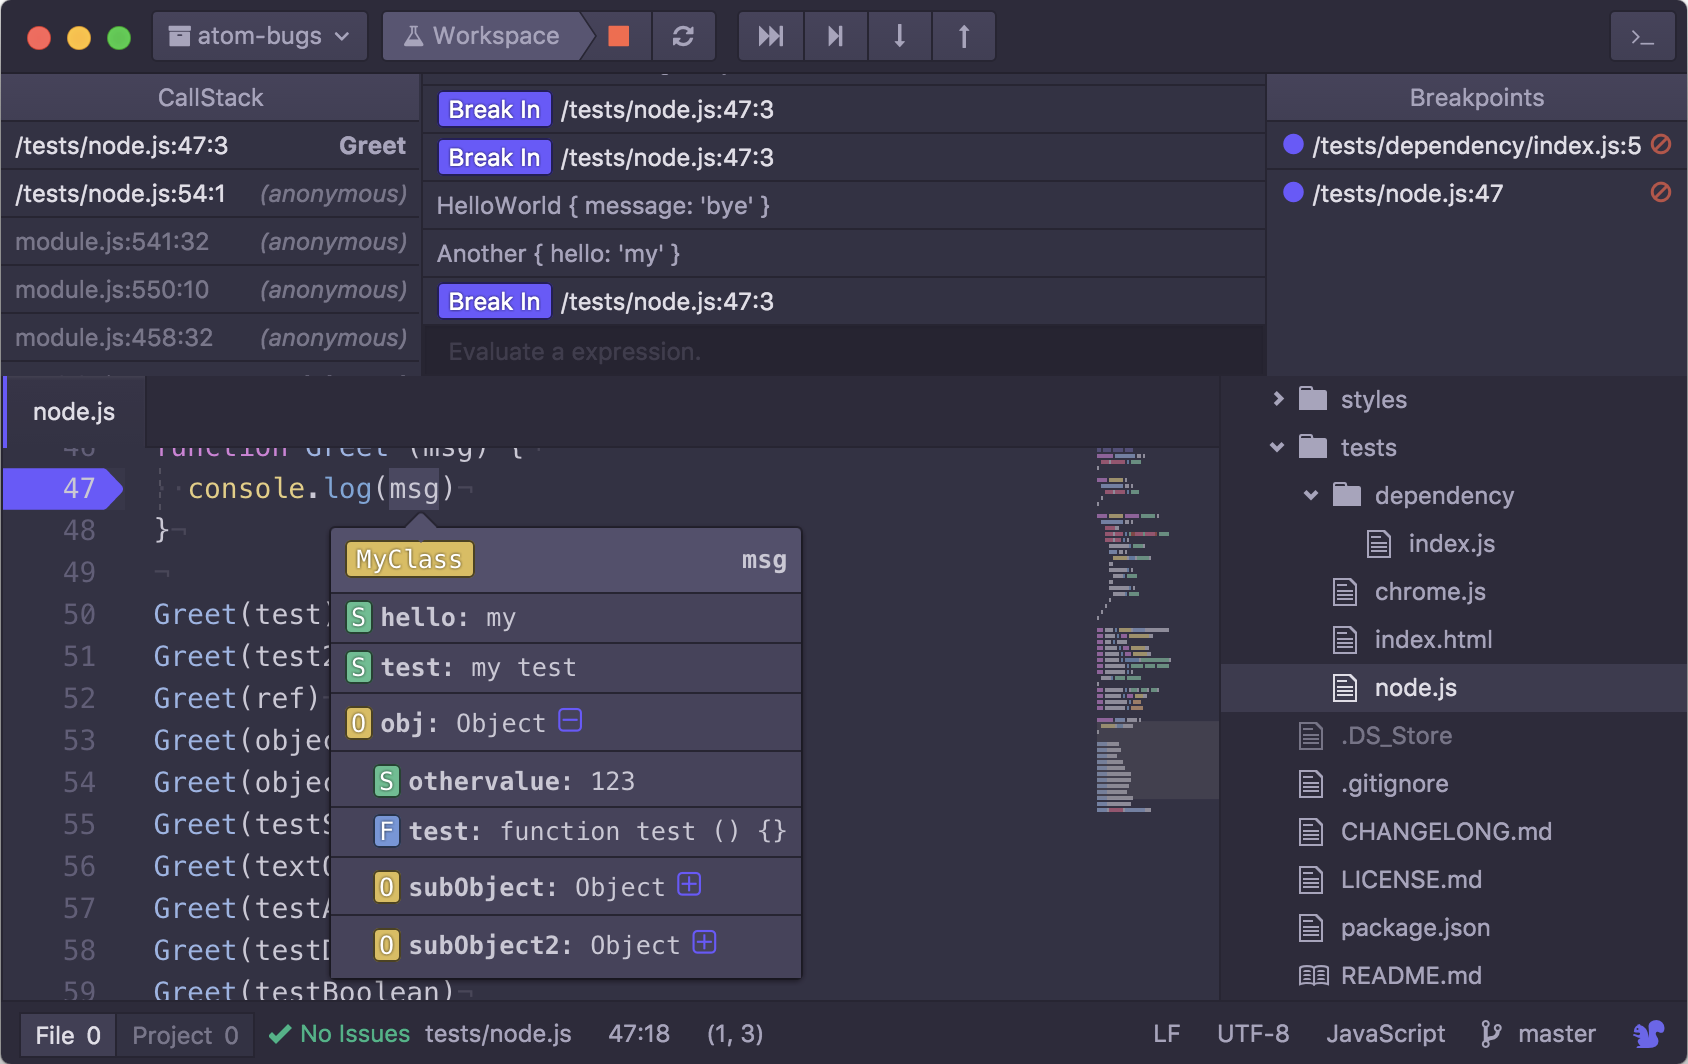
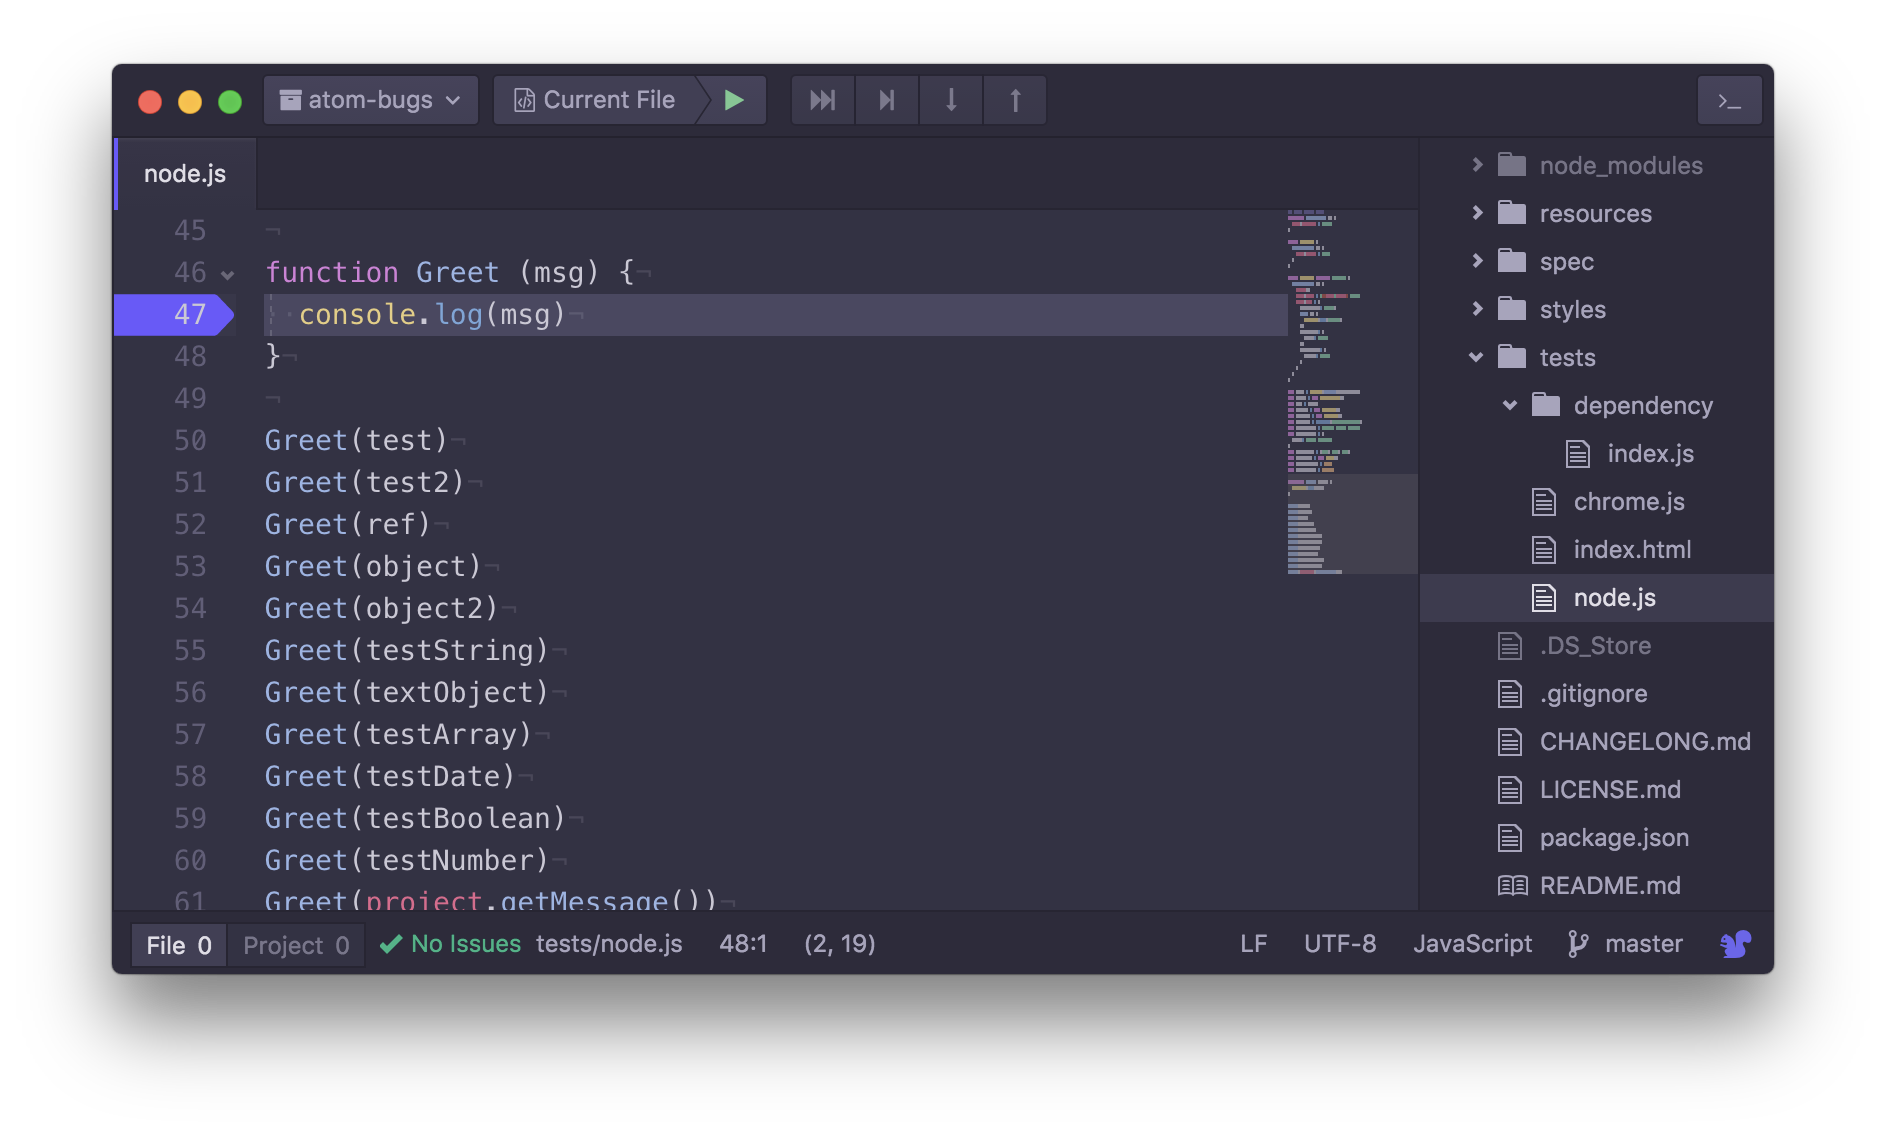
quick breakpoints. Simply open the file and click on the line number to toggle the breakpoint.
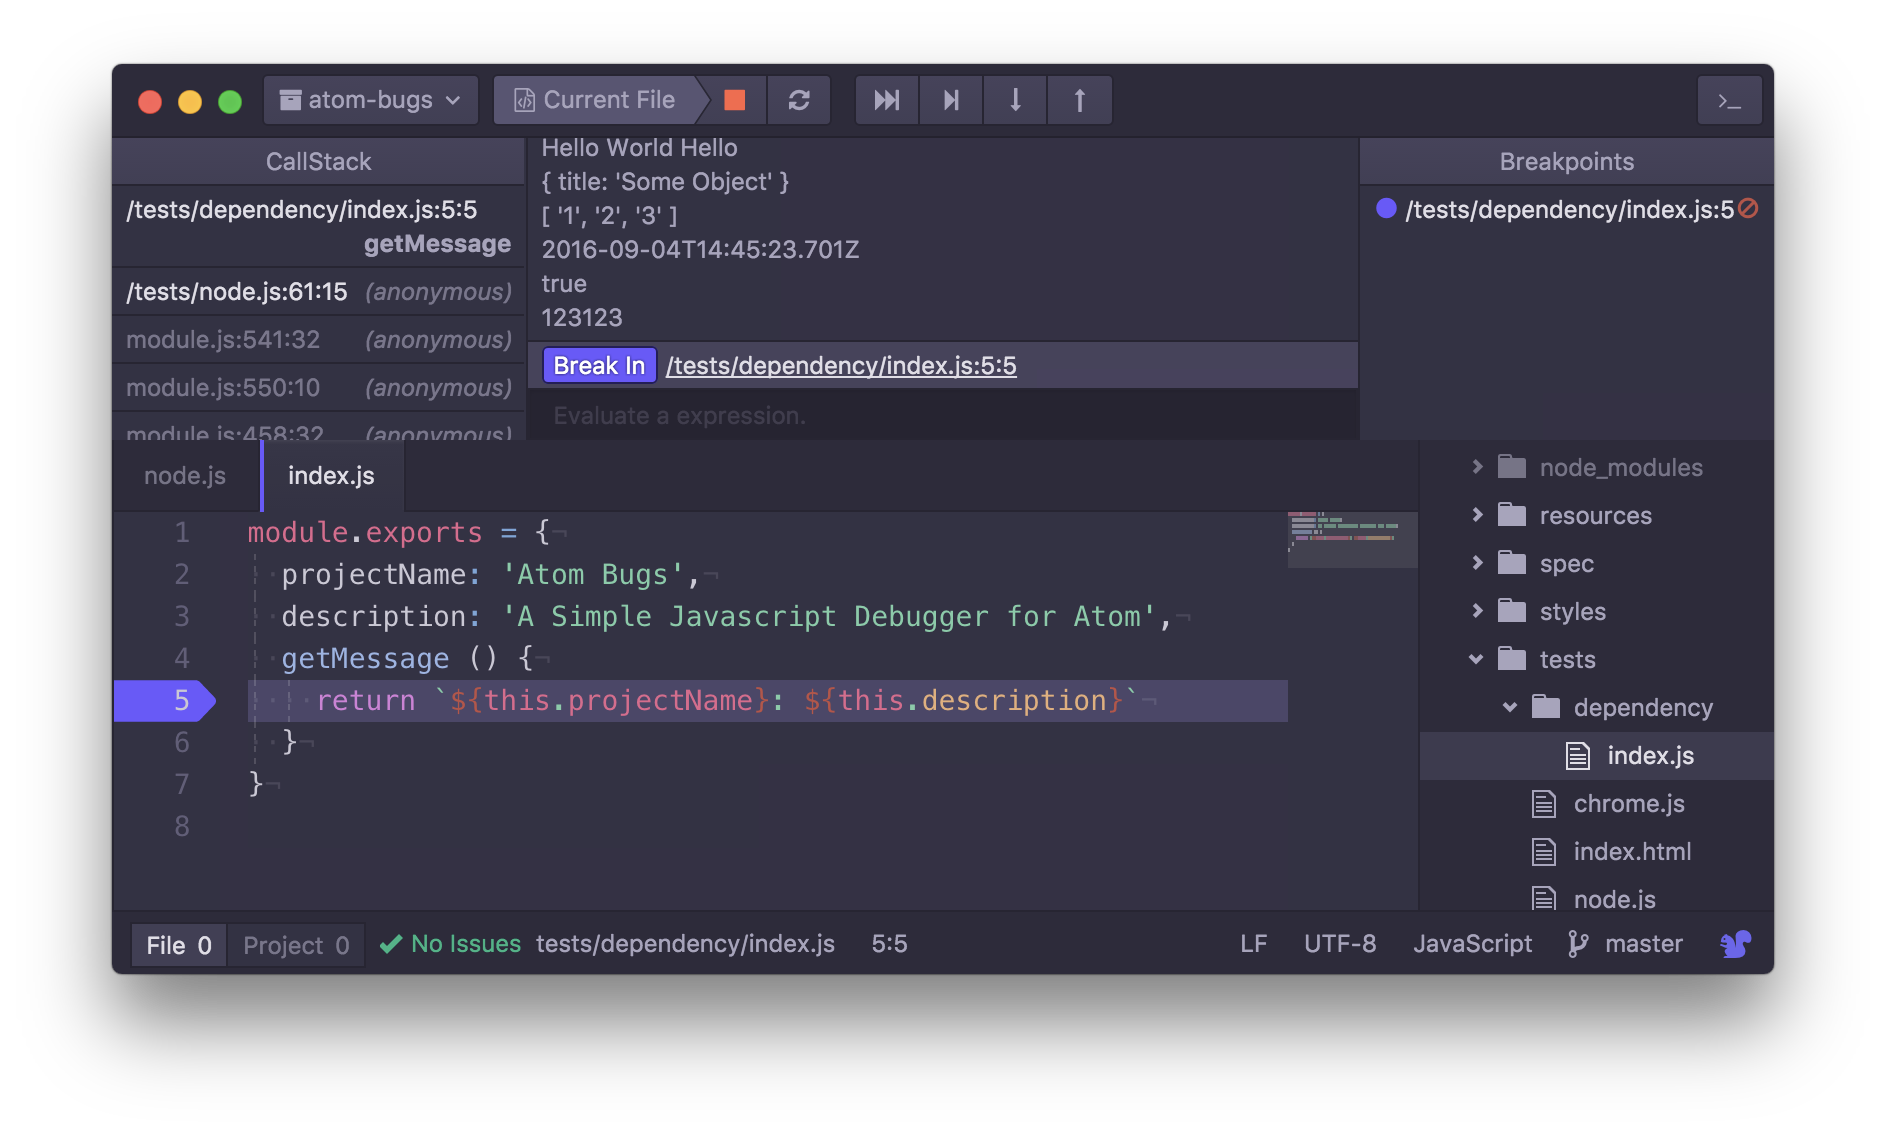
breakpoint

  • Open file reference on the line where it did break. from the debug console by just clicking on the file path.

file

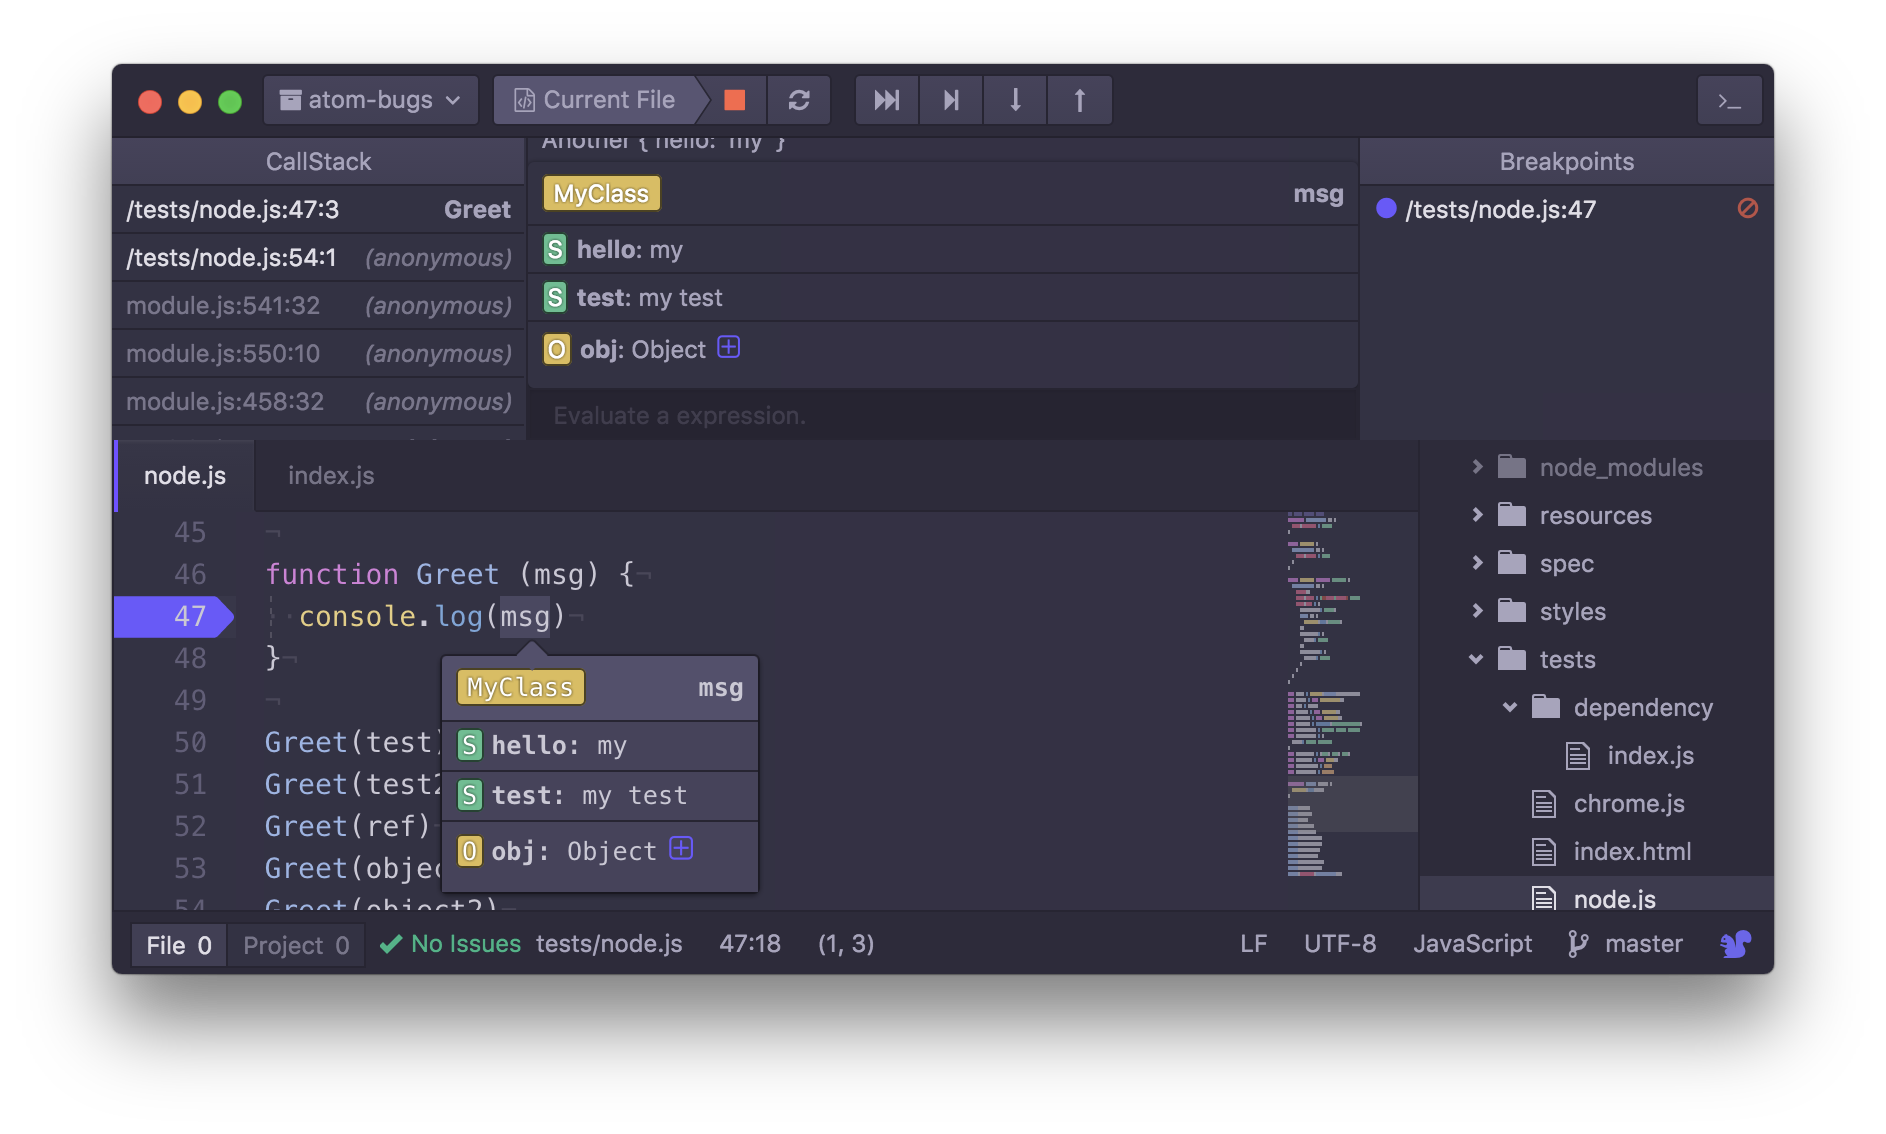
  • Use the console input and word selector to evaluate expressions(REPL) on the current frame.
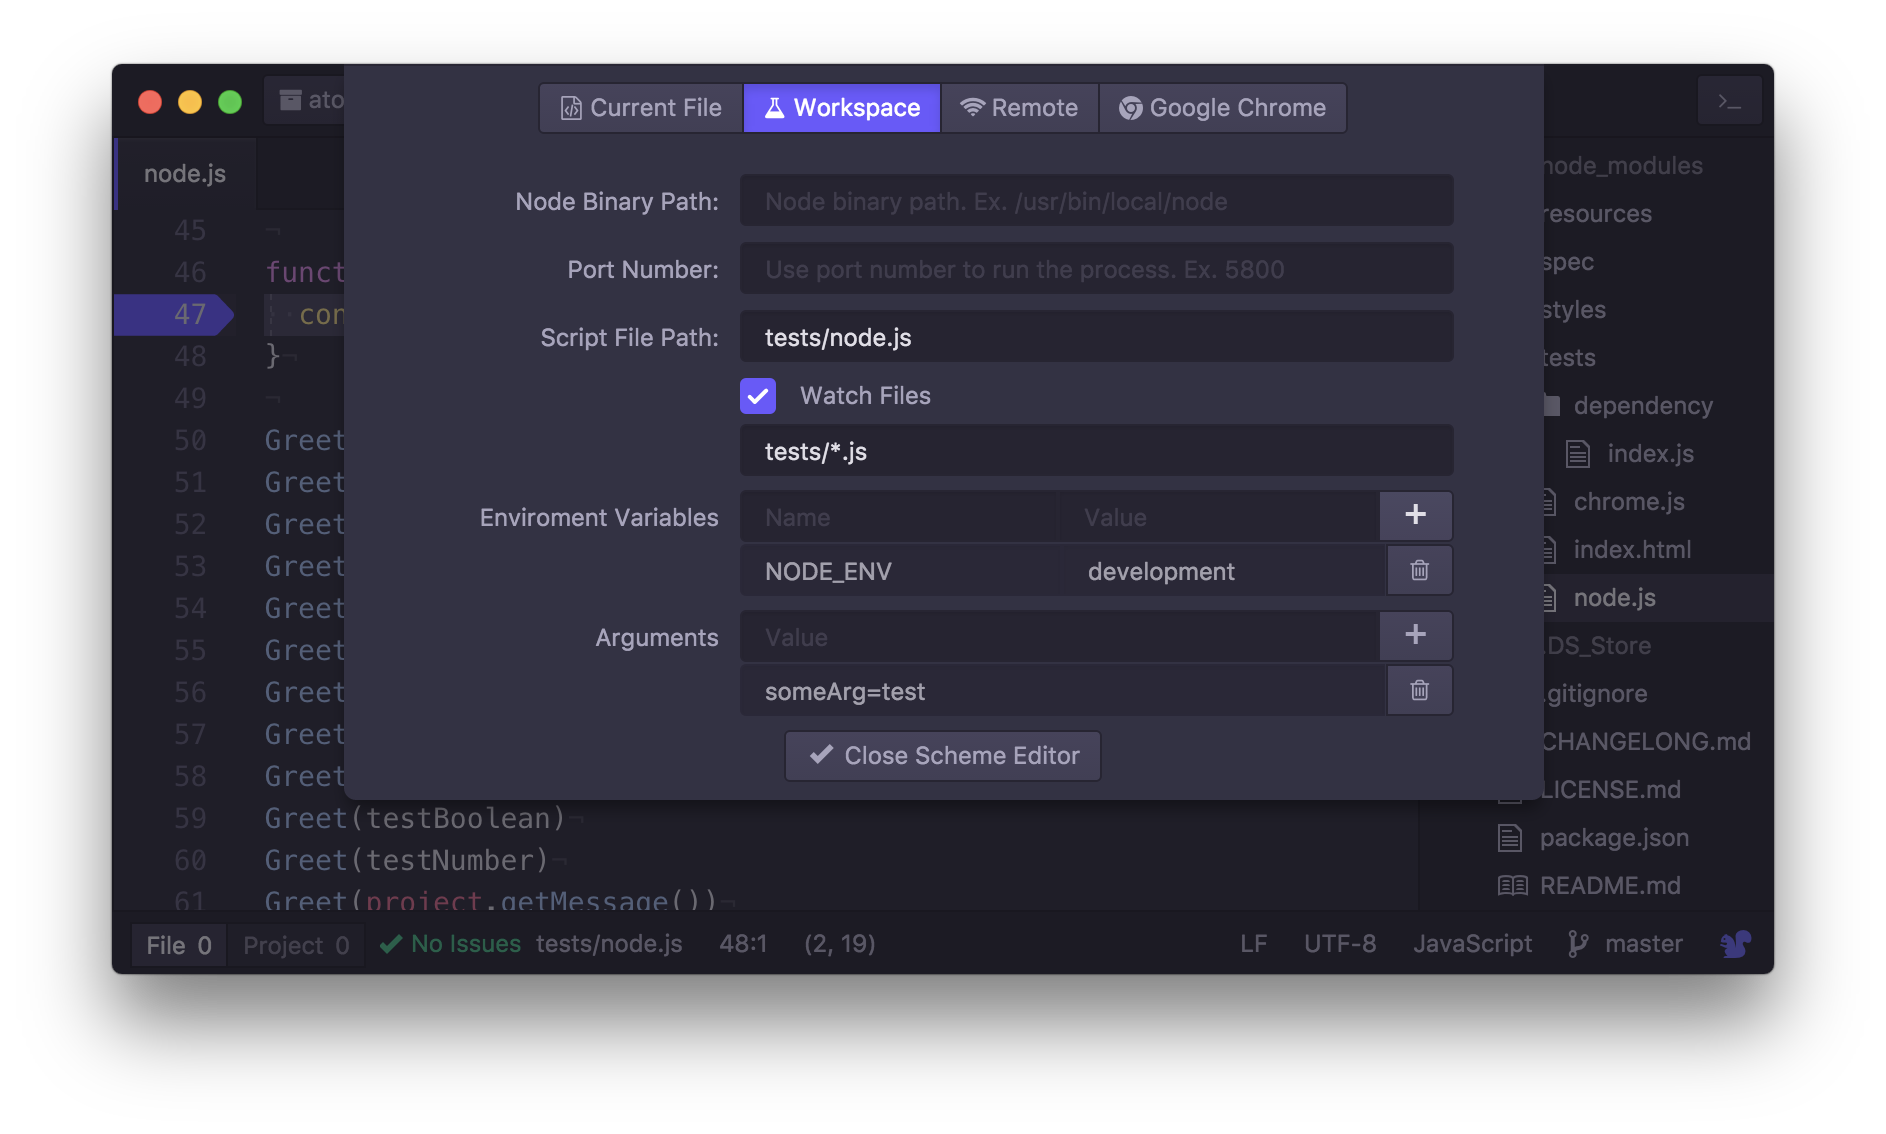
repl

  • Schemes configurator by project. using the scheme editor you can specify wherever you want to run from a remote or specific target script.

scheme

  • And much more :)

Schemes

The scheme editor is current limited to specify port, address, script and binary target. I will add args and env variables configuration in the next version.

Feedback

This package is under development please use the following link: Atom Bugs Issues to report issues, ask questions or improvements.

atom-bugs's People

Contributors

lordgiotto avatar willyelm avatar

Stargazers

 avatar  avatar  avatar  avatar  avatar  avatar  avatar  avatar  avatar  avatar  avatar  avatar  avatar  avatar  avatar  avatar  avatar  avatar  avatar  avatar  avatar  avatar  avatar  avatar  avatar  avatar  avatar  avatar  avatar  avatar  avatar  avatar  avatar  avatar

Watchers

 avatar  avatar  avatar  avatar  avatar

Forkers

atom sshyran

atom-bugs's Issues

Multiple consoles appear when enable toggle

I installed got the first toolbar strip. Once I disabled and enabled there was another and when clicking the button rapidly it added a couple more. Seeing as there is no way to remove the extra consoles this package will have to be removed.

Deprecated selector in `atom-bugs/styles/bugs.less`

In atom-bugs/styles/bugs.less:

Starting from Atom v1.13.0, the contents of atom-text-editor elements are no longer encapsulated within a shadow DOM boundary. This means you should stop using :host and ::shadow pseudo-selectors, and prepend all your syntax selectors with syntax--. To prevent breakage with existing style sheets, Atom will automatically upgrade the following selectors:

  • atom-text-editor .bugs-line-breakpoint, atom-text-editor::shadow .bugs-line-breakpoint => atom-text-editor .bugs-line-breakpoint, atom-text-editor.editor .bugs-line-breakpoint

  • atom-text-editor .bugs-line-breakpoint.cursor-line, atom-text-editor::shadow .bugs-line-breakpoint.cursor-line => atom-text-editor .bugs-line-breakpoint.cursor-line, atom-text-editor.editor .bugs-line-breakpoint.cursor-line

  • atom-text-editor .bugs-line-breakpoint:after, atom-text-editor::shadow .bugs-line-breakpoint:after => atom-text-editor .bugs-line-breakpoint:after, atom-text-editor.editor .bugs-line-breakpoint:after

Automatic translation of selectors will be removed in a few release cycles to minimize startup time. Please, make sure to upgrade the above selectors as soon as possible.

Small UX improvements

Hi,

Thanks a LOT for your debugging plugin, it's great!

I've got some little ideas on small UX improvements that could greatly help, maybe you'll find them useful too.

Highlighting current line
When entering in debug, the current line is selected but not highlighted, using atom selected line color would more clearly mark where the code is stopped

Turning this:
without highlighted

Into this:
highlighted

Displaying object properties
When focusing on a variable, it is displayed as is it was independent of its object. Focusing on the name of this.value.name will display name as is it was an independent variable. One has to focus on the entire variable, so this.value.name, to grab its value.

Plus, it would be great if a mouseover does the same (as in chrome).

Instead of this:
unlinked variable

Display this:
linked propertie

Configuring the debugger position
Having the choice to position the debugged at the top or bottom of atom would be great! (Chrome has made a classic way of debugging at the bottom).

Plus, it can be cool to hide the debugger, sometimes (having to disable it to hide it seems, hum, extreme ;-).

atom-text-editor.Object.defineProperty.get is deprecated.

The contents of atom-text-editor elements are no longer encapsulated
within a shadow DOM boundary. Please, stop using shadowRoot and access
the editor contents directly instead.

atom-text-editor.Object.defineProperty.get (/Applications/Atom.app/Contents/Resources/app.asar/src/text-editor-element.js:68:18)
atom.workspace.observeTextEditors (/Users/danielneves/.atom/packages/atom-bugs/lib/bugs-view.js:182:29)
<unknown> (/Applications/Atom.app/Contents/Resources/app.asar/src/workspace.js:334:16)
Function.module.exports.Emitter.simpleDispatch (/Applications/Atom.app/Contents/Resources/app.asar/node_modules/event-kit/lib/emitter.js:25:14)
Emitter.emit (/Applications/Atom.app/Contents/Resources/app.asar/node_modules/event-kit/lib/emitter.js:129:28)
<unknown> (/Applications/Atom.app/Contents/Resources/app.asar/src/workspace.js:265:34)

Error if config.cson is open

I was trying to find out how to pass command line arguments to the app (found it by clicking "Current File"), but in the process I had opened the config.cson file. The following error was thrown:

/Users/myname/.atom/config.cson:1
(function (exports, require, module, __filename, __dirname) { "*":
                                                                 ^
SyntaxError: Unexpected token :
    at exports.runInThisContext (vm.js:53:16)
    at Module._compile (module.js:373:25)
    at Object.Module._extensions..js (module.js:416:10)
    at Module.load (module.js:343:32)
    at Function.Module._load (module.js:300:12)
    at Module.runMain [as _onTimeout] (module.js:441:10)
    at Timer.listOnTimeout (timers.js:92:15)

Once I closed the config.cson file, everything worked as expected.

access to console for cli based app

My app has a cli. I can see the output of the console but how to I access the active console to enter some commands and thus continue the execution

Getting Started

This looks fantastic. Congrats. Any chance you could include a first-time setup guide? I'm new to node-debugging, running my script via the terminal as usual but the breakpoints don't get hit.

Selected wrong text if tabs are used for indentation in place of spaces

Hi willyelm,
using your package I noticed that, if I use tabs for indentation, the selected text is not correctly fetched from the buffer. This erroneous behaviour prevents the user to use selections to inspect expressions.

Here some screenshots of this issue: in the first one spaces are used for indentation, so the inspected expression is right as aspected; the second screen shows how tabs breaks the correct inspection of the selected text.
spaces
tabs

I'm going to make a pull request to fix this issue ๐Ÿ˜„

Remote Debugging not working

Hey there,
I have an Electron app running, with --remote-debug-port enabled. I can access the debug port via chrome: 127.0.0.1:5858. Sadly however, I can't connect to it using atom-bugs. The green playbutton simply does nothing (With Scheme Remote set to the same parameters as chrome). Also the console inside Atom doesn't say anything.

I'm using [email protected],Atom 1.11.2 and Node 4.2.2

Great project though, would love to see this become big :)

Error: listen EADDRINUSE :::5858

After triggering nightmarejs

Error: listen EADDRINUSE :::5858
    at Object.exports._errnoException (util.js:896:11)
    at exports._exceptionWithHostPort (util.js:919:20)
    at Agent.Server._listen2 (net.js:1246:14)
    at listen (net.js:1282:10)
    at Agent.Server.listen (net.js:1378:5)
    at Object.start (_debug_agent.js:21:9)
    at startup (node.js:85:44)
    at node.js:444:3

Recommend Projects

  • React photo React

    A declarative, efficient, and flexible JavaScript library for building user interfaces.

  • Vue.js photo Vue.js

    ๐Ÿ–– Vue.js is a progressive, incrementally-adoptable JavaScript framework for building UI on the web.

  • Typescript photo Typescript

    TypeScript is a superset of JavaScript that compiles to clean JavaScript output.

  • TensorFlow photo TensorFlow

    An Open Source Machine Learning Framework for Everyone

  • Django photo Django

    The Web framework for perfectionists with deadlines.

  • D3 photo D3

    Bring data to life with SVG, Canvas and HTML. ๐Ÿ“Š๐Ÿ“ˆ๐ŸŽ‰

Recommend Topics

  • javascript

    JavaScript (JS) is a lightweight interpreted programming language with first-class functions.

  • web

    Some thing interesting about web. New door for the world.

  • server

    A server is a program made to process requests and deliver data to clients.

  • Machine learning

    Machine learning is a way of modeling and interpreting data that allows a piece of software to respond intelligently.

  • Game

    Some thing interesting about game, make everyone happy.

Recommend Org

  • Facebook photo Facebook

    We are working to build community through open source technology. NB: members must have two-factor auth.

  • Microsoft photo Microsoft

    Open source projects and samples from Microsoft.

  • Google photo Google

    Google โค๏ธ Open Source for everyone.

  • D3 photo D3

    Data-Driven Documents codes.