Code Monkey home page Code Monkey logo

plotly.swift's Introduction

Plotly.swift

Build Badge Release Badge Contributions Badge License Badge Lifecycle Badge Swift Badge

Interactive chart library for Swift built on top of Plotly.

Plotly.swift brings professional graphs to the nascent Swift numerical computing ecosystem. Charts can be viewed in Jupyter notebooks or as standalone HTML files. Codebase has no external dependencies and can be easily used to visualize data in the middle of a complicated debugging session.

Example

The following code creates a combined line and bar plot and displays the figure.
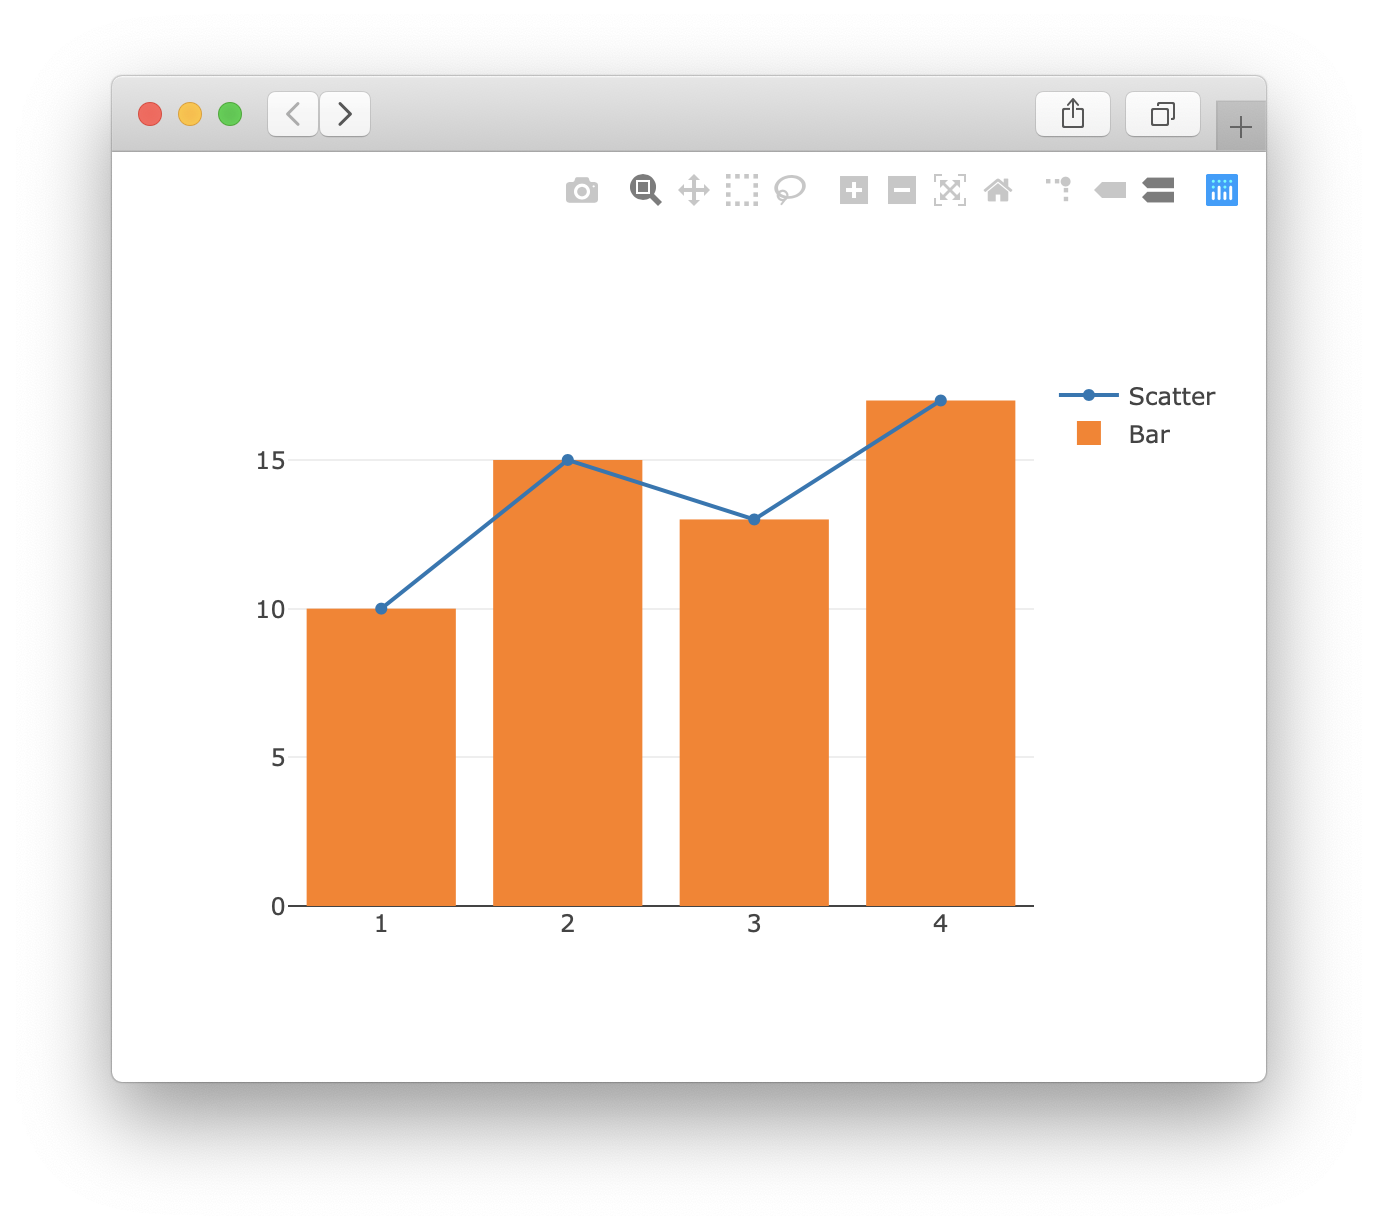
Example

 
import Plotly
 
 
let x = 1...4
let y = [10, 15, 13, 17]
 
let scatter = Scatter(name: "Scatter", x: x, y: y)
let bar = Bar(name: "Bar", x: x, y: y)
 
let figure = Figure(data: [scatter, bar])
try figure.show()  // figure.display() in Jupyter notebook


You can find examples of more than 30 built-in chart types in the Examples/ directory or in the Showcase.ipynb notebook. The fastest way to get started with your own chart is a Google Colab notebook with a Swift kernel. Colab Badge

Installation

Project uses Swift Package Manager for distribution, building, running and testing. PRs implementing support for other packaging or distribution methods are welcome.

Jupyter Notebook

To create a figure and display it in your notebook running a Jupyter Swift kernel, copy and paste the following starter code to the first cell. Then use Figure.display() method to interactively embed any graph into the notebook.

%install '.package(url: "https://github.com/vojtamolda/Plotly.swift.git", .exact("0.5.0"))' Plotly
%include "EnableIPythonDisplay.swift"

Project Dependency

To bundle the library and create charts in your own project, add the following dependency to your Package.swift manifest. Calling Figure.show() then displays the figure in a browser window.

dependencies: [
    .package(url: "https://github.com/vojtamolda/Plotly.swift.git", .exact("0.5.0")),
]

Documentation

Full reference user documentation can be found here. Text is adapted from JavaScript and therefore may require some imaginative translation in order to be applicable. In particular, all originally mashedtogether identifiers are camelCased to match conventions and user expectations in Swift.

Public interface of the library follows the Swift API Design Guidelines. Primary design goal is to provide a beautiful API that can show an interactive chart of your data as quickly as possible without compromising more advanced use cases.

If you're interested in the inner workings of the library Code Generation and Internals readme files contain detailed description of how the sausage is really made.

Release

Library is in early beta stage and the releases before version 1.0.0 doesn't follow Semantic Versioning. Symbol and method names may and generally will change. Before the 1.0.0 release, the recommendation is to depend on .exact("0.x.y") version to make sure your code doesn't break due to backward incompatible changes in the API.

Licensed under the MIT license. See the text for more details.

plotly.swift's People

Contributors

vinbrule avatar vojtamolda avatar

Stargazers

 avatar  avatar  avatar  avatar  avatar  avatar  avatar  avatar  avatar  avatar  avatar  avatar  avatar  avatar  avatar  avatar  avatar  avatar  avatar  avatar  avatar  avatar  avatar  avatar  avatar  avatar  avatar  avatar  avatar  avatar  avatar  avatar  avatar  avatar  avatar  avatar  avatar  avatar  avatar  avatar  avatar  avatar  avatar  avatar  avatar  avatar  avatar  avatar  avatar  avatar  avatar  avatar  avatar  avatar  avatar  avatar  avatar  avatar  avatar  avatar  avatar  avatar  avatar  avatar  avatar  avatar  avatar  avatar  avatar  avatar  avatar  avatar  avatar  avatar  avatar  avatar  avatar  avatar  avatar  avatar  avatar  avatar  avatar

Watchers

 avatar  avatar  avatar  avatar  avatar  avatar  avatar  avatar  avatar  avatar

plotly.swift's Issues

Swift-ification of the API

This bug is a variety of not-related thing's that share the common goal of making the API more aligned with Swift API Guidelines.

Full descriptions are below and here's a checklist to keep track of progress:

  • Bound check and wrap Angle values
  • Create sections in the Layout.swift file
  • Domesticate alien enums with a .true, .false and .none cases
  • Make Layout.xAxis and yAxis assignable to each other (#8)

Construct Color from predefined CSS constants

Making a static member for each one of 140 HTML/CSS colors would prevent any potential for typos and allow nice code completion when one runs out imagination.

Color struct is currently implemented as an enum which makes it impossible to write an extension that would define a new one. Instead, it would be better to re-implement it as a struct with static members. This achieves the same level of user auto-completion convenience and much more extensible.

It would be also nice to add the full list with colored background to the documentation. XCode probably won't render it but Jazzy will and it makes the cross referencing much more enjoyable.

Here's a list a full list of supported HTML/CSS color names with their hex representations:
https://www.w3schools.com/colors/colors_names.asp

HTML Colors

Support for Jupyter causes unresolved symbols in projects using PythonKit

When Plotly.swift is used in a larger project, that also depends on PythonKit, build fails with unresolved symbols.

Currently, the support for Jupyter notebooks is implement in a slightly hack-ish way

#if canImport(PythonKit)

The #if guard is placed around a Figure extension that implements the .display() method. This works auto-magically without any user intervention in Google Colab/Jupyter Notebooks, because they rely on Python to communicate with the Jupyter kernel and make it available for import by default.

However, when Plotly.swift is used in a larger project, that also happens to use PythonKit, the package fails to build. Since PythonKit is available for import the #if guard evaluates to true. The SwitPM build, though, doesn't see any formally declared dependency on PythonKit in Package.swift manifest and therefore doesn't link against it. This causes the unresolved symbols linking error.

Color.transparent isn’t opaque

The Color.transparent static property isn't actually transparent. It's defined as Color.RGB(255, 255, 255, 1.0) but should be Color.RGB(255, 255, 255, 0.0) instead.

Simplify axis parameters

"The main problem with the current interface is that you can create plots that is perfectly valid in schema but not actually doing what you want. For example, the axis parameter is really tricky to use as it just doesn't work and there is no error message when you don't understand the inner workings of Plotly.swift and the plotly js library." - Issue #16 @ProfFan

Figure Factory

Thank you for this awesome library :) Although the schema-based system works really well, I think one of the main hassle in using Plotly.swift is its lack of matplotlib-style plot shorthands like .scatter(x, y), .quiver(x, y, u, v), et cetera. The main Plotly Python API provides figure_factory to automate some of these tasks, for example:

https://plotly.com/python-api-reference/generated/plotly.figure_factory.create_quiver.html

I think it would be awesome if we can have similar functionality so people can start right away using Plotly.swift without having to remember what the schema is for all the different types of figures. I think this could be put in a separate package like PlotlyTools, just like matplotlib.pyplot.

Migrate Jazzy documentation to DocC

Apple released a new DocC (Documentation Compiler) framework. It maybe worthwhile switching from Jazzy.

Here's a few key DocC features:

  • Directly supported in Xcode Help viewer
  • Integrated hints displayed in the code editor
  • Static site export

It looks like DocC requires rolling ones own server for hosting. However, there's some effort to support fully static hosting, i.e. GitHub pages, being discussed here.

Create a standalone chart viewer app

When a matplotlib chart is created in Python REPL, the .show() function displays the figure in nice, small window. The GUI of the app looks like this:

Matplotlib GUI

It would be nice to provide a similar user experience if one calls the .show() method of a Plotly figure in a Swift REPL. Current implementation shows a HTML document in a browser window. This gets us 80% of the features for a very little development cost but it's still worth looking at other options.

Replacing the browser with a stand-alone app with an embedded browser view give us more flexibility and the possibility to develop features custom tailored to plotting:

  • Natural export to different formats (i.e. PNG, PDF, HTML, JSON, ...) via File -> Save As... or a share button.

  • Plotly modebar that is normally part of the figure and looks like this:
    Modebar
    Can be moved to native toolbar similar to this:
    Toolbar

  • We could display a sidebar that shows the JSON representation of the Figure.

More relaxed licensing

Hi,

First thank you for this awesome library! We are stunned by the awesome graphics :)

The only problem we have is that this library is licensed as GPLv3, thus incompatible with our library, which is in Apache 2. Is it possible to license this in some more relaxed copyleft license like MPL?

Best regards,
Fan

Built-in Support for TabularData Framework

Apple recently published TabularData framework. Basically, it is a typed clone of Pandas from Python.

I'm a little disappointed that the framework isn't open sourced and available on Linux. I think it may hinder adoption, but hey that's life. There isn't much documentation or examples but there's a nice tech talk video that describes the API on a nice example.

It would be nice to add support for the DataFrame and Column types directly into the library. Best way to support the framework is add conformance to the Plotable protocol to a few types. This would allow out of the box dataset exploration and manipulation in Xcode Playgrounds.

Here's an example conformance extension and the generated figure:

import TabularData
import Plotly


let dataFrame: TabularData.DataFrame = [
    "id": [1, 2, 3],
    "name": ["alice", "bob", "charlie"]
]

let barPlot = Plotly.Bar(
    x: dataFrame[column: 1].assumingType(String.self),
    y: dataFrame[column: 0].assumingType(Int.self)
)

let figure = Plotly.Figure(data: [barPlot])
try figure.show()


extension TabularData.Column: Plotly.Plotable where WrappedElement: Encodable {
    public func encode(toPlotly encoder: Encoder) throws {
        var container = encoder.unkeyedContainer()
        for element in self {
            try container.encode(element)
        }
    }
}

Screen Shot 2021-12-08 at 23 21 23

Nothing displaying in ScatterMapbox

Using ScatterMapbox, show() makes a window open in the webbrowser, but it doesn't contain anything, just white. I think that I need to include a Mapbox API key in order to get the map data, but I can't figure out how to do that. Is this supported? I have used the Python and Rust versions of Plotly before, and they both have an update_layout() method which allows for injecting the API key

Plotting of Stride and Range objects

Swift's Foundation library contains a few frequently used data types that are hidden in the plain sight. However, they are common enough to justify a direct plotting support. There's in total 4 flavors the Range and Stride objects:

  • Range: 0..<10
  • ClosedRange: 0...10
  • StrideTo: stride(from: 0, to: 1, by: 0.1)
  • StrideThrough: stride(from: 0, through: 1, by: 0.1)

Without conformance to the Plotable protocol, using these types requires explicitly constructing an array which results in an awkward syntax:

let scatter = Scatter(x: [Int](0...10), [Int](y: 0..<11))

Conformance to Plotable allows these types to be used as any other data:

let scatter = Scatter(x: 0...10, y: 0..<11)

The implementation will iterate through elements of the object and encode them to Plotly's JSON representation.

At the moment, I don't see a simple way to support the "sparse" encoding of sequential data that can be done with x0, dx, y0 and dy attributes. This would save a lot of file size, especially for larger graphs or animations but these attributes are supported only for some charts.

Layout axis system layout.xAxis/yAxis properties are missing from JSON if figure contains more than one trace

The following code snippet:

Figure(
    data: [
        Scatter(x: [1, 2], y: [3, 4]),
        Scatter(x: [1, 2], y: [4, 5])
    ],
    layout: Layout(
        xAxis: [ Layout.XAxis(title: "X Label") ],
        yAxis: [ Layout.YAxis(title: "Y Label") ]
   )
)

Produces incorrect JSON representation. The xaxis1 and yaxis1 attributes of the layout are empty. The titles on the axes therefore don't show up when the figure is rendered.

Here's the invalid JSON that gets produced in v0.4.0:

{
    "data": [
        {"trace": "scatter", "x": [1, 2], "y": [3, 4] },
        {"trace": "scatter", "x": [1, 2], "y": [4, 5] }
    ],
    "layout": {
        "xaxis1": { },
        "yaxis1": { }
    }
}

The reason why it happens is that each trace gets its own instance of the Layout.XAxis(uid: 1) assigned to the xAxis property. The Figure constructors does a little "dance" and collects these properties from all traces and adds them to the layout.

This way the layout ends up with multiple XAxis objects that don't have unique uid. When the entire figure gets encoded to JSON, the encoder keeps overwriting the value for the xaxis1 key over and over the value that is acually visible is the one that happens to be stored the last.

Consolidate variety of ArrayOr... types into a single generic

There's a large variety of ArrayOr... types. They implement Plotly schema primitives that allow assignemnt of either a single value or an array of values. This is very simple in JavaScript due to lack of strong typing but requires a specialized data type in Swift.

Here's a list of the types that currently exist:

  • ArrayOrInt
  • ArrayOrDouble
  • ArrayOrString
  • ArrayOrAnything
  • ArrayOrColor

These types duplicate a lot of boilerplate code between each other. It's worthwhile investigating a possibility of replacing them with a single generic ArrayOr<Type> type. Ideally, this type would be as transparent as possible to users and should allow initialization from all meaningful literals via conformance the ExpressibleBy...Literal protocols from the standard library.

Potential pitfall is that a particular type can only conform to a protocol once. Even in cases with different conditional conformance. This would mean that only one of the specialized Type cases would be expressible for example by an Int literal even tough both ArrayOrInt and ArrayOrDouble could meaningfully benefit from it.

Develop PlotlyView - A generally reusable UIView for displaying Figures

To make the library easier to use on Apple devices (i.e. iOS/iPadOS/macOS) it would be nice to develop a generally reusable UIView. Such UI component can then be used as a "LEGO block" that displays a chart within a larger app.

PlotlyView should be a subclass of WKWebView and expose it's model as a settable property of type Plotly.Figure. Simply setting the figure object should be everything one needs to display a chart.

Here's an example use:

import Plotly

let trace = Scatter(
    x: [1, 2, 3],
    y: [3, 4, 5]
)

var view = PlotlyView()
view.figure = Figure(data: [trace])

Developing PlotlyView helps a great deal with building the standalone viewer app per #7. For more details about the motivation and general background check out the discussion in #11.

Improve ColorScale with additional maps

Implementation of the ColorScale enum currently lacks some of the options that are available in Python's plotly.express module. It would be nice to include these in the Swift version too.

Also since ColorScale is implemented as an enum it's not possible to write an extension that would define a new case. It would be better to transform it into a struct similar to OptionSet with static members. This achieves the same level of user convenience and is more flexible. This would also allow a new convinient constructor that would take an array of Colors and translate it into a map with equal distances between the colors.

For completeness here is the source code that holds the numeric values of the color-scales defined in the Python version:

https://github.com/plotly/plotly.py/blob/master/packages/python/plotly/_plotly_utils/colors/__init__.py
https://github.com/plotly/plotly.py/blob/master/packages/python/plotly/_plotly_utils/colors/sequential.py

Another point worth considering is the support for categorical ColorScales. There's a nice discussion here.

Allow individual subplot axis customization

Currently, the Layout struct doesn't allow customization of subplot axes. When one creates a Figure with multiple traces that are displayed as sub-plots, there's no way to set properties of the second and all the following axes of any type.

Here's the full list of axis types that exist in the Layout object and can't be customized and shared between subplots:

  • XAxis
  • YAxis
  • Scene subplot axes:
    • XAxis
    • YAxis
    • ZAxis
  • Polar subplot axes:
    • RadialAxis
    • AngularAxis
  • Ternary subplot axes:
    • AAxis
    • BAxis
    • CAxis
  • Geo subplot axes:
    • LatitudeAxis
    • LongitudeAxis
  • ColorAxis

Create simple, human friendly initializers

Automatically code-(de)generated initializers of all traces currently accept a ridiculously large number of arguments. On average it's about 50. To make it even worse Swift requires that the arguments follow the same order as the definition. This is very inconvenient and leads to below-average user experience in comparison to other Swift libraries.

In this specific case, behavior similar Python's keyword arguments would be preferable but it would require a change to Swift that's way above my competence level. Automatic completion built into XCode that usually saves the day isn't all too helpful because the parameter list is truncated and doesn't fit the screen.

One way to reduce this friction surface is a simplified init(...) method that accepts only a handful of the most frequent parameters. The idea is similar to what convenience init(...) provides for classes.

For example, the Scatter trace could be created via a constructor that is understandable without a deep dive into the (at the moment non-existent) documentation:

init(name: String? = nil, x: XData? = nil, y: YData? = nil,
     marker: Marker? = nil, line: Line? = nil, mode: Mode? = nil)

Especially to first time users, this looks much less intimidating than the full list of 46 parameters:

init(visible: Shared.Visible? = nil, showLegend: Bool? = nil, legendGroup: String? = nil,
     opacity: Double? = nil, name: String? = nil, uid: String? = nil, ids: [String]? = nil,
     customData: [String]? = nil, meta: ArrayOrAnything? = nil, selectedPoints: Anything? = nil,
     hoverInfo: Shared.HoverInfo? = nil, hoverLabel: Shared.HoverLabel? = nil,
     stream: Shared.Stream? = nil, transforms: [Shared.Transform]? = nil,
     uiRevision: Anything? = nil, x: XData? = nil, x0: Anything? = nil, dx: Double? = nil,
     y: YData? = nil, y0: Anything? = nil, dy: Double? = nil, stackGroup: String? = nil,
     orientation: Shared.Orientation? = nil, groupNormalization: GroupNormalization? = nil,
     stackGaps: StackGaps? = nil, text: ArrayOrString? = nil, textTemplate: ArrayOrString? = nil,
     hoverText: ArrayOrString? = nil, mode: Shared.Mode? = nil, hoverOn: Shared.HoverOn? = nil,
     hoverTemplate: ArrayOrString? = nil, line: SplineSmoothedDashedLine? = nil,
     connectGaps: Bool? = nil, clipOnAxis: Bool? = nil, fill: Shared.Fill? = nil,
     fillColor: Color? = nil, marker: Shared.GradientMarker? = nil, selected: Selected? = nil,
     unselected: Unselected? = nil, textPosition: Shared.TextPosition? = nil,
     textFont: Shared.Font? = nil, xError: Shared.Error? = nil, yError: Shared.Error? = nil,
     xCalendar: Shared.Calendar? = nil, yCalendar: Shared.Calendar? = nil,
     xAxis: SubPlotID? = nil, yAxis: SubPlotID? = nil)

My gut feel is that the reduced initializer covers about 70% of use cases. More complicated charts that require tweaking of other properties can be created by crating var and modifying the rest of the properties on the following lines in arbitrary ordering:

var scatterPlot = Scatter(name: "Simpler Initializer", x: [1, 2], y: [3, 4])
scatterPlot.hoverText = ["Three", "Four"]

Implement animations

Plotly.js has a really nice support for animated figures. Here's a few example figures:

Implementing animations in Swift can be broken down into the following steps:

  • Generate code for Frame structure. Currently, it's only decoded from the JSON schema but not used afterwards.
  • Improve InfoArray so it's able to handle rich types passed as JavaScript args parameter in the examples.
  • Write tests that produce the same figures as the JavaScript examples above.

Does this SDK support these graphs?

 I need to implement all these graphs in my Application.

Column Chart
Line Chart
Combined Chart
Bubble Map, 
Point Map, 
Choropleth Map

is this SDK supports all the graphs which i've mentioned ?

Thanks in Advance..!

Document parameters of all initializers

Currently, the init(...) call of every trace accepts a ridiculously large number of parameters (see #1 for details). It would be nice if the documentation visible in XCode after the option click option-click and eventually in Jazzy displayed the full list of the parameters. Each with a simple, single sentence description.

The purpose is two fold - first to give a brief explanation of functionality and second to provide a way to quickly lookup the order of parameters. Unfortunately, Swift in contrast to Python keyword arguments, requires that all calls of a function have parameter order identical to the definition.

Not following the order frequently leads to a strange and misleading compiler errors and a general sub-par user experience. The code-(de)generated initializers tend to have around 50 of these order-sensitive arguments. Sorting them is even not fun when one has to scroll up-and-down the source code of the constructed trace.

Desired result should follow the XCode markdown format and look something like this:

/// A simplified Scatter trace initializer.
///
/// - Parameters:
///   - name: Name of the trace that shows up in the legend.
///   - x: Plotable vector of `x` values.
///   - y: Plotable vector of `y` values.
///   - marker: Single marker style or an array of individual styles for each data point.
///   - line: Style of the trace line.
///   - mode: Arbitrary combination of `.line`, `.marker`, or `.text`.
///
init(name: String? = nil, x: XData? = nil, y: YData? = nil,
     marker: Marker? = nil, line: Line? = nil, mode: Mode? = nil)

Recommend Projects

  • React photo React

    A declarative, efficient, and flexible JavaScript library for building user interfaces.

  • Vue.js photo Vue.js

    🖖 Vue.js is a progressive, incrementally-adoptable JavaScript framework for building UI on the web.

  • Typescript photo Typescript

    TypeScript is a superset of JavaScript that compiles to clean JavaScript output.

  • TensorFlow photo TensorFlow

    An Open Source Machine Learning Framework for Everyone

  • Django photo Django

    The Web framework for perfectionists with deadlines.

  • D3 photo D3

    Bring data to life with SVG, Canvas and HTML. 📊📈🎉

Recommend Topics

  • javascript

    JavaScript (JS) is a lightweight interpreted programming language with first-class functions.

  • web

    Some thing interesting about web. New door for the world.

  • server

    A server is a program made to process requests and deliver data to clients.

  • Machine learning

    Machine learning is a way of modeling and interpreting data that allows a piece of software to respond intelligently.

  • Game

    Some thing interesting about game, make everyone happy.

Recommend Org

  • Facebook photo Facebook

    We are working to build community through open source technology. NB: members must have two-factor auth.

  • Microsoft photo Microsoft

    Open source projects and samples from Microsoft.

  • Google photo Google

    Google ❤️ Open Source for everyone.

  • D3 photo D3

    Data-Driven Documents codes.