Code Monkey home page Code Monkey logo

portfolio_analysis's Introduction

Portfolio Analysis

FYI: Yahoo! Finance started to block web parsing from its website. However, parsing is still possible via UK version, so in some cases it is possible to parse by typing "uk." before yahoo in link, for example, https://uk.finance.yahoo.com/quote/AAPL/key-statistics


Repository Mission

One of the main issues of being investor is how to track your securities.

Some investors use apps from their brokers, others prefer third party sites.

The truth is all of them are terrible. They do not give sufficient info about portfolio, but just weights and basic graph. The ones that bring some insights to your portoflio either cost a lot or technically complicated and visually disgusting.

I think the reason is people who develop these kinds of systems are the ones who do not use them in a regular manner and the ones who actually use them experience lack of time or programming abilities to track their portfolio and positions on their own.

However, I personally think that there should not be the trade off between convenience and capabilities. The process of portfolio analysis should be straightforward where investors are provided with the necessary information for making decisions.

Having worked in trading and systems analytics, I came to idea to create if not an app but script to facilitate portfolio tracking. Current R and Python packages are not sufficient enough to obtain info and analysis, but they are powerful enough to build the right package for investing purposes.

Week by week, this repository will be filled with more advanced script.


Today my R script enables to get the following info about portfolio:

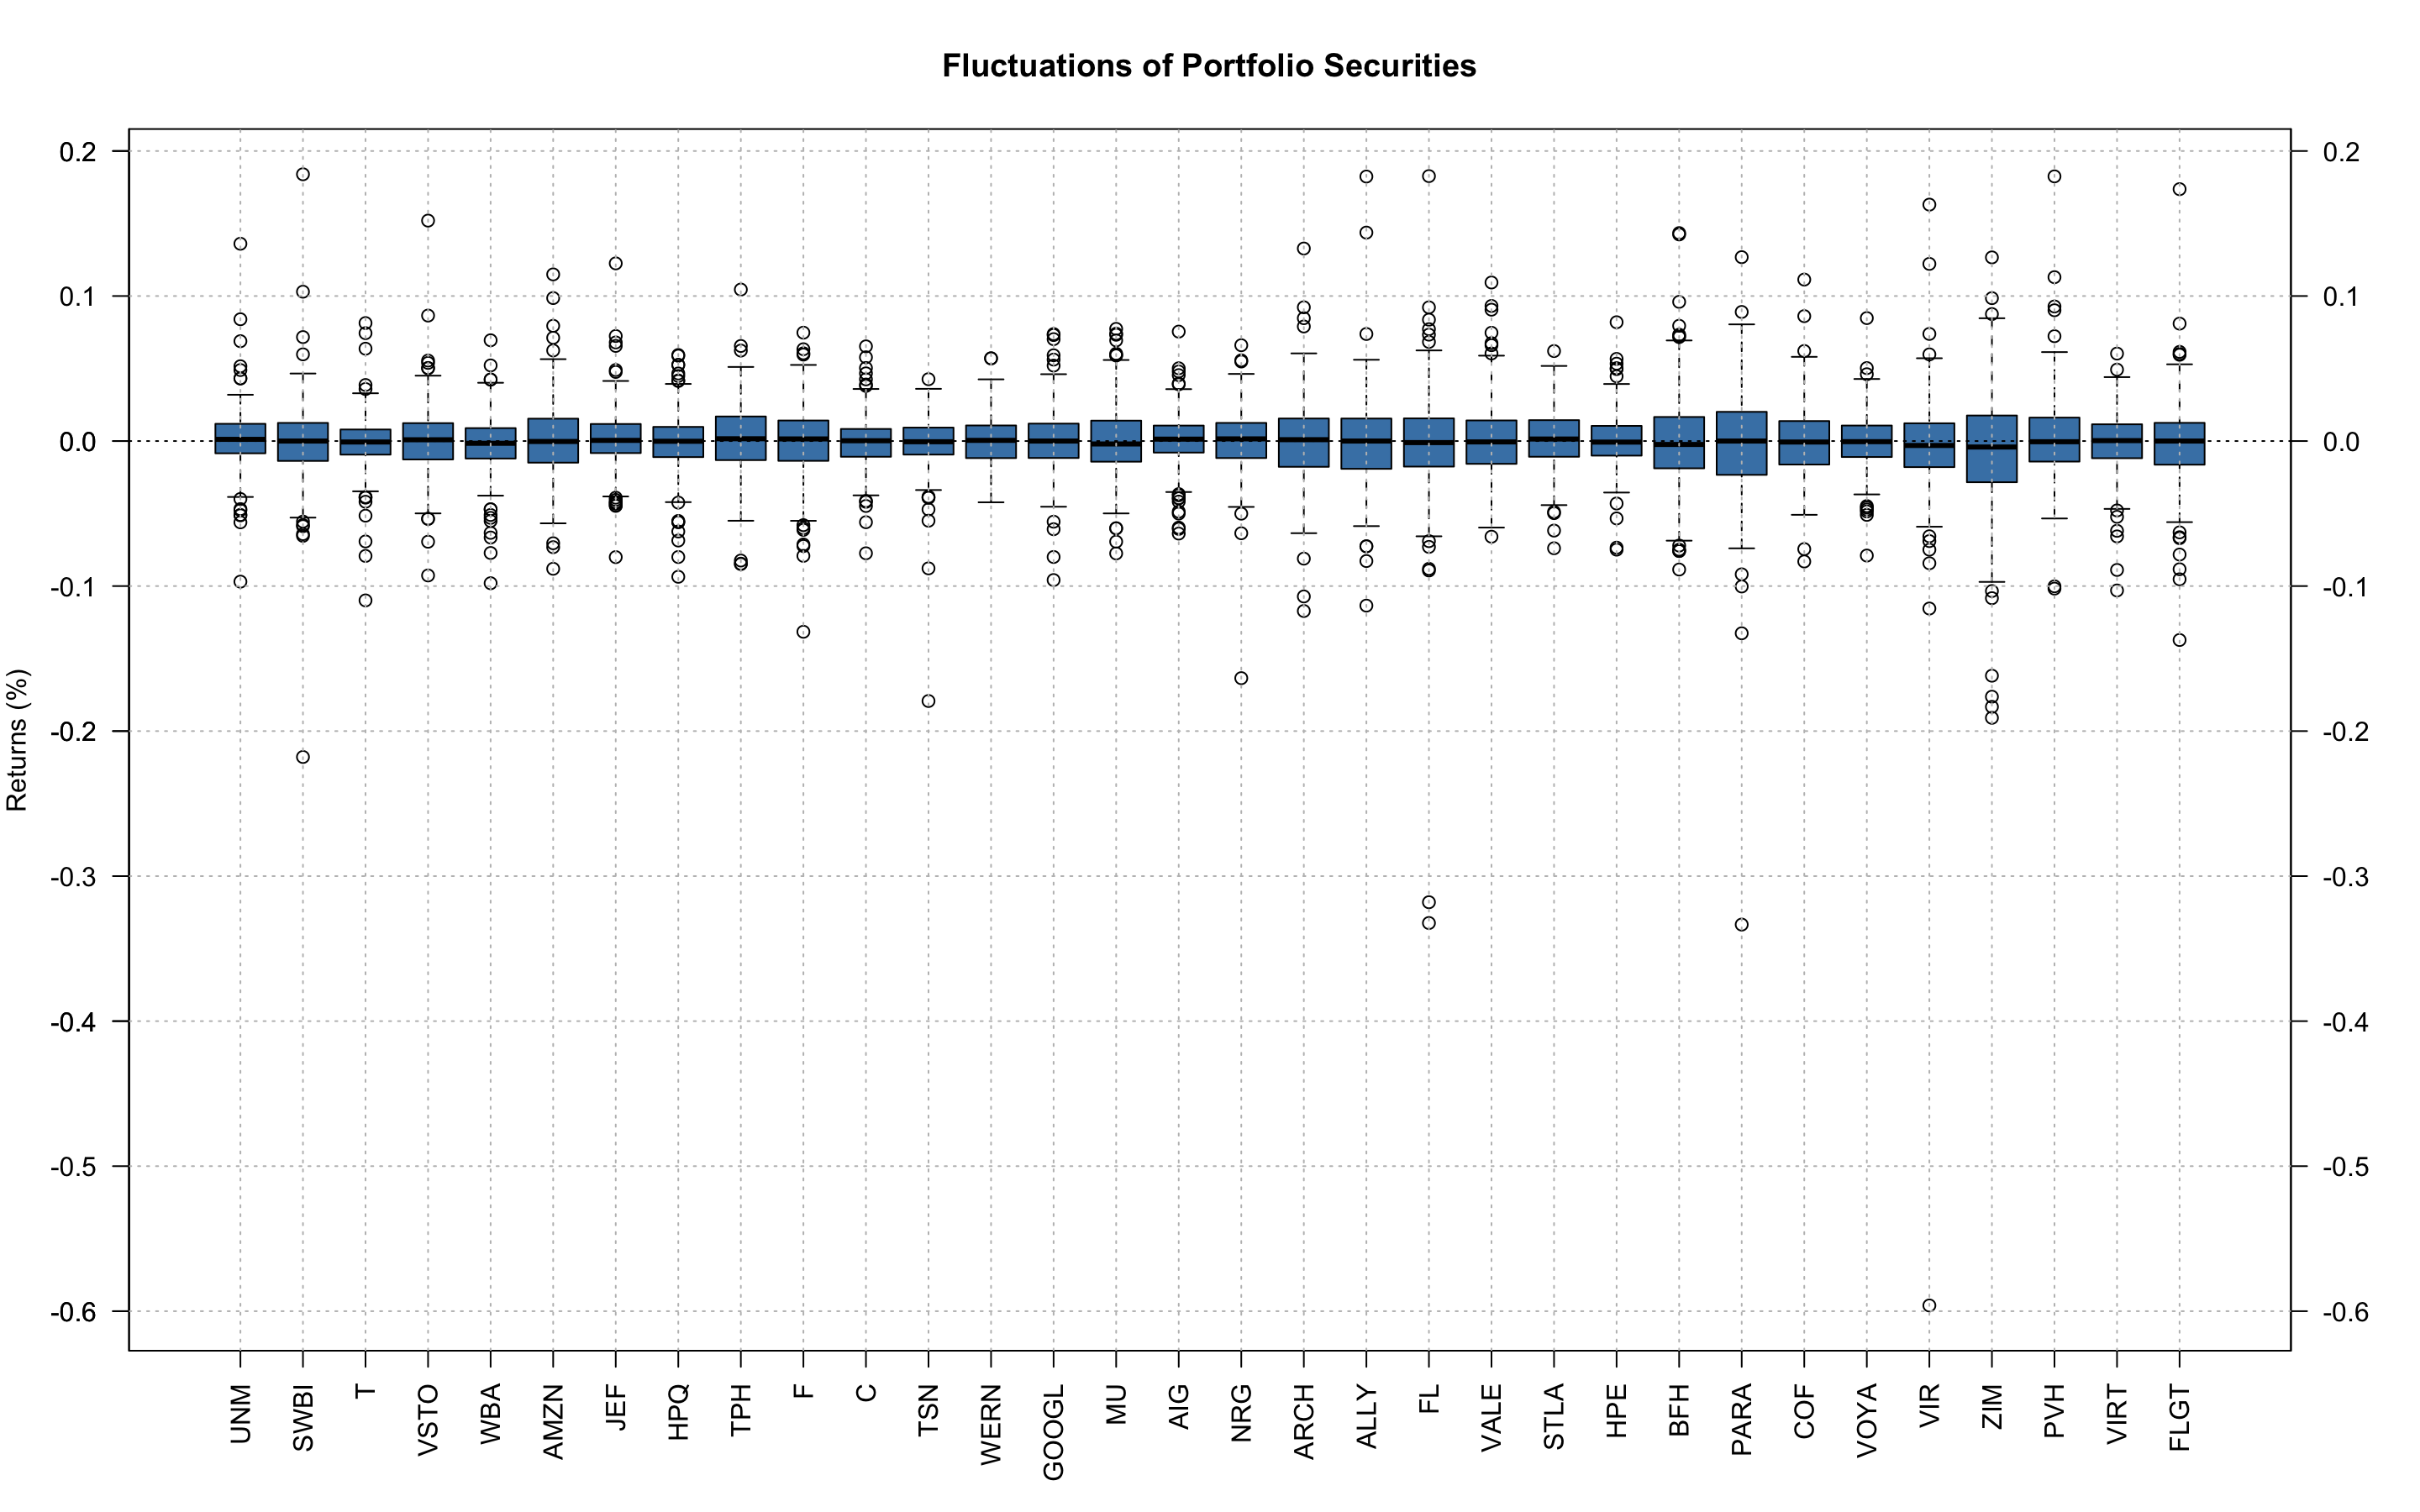
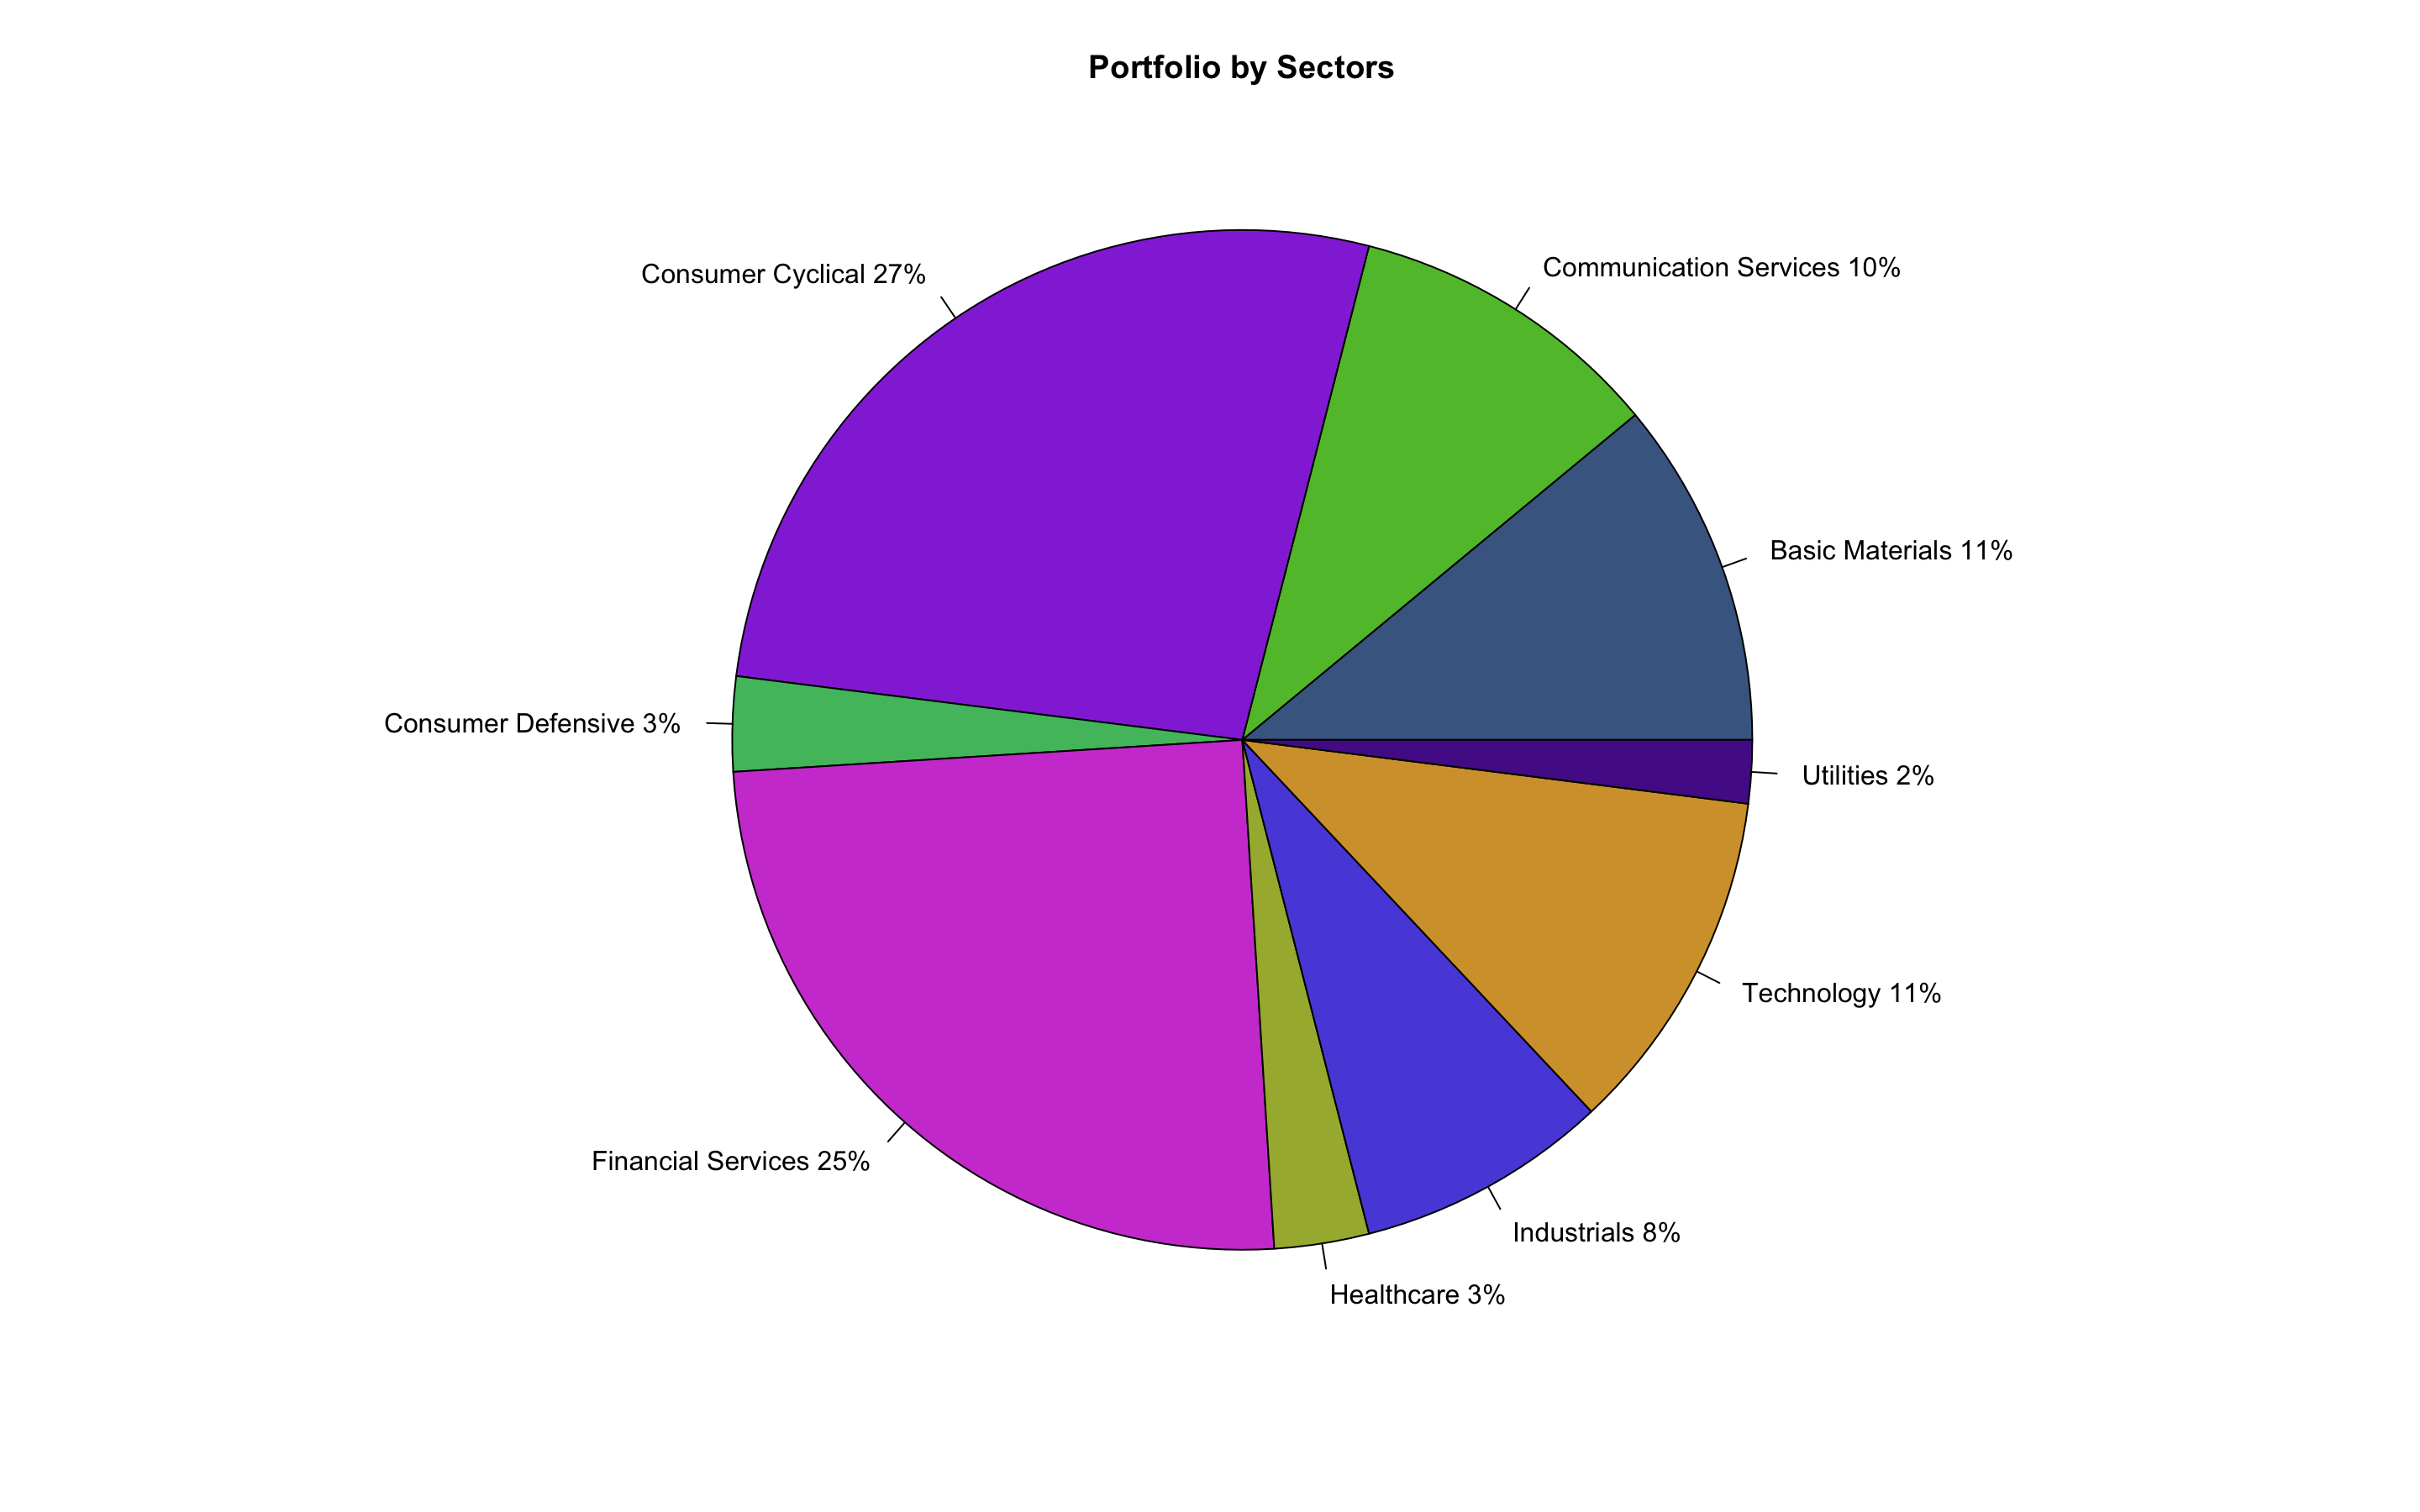
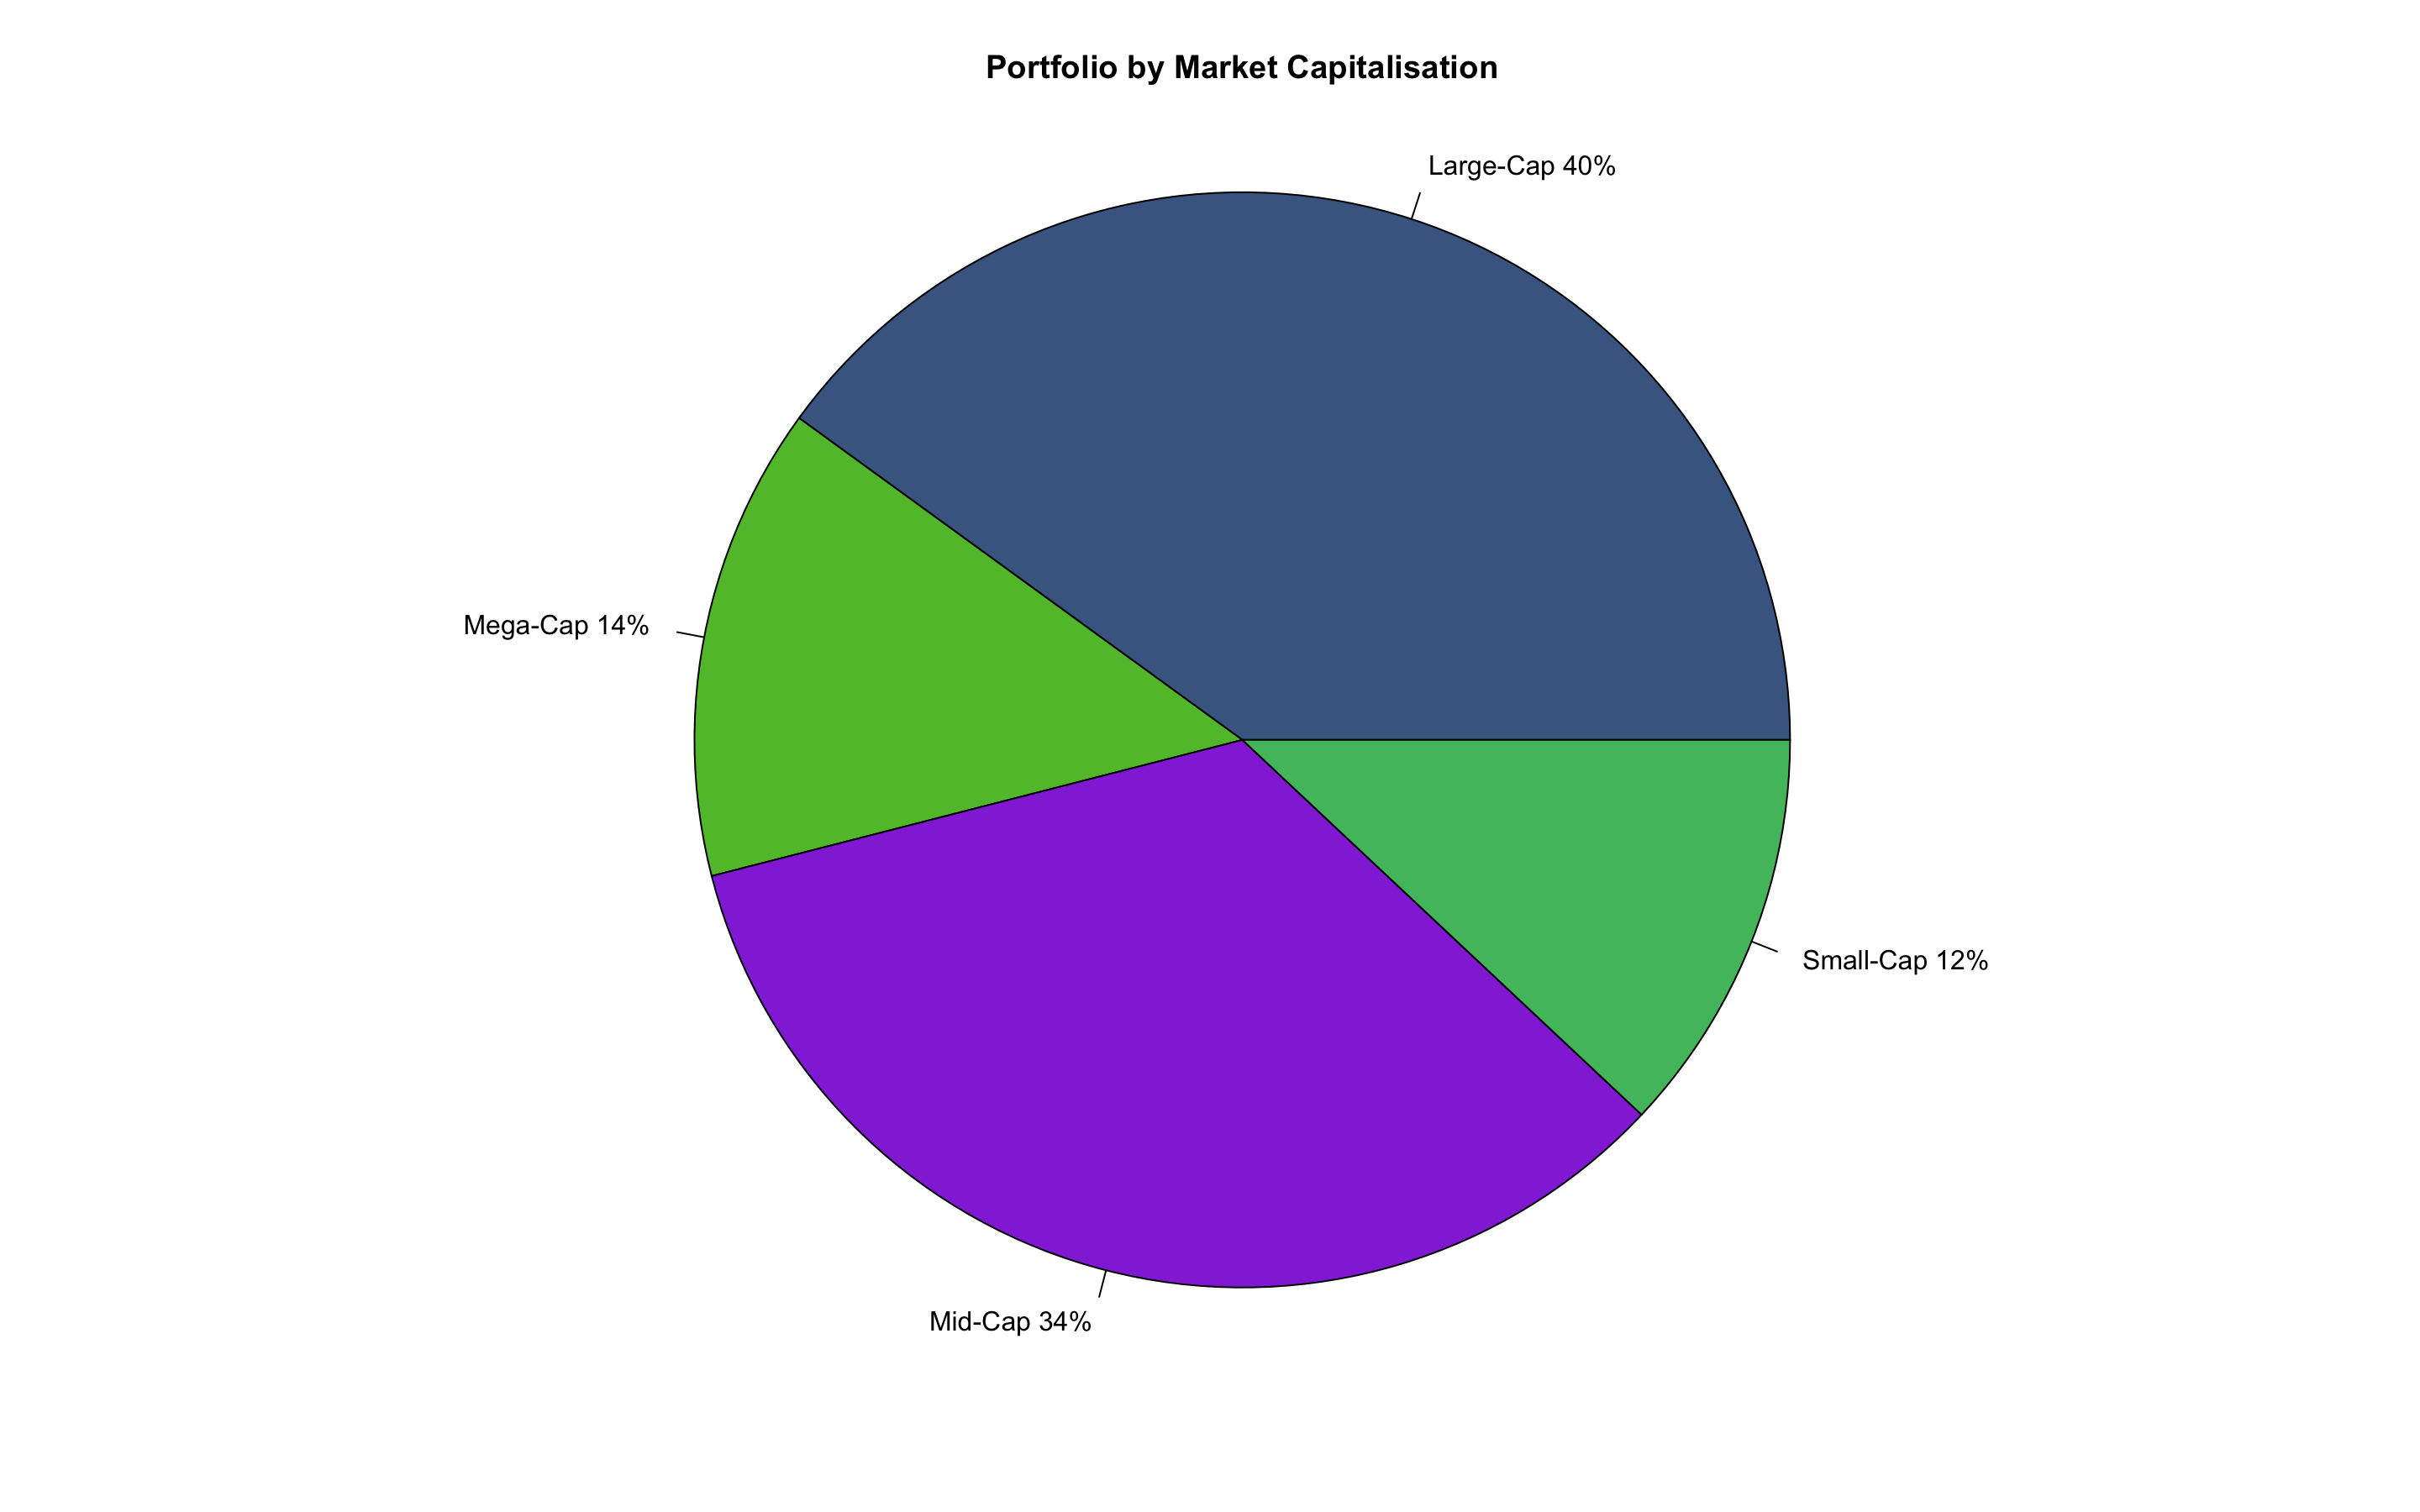
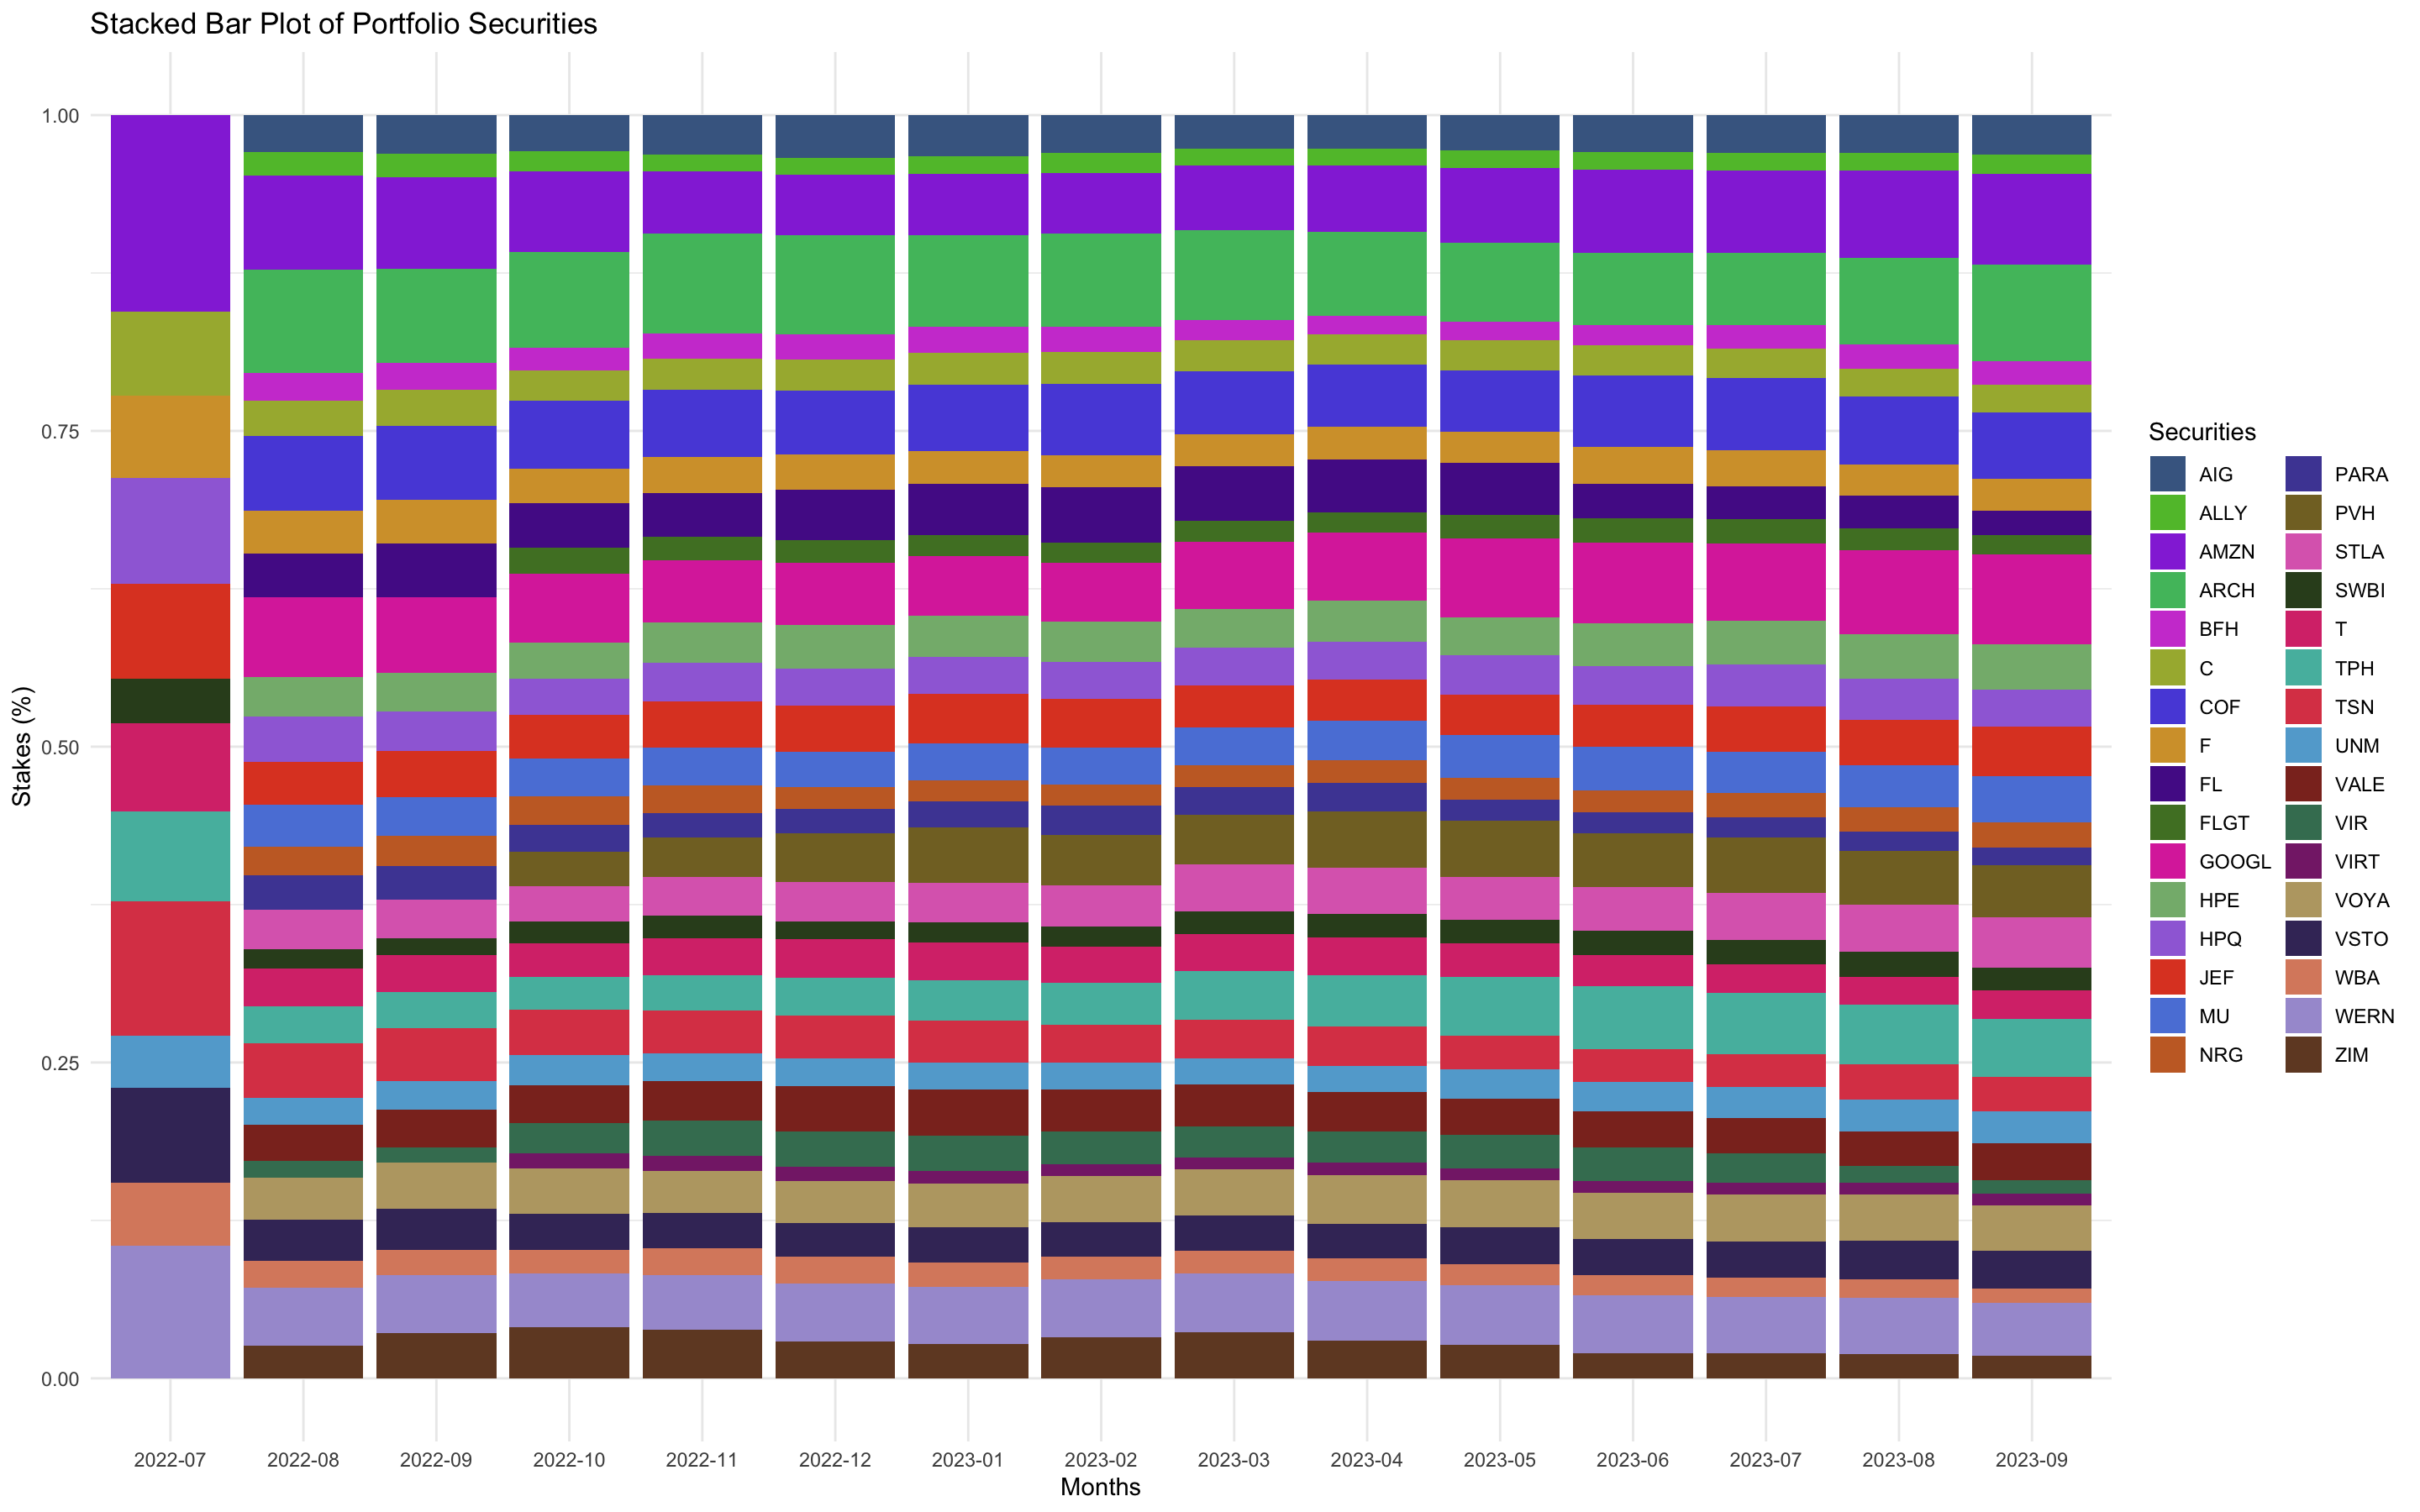
• Weights according to assets, their industries and sectors using pie plot; Barplot script enables to see securities dynamics and check Mean and Median of weights

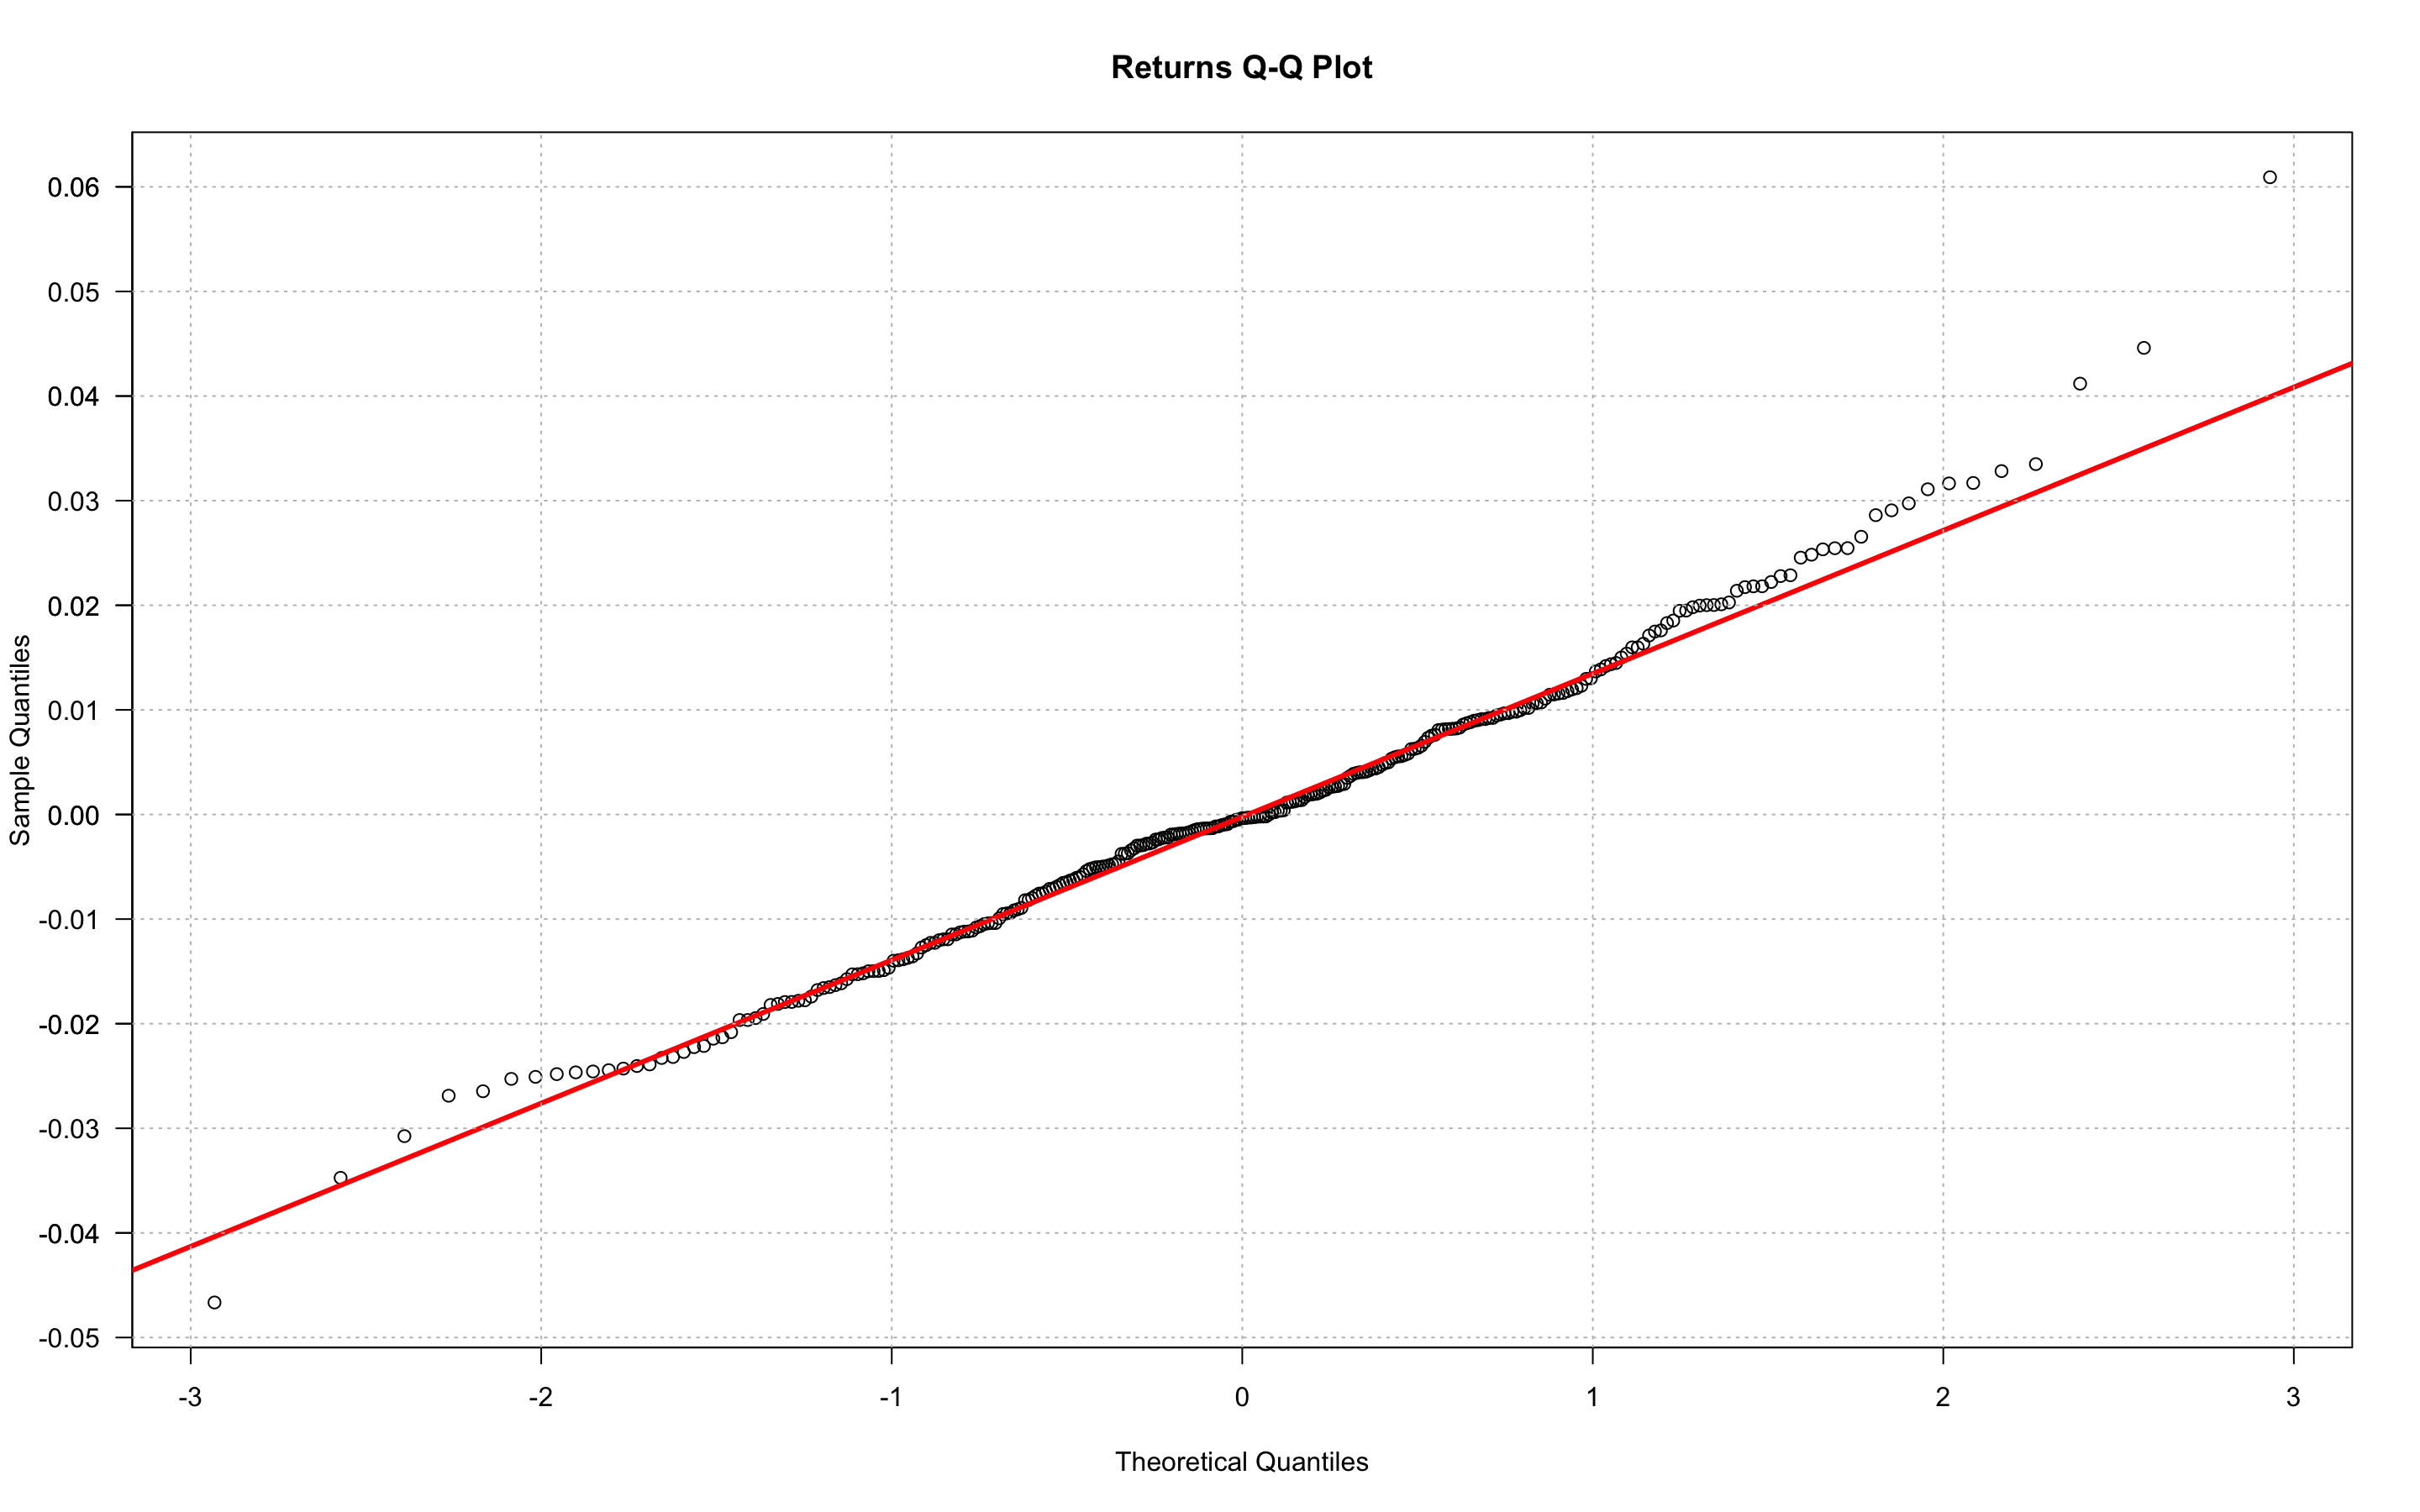
• Comparative plots to assess portfolio dynamics with becncmarks and securities between each other (Scatter Plot, Heatmap, Treemap, Boxplot)

• Non Visualisation Capabilities include calculation of Alpha & Beta of Portfolio, its value across multiple currencies, MVaR and Portfolio Risk.

My first goal is to write powerful scripts that enable to check most necessary info for investor.

Currently under development: stock fundamentals, more advanced plots, making script suitable for using via Git


Requirements:

• quantmod

• timeSeries

• ggplot2

• ggrepel

• rvest


Current Data Analytics Script Capabilities:

Stock Fundamentals

Altman Z Scores for Portfolio Securities


Current Data Visualisation Script Capabilities:


Pie Plot

Asset Weights

Asset Weigths of Dividends

Industry Weights

Industry Weigths of Dividends

Sector Weights

Sector Weigths of Dividends

Weights by Market Capitalisation

Market Cap Weigths of Dividends

Weights by Countries

Countries Weigths of Dividends


Line Plot

Portfolio Performance Tracking

Plot Portfolio with Benchmarks / Indices to visually compare performances

Portfolio Dividends Accumulation Tracking

Portfolio Volatility Tracking

Portfolio Volatility in Absolute Values

Drawdown Plot of Portfolio Cumulative Fluctuations

Drawdown Plot of Portfolio Returns Fluctuations

Future Portfolio Performance by Monte Carlo Simulation


Bar Plot

Portfolio Returns

Portfolio Securities Overall Returns

Asset Weigths

Dividend Weigths

Median Correlations of securities

Portfolio Securities by Debt to EBITDA


Stacked Bar Plot

Portfolio Securities Dynamcis

Securities Portions Dynamcis

Dividends Dynamics

Dividend Portions Dynamics

Sector Portions Dynamics

Dividend Dynamics by Sector

Dividend Portions Dynamics by Sector

Market Cap Portions Dynamics

Dividend Dynamics by Market Cap

Dividend Portions Dynamics by Market Cap

Country Portions Dynamics

Dividend Dynamics by Country

Dividend Portions Dynamics by Country


Portfolio's Correlation Heatmap


Scatter Plot

Comparison of Portfolio & Indices Performances

Risk & Return (Standard Deviation)

Risk & Return (Beta)


Bubble Plot

Using Standard Deviation

Using Beta

3D Version using both Standard Deviation and Beta


Treemap for Portfolio Securities

Asset Weights

Asset & Sector Weights


Portfolio Returns QQ Plot


Portfolio Histograms

Histogram of Returns

Histogram of Correlation Values


Boxplot for Portfolio Securities

portfolio_analysis's People

Contributors

vladislavpyatnitskiy avatar

Stargazers

 avatar

Watchers

 avatar

portfolio_analysis's Issues

Recommend Projects

  • React photo React

    A declarative, efficient, and flexible JavaScript library for building user interfaces.

  • Vue.js photo Vue.js

    🖖 Vue.js is a progressive, incrementally-adoptable JavaScript framework for building UI on the web.

  • Typescript photo Typescript

    TypeScript is a superset of JavaScript that compiles to clean JavaScript output.

  • TensorFlow photo TensorFlow

    An Open Source Machine Learning Framework for Everyone

  • Django photo Django

    The Web framework for perfectionists with deadlines.

  • D3 photo D3

    Bring data to life with SVG, Canvas and HTML. 📊📈🎉

Recommend Topics

  • javascript

    JavaScript (JS) is a lightweight interpreted programming language with first-class functions.

  • web

    Some thing interesting about web. New door for the world.

  • server

    A server is a program made to process requests and deliver data to clients.

  • Machine learning

    Machine learning is a way of modeling and interpreting data that allows a piece of software to respond intelligently.

  • Game

    Some thing interesting about game, make everyone happy.

Recommend Org

  • Facebook photo Facebook

    We are working to build community through open source technology. NB: members must have two-factor auth.

  • Microsoft photo Microsoft

    Open source projects and samples from Microsoft.

  • Google photo Google

    Google ❤️ Open Source for everyone.

  • D3 photo D3

    Data-Driven Documents codes.