Code Monkey home page Code Monkey logo

vincentarelbundock / marginaleffects Goto Github PK

View Code? Open in Web Editor NEW
375.0 10.0 42.0 189.1 MB

R package to compute and plot predictions, slopes, marginal means, and comparisons (contrasts, risk ratios, odds, etc.) for over 100 classes of statistical and ML models. Conduct linear and non-linear hypothesis tests, or equivalence tests. Calculate uncertainty estimates using the delta method, bootstrapping, or simulation-based inference

Home Page: https://marginaleffects.com

License: Other

R 95.18% Stata 0.75% Shell 1.93% Makefile 0.25% C++ 0.19% SCSS 0.06% TeX 0.65% CSS 0.05% Lua 0.94%

marginaleffects's Introduction


The parameters of a statistical model can sometimes be difficult to interpret substantively, especially when that model includes non-linear components, interactions, or transformations. Analysts who fit such complex models often seek to transform raw parameter estimates into quantities that are easier for domain experts and stakeholders to understand, such as predictions, contrasts, risk differences, ratios, odds, lift, slopes, and so on.

Unfortunately, computing these quantities—along with associated standard errors—can be a tedious and error-prone task. This problem is compounded by the fact that modeling packages in R and Python produce objects with varied structures, which hold different information. This means that end-users often have to write customized code to interpret the estimates obtained by fitting Linear, GLM, GAM, Bayesian, Mixed Effects, and other model types. This can lead to wasted effort, confusion, and mistakes, and it can hinder the implementation of best practices.

Book

This free online book introduces a conceptual framework to clearly define statistical quantities of interest, and shows how to estimate those quantities using the marginaleffects package for R and Python. The techniques introduced herein can enhance the interpretability of over 100 classes of statistical and machine learning models, including linear, GLM, GAM, mixed-effects, bayesian, categorical outcomes, XGBoost, and more. With a single unified interface, users can compute and plot many estimands, including:

  • Predictions (aka fitted values or adjusted predictions)
  • Comparisons such as contrasts, risk differences, risk ratios, odds, etc.
  • Slopes (aka marginal effects or partial derivatives)
  • Marginal means
  • Linear and non-linear hypothesis tests
  • Equivalence tests
  • Uncertainty estimates using the delta method, bootstrapping, simulation, or conformal inference.
  • Much more!

The Marginal Effects Zoo book includes over 30 chapters of tutorials, case studies, and technical notes. It covers a wide range of topics, including how the marginaleffects package can facilitate the analysis of:

  • Experiments
  • Observational data
  • Causal inference with G-Computation
  • Machine learning models
  • Bayesian modeling
  • Multilevel regression with post-stratification (MRP)
  • Missing data
  • Matching
  • Inverse probability weighting
  • Conformal prediction

Get started by clicking here!

Article

Our article on marginaleffects is provisionally accepted for publication by the Journal of Statistical Software. You can read the preprint here.

To cite marginaleffects in publications please use:

Arel-Bundock V, Greifer N, Heiss A (Forthcoming). “How to Intepret Statistical Models Using marginaleffects in R and Python.” Journal of Statistical Software.

A BibTeX entry for LaTeX users is:

@Article{,
    title = {How to Intepret Statistical Models Using {marginaleffects} in {R} and {Python}},
    author = {Vincent Arel-Bundock and Noah Greifer and Andrew Heiss},
    year = {Forthcoming},
    journal = {Journal of Statistical Software},
}

Software

The marginaleffects package for R and Python offers a single point of entry to easily interpret the results of over 100 classes of models, using a simple and consistent user interface. Its benefits include:

  • Powerful: It can compute and plot predictions; comparisons (contrasts, risk ratios, etc.); slopes; and conduct hypothesis and equivalence tests for over 100 different classes of models in R.
  • Simple: All functions share a simple and unified interface.
  • Documented: Each function is thoroughly documented with abundant examples. The Marginal Effects Zoo website includes 20,000+ words of vignettes and case studies.
  • Efficient: Some operations can be up to 1000 times faster and use 30 times less memory than with the margins package.
  • Valid: When possible, numerical results are checked against alternative software like Stata or other R packages.
  • Thin: The R package requires relatively few dependencies.
  • Standards-compliant: marginaleffects follows “tidy” principles and returns simple data frames that work with all standard R functions. The outputs are easy to program with and feed to other packages like ggplot2 or modelsummary.
  • Extensible: Adding support for new models is very easy, often requiring less than 10 lines of new code. Please submit feature requests on Github.
  • Active development: Bugs are fixed promptly.

marginaleffects's People

Contributors

aaronzipp avatar ajnafa avatar andrewheiss avatar arthur-albuquerque avatar bgall avatar dnzmarcio avatar etiennebacher avatar huftis avatar jolyphil avatar kylebutts avatar lamadr avatar maellecoursonnais avatar marcomavina avatar mattwarkentin avatar ngreifer avatar nicholasjclark avatar resulumit avatar rohanalexander avatar sam-crawley avatar simonpcouch avatar snhansen avatar strengejacke avatar vincentarelbundock avatar

Stargazers

 avatar  avatar  avatar  avatar  avatar  avatar  avatar  avatar  avatar  avatar  avatar  avatar  avatar  avatar  avatar  avatar  avatar  avatar  avatar  avatar  avatar  avatar  avatar  avatar  avatar  avatar  avatar  avatar  avatar  avatar  avatar  avatar  avatar  avatar  avatar  avatar  avatar  avatar  avatar  avatar  avatar  avatar  avatar  avatar  avatar  avatar  avatar  avatar  avatar  avatar  avatar  avatar  avatar  avatar  avatar  avatar  avatar  avatar  avatar  avatar  avatar  avatar  avatar  avatar  avatar  avatar  avatar  avatar  avatar  avatar  avatar  avatar  avatar  avatar  avatar  avatar  avatar  avatar  avatar  avatar  avatar  avatar  avatar  avatar  avatar  avatar  avatar  avatar  avatar  avatar  avatar  avatar  avatar  avatar  avatar  avatar  avatar  avatar  avatar  avatar

Watchers

 avatar  avatar  avatar  avatar  avatar  avatar  avatar  avatar  avatar  avatar

marginaleffects's Issues

modelchange

shortcut mchange which can also be read as "marginal change"

scale of the contrasts do not match scale of marginal effects

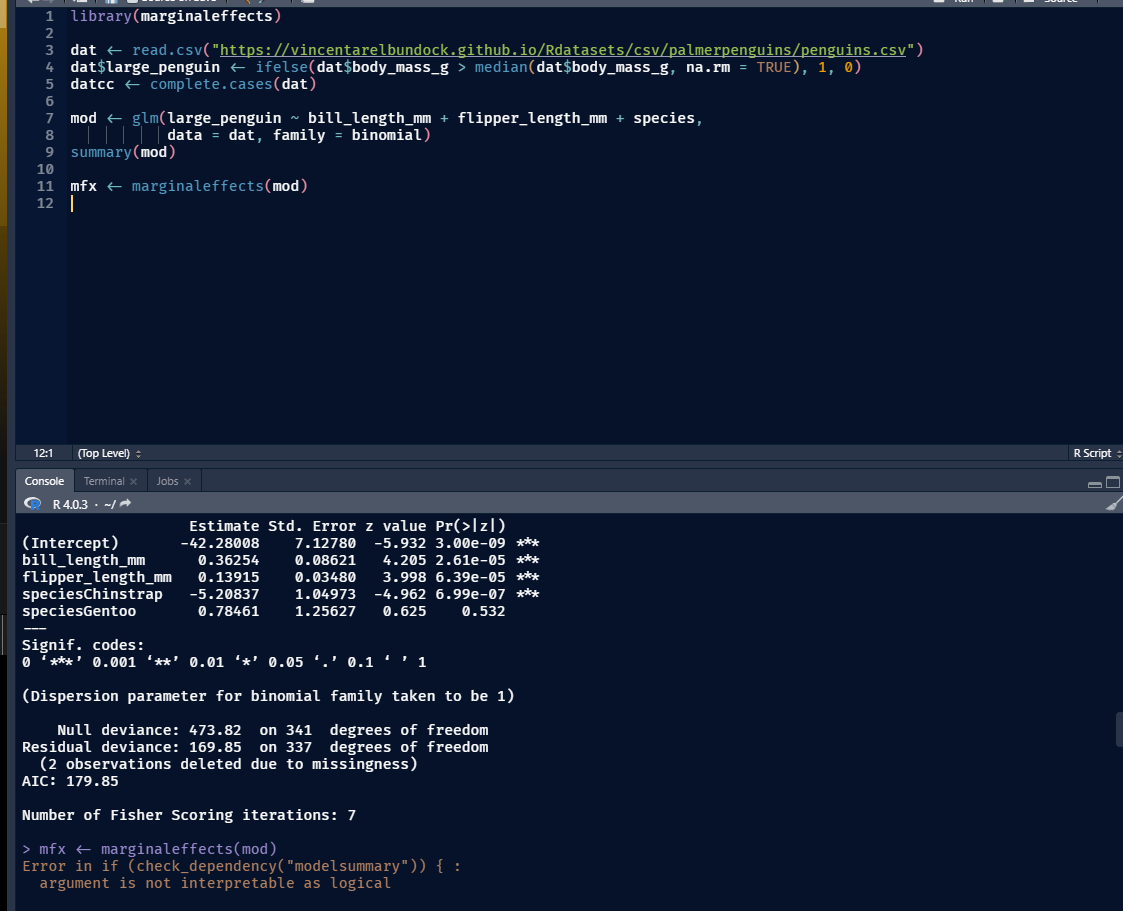
library(palmerpenguins)
penguins$large_penguin <- ifelse(penguins$body_mass_g > median(penguins$body_mass_g, na.rm = TRUE), 1, 0)

mod <- glm(large_penguin ~ flipper_length_mm + species, data = penguins, family = binomial)

mfx <- marginaleffects(mod)
summary(mfx)

Support new models

IF THE MODEL YOU WOULD LIKE TO SUPPORT IS NOT LISTED BELOW, PLEASE OPEN A NEW ISSUE.

It is often very easy to add support for new models. If you would like to help us do it (thanks!!!), please read this vignette on marginaleffects extensions: https://vincentarelbundock.github.io/marginaleffects/articles/extensions.html

marginaleffects only supports modeling packages released on CRAN. If you would like to add support for a non-CRAN package, your code can be hosted in the user-submitted (b
ut unsupported) code library in the vignette above.

If cannot contribute code to support a new model, and if that model is not listed below, please open a new issue with a working example using a small publicly available dataset.

Seems possible

Help wanted

  • lqmm: breaks with newdata #1072

Existing issues (with some notes)

predict problem

  • alpaca: #786
  • bayesX
  • censReg
  • coxphw: #467
  • coxrobust
  • cplm
  • gee
  • glmm
  • glmnl
  • ivprobit
  • MASS::ridgelm
  • mgcv::gamm: #187
  • mmrm: No predict() method #570
  • ordinal::clm2: no prediction for each level
  • ordinal::clmm: no predict method at all
  • pglm
  • plm::pgmm
  • Rchoice
  • robust::glmRob: breaks with newdata
  • timereg: #467

vcov problem

  • complmrob
  • bfsl no vcov method at all

Install problem

  • spaMM::HLfit:

Categorical / Multinomial DV

  • VGAM::vglm: not just multinomial
  • VGAM::vgam

Data input are not standard data frames

Not on CRAN

  • bigmlogit: checked on 2022-06-02
  • mixor: checked on 2022-03-10
  • mnlogit: checked on 2023-01-11
  • tobit1: checked on 2023-01-11
  • ZBZIMM: #541

Misc

  • Apollo for choice models. Seems extremely idiosyncratic, and does not appear to supply any of the standard methods such as vcov(), coef(), or predict(). Supporting this is likely to be a major challenge. Vincent is unlikely to do this himself without significant help (or more likely a quasi-complete PR) from a contributor. https://cran.r-project.org/web/packages/apollo/index.html
  • cmprsk::crr: Seems very different. Vincent will not implement this unless someone is willing to help.

Supported by other packages

get_vcov

variance argument becomes TRUE/FALSE

when TRUE, try get_vcov

sanity compare output of get_vcov to output of get_coef to make sure they share names

WIP: `pscl::hurdle`

---
output: html_document
---

```{r, echo = TRUE, message=FALSE}
library("pscl")
library("modelsummary")
library("marginaleffects")

data("bioChemists", package = "pscl")
mod <- hurdle(art ~ phd + fem | ment, data = bioChemists, dist = "negbin")

mfx <- marginaleffects(mod, prediction_type = c("zero", "count"))

modelsummary(mfx, group = type + term ~ model)
```

`margins` standard errors when `unit_ses=FALSE`

Builds a single MxK Jacobian using the estimated vector of Average Marginal Effects:

  • M: Number of marginal effect terms
  • K: Number of coefficients

Construction happens in R/jacobian.R, where F0 is a vector of marginal effects.

no `try` in `variance` argument

careful with loess since vcov breaks there. Maybe I can write a vcov.loess method. That also seems hackish. What if some other package defines one?

`get_diff.logical` and `get_diff.factor` get used in the loop over variables in `marginaleffects`

> library(margins)

> dat = data.frame(y = rnorm(100),
+                  x = sample(letters[1:4], 100, replace = TRUE))
> mod = lm(y ~ x, dat)

> margins(mod, unit_ses = FALSE) |> data.frame() |> head()
           y x      fitted se.fitted   dydx_xb   dydx_xc   dydx_xd Var_dydx_xb
1  0.5807462 c -0.06956020 0.2043144 0.2976883 0.1355107 0.1787751  0.08380496

margins(mod, unit_ses = TRUE) |> data.frame() |> head()

2  0.2323989 d -0.02629577 0.2177998 0.2976883 0.1355107 0.1787751  0.08380496
3  0.9810678 b  0.09261736 0.2284304 0.2976883 0.1355107 0.1787751  0.08380496
4 -0.1792914 a -0.20507090 0.1778328 0.2976883 0.1355107 0.1787751  0.08380496
5  2.2435594 a -0.20507090 0.1778328 0.2976883 0.1355107 0.1787751  0.08380496
6 -2.3042269 d -0.02629577 0.2177998 0.2976883 0.1355107 0.1787751  0.08380496
  Var_dydx_xc Var_dydx_xd X_weights X_at_number
1  0.07336887  0.07906128        NA           1
2  0.07336887  0.07906128        NA           1
3  0.07336887  0.07906128        NA           1
4  0.07336887  0.07906128        NA           1
5  0.07336887  0.07906128        NA           1
6  0.07336887  0.07906128        NA           1

> margins(mod, unit_ses = TRUE) |> data.frame() |> head()

Error in matrix(NA_real_, nrow = nrow(data), ncol = length(levs), dimnames = list(seq_len(nrow(data)),  :
  length of 'dimnames' [2] not equal to array extent

Recommend Projects

  • React photo React

    A declarative, efficient, and flexible JavaScript library for building user interfaces.

  • Vue.js photo Vue.js

    🖖 Vue.js is a progressive, incrementally-adoptable JavaScript framework for building UI on the web.

  • Typescript photo Typescript

    TypeScript is a superset of JavaScript that compiles to clean JavaScript output.

  • TensorFlow photo TensorFlow

    An Open Source Machine Learning Framework for Everyone

  • Django photo Django

    The Web framework for perfectionists with deadlines.

  • D3 photo D3

    Bring data to life with SVG, Canvas and HTML. 📊📈🎉

Recommend Topics

  • javascript

    JavaScript (JS) is a lightweight interpreted programming language with first-class functions.

  • web

    Some thing interesting about web. New door for the world.

  • server

    A server is a program made to process requests and deliver data to clients.

  • Machine learning

    Machine learning is a way of modeling and interpreting data that allows a piece of software to respond intelligently.

  • Game

    Some thing interesting about game, make everyone happy.

Recommend Org

  • Facebook photo Facebook

    We are working to build community through open source technology. NB: members must have two-factor auth.

  • Microsoft photo Microsoft

    Open source projects and samples from Microsoft.

  • Google photo Google

    Google ❤️ Open Source for everyone.

  • D3 photo D3

    Data-Driven Documents codes.