Code Monkey home page Code Monkey logo

force-graph's Introduction

force-graph

NPM package Build Size NPM Downloads

Force-directed graph rendered on HTML5 canvas.

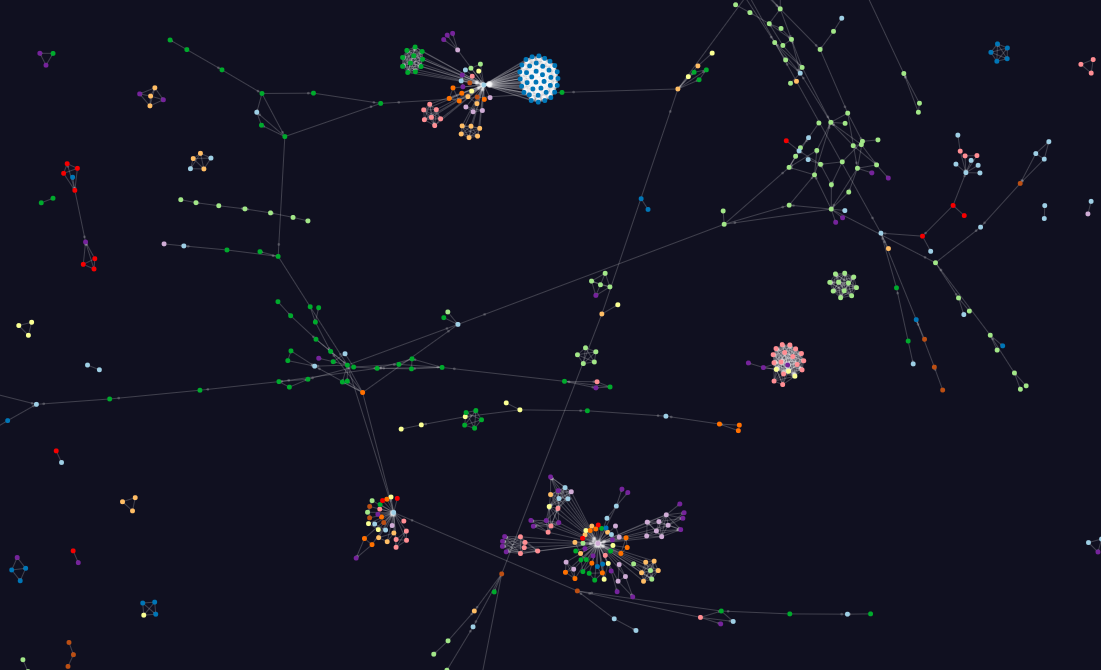
A web component to represent a graph data structure in a 2-dimensional canvas using a force-directed iterative layout. Uses HTML5 canvas for rendering and d3-force for the underlying physics engine. Supports canvas zooming/panning, node dragging and node/link hover/click interactions.

See also the 3D version.

And check out the React bindings.

Examples

Quick start

import ForceGraph from 'force-graph';

or using a script tag

<script src="//unpkg.com/force-graph"></script>

then

const myGraph = ForceGraph();
myGraph(<myDOMElement>)
  .graphData(<myData>);

API reference

Data input

Method Description Default
graphData([data]) Getter/setter for graph data structure (see below for syntax details). Can also be used to apply incremental updates. { nodes: [], links: [] }
nodeId([str]) Node object accessor attribute for unique node id (used in link objects source/target). id
linkSource([str]) Link object accessor attribute referring to id of source node. source
linkTarget([str]) Link object accessor attribute referring to id of target node. target

Container layout

Method Description Default
width([px]) Getter/setter for the canvas width. <window width>
height([px]) Getter/setter for the canvas height. <window height>
backgroundColor([str]) Getter/setter for the chart background color. <transparent>

Node styling

Method Description Default
nodeRelSize([num]) Getter/setter for the ratio of node circle area (square px) per value unit. 4
nodeVal([num, str or fn]) Node object accessor function, attribute or a numeric constant for the node numeric value (affects circle area). val
nodeLabel([str or fn]) Node object accessor function or attribute for name (shown in label). Supports plain text or HTML content. Note that this method uses innerHTML internally, so make sure to pre-sanitize any user-input content to prevent XSS vulnerabilities. name
nodeVisibility([boolean, str or fn]) Node object accessor function, attribute or a boolean constant for whether to display the node. true
nodeColor([str or fn]) Node object accessor function or attribute for node color (affects circle color). color
nodeAutoColorBy([str or fn]) Node object accessor function (fn(node)) or attribute (e.g. 'type') to automatically group colors by. Only affects nodes without a color attribute.
nodeCanvasObject([fn]) Callback function for painting a custom canvas object to represent graph nodes. Should use the provided canvas context attribute to perform drawing operations for each node. The callback function will be called for each node at every frame, and has the signature: .nodeCanvasObject(<node>, <canvas context>, <current global scale>). default node object is a circle, sized according to val and styled according to color.
nodeCanvasObjectMode([str or fn]) Node object accessor function or attribute for the custom drawing mode. Use in combination with nodeCanvasObject to specify how to customize nodes painting. Possible values are:
  • replace: the node is rendered using just nodeCanvasObject.
  • before: the node is rendered by invoking nodeCanvasObject and then proceeding with the default node painting.
  • after: nodeCanvasObject is applied after the default node painting takes place.
Any other value will be ignored and the default drawing will be applied.
() => 'replace'

Link styling

Method Description Default
linkLabel([str or fn]) Link object accessor function or attribute for name (shown in label). Supports plain text or HTML content. Note that this method uses innerHTML internally, so make sure to pre-sanitize any user-input content to prevent XSS vulnerabilities. name
linkVisibility([boolean, str or fn]) Link object accessor function, attribute or a boolean constant for whether to display the link line. A value of false maintains the link force without rendering it. true
linkColor([str or fn]) Link object accessor function or attribute for line color. color
linkAutoColorBy([str or fn]) Link object accessor function (fn(link)) or attribute (e.g. 'type') to automatically group colors by. Only affects links without a color attribute.
linkLineDash([num[], str or fn]) Link object accessor function, attribute or number array (e.g. [5, 15]) to determine if a line dash should be applied to this rendered link. Refer to the HTML canvas setLineDash API for example values. Either a falsy value or an empty array will disable dashing. null
linkWidth([num, str or fn]) Link object accessor function, attribute or a numeric constant for the link line width. Keep in mind that link widths remain visually contant through various zoom levels, where as node sizes scale relatively. 1
linkCurvature([num, str or fn]) Link object accessor function, attribute or a numeric constant for the curvature radius of the link line. Curved lines are represented as bezier curves, and any numeric value is accepted. A value of 0 renders a straight line. 1 indicates a radius equal to half of the line length, causing the curve to approximate a semi-circle. For self-referencing links (source equal to target) the curve is represented as a loop around the node, with length proportional to the curvature value. Lines are curved clockwise for positive values, and counter-clockwise for negative values. Note that rendering curved lines is purely a visual effect and does not affect the behavior of the underlying forces. 0
linkCanvasObject([fn]) Callback function for painting a custom canvas object to represent graph links. Should use the provided canvas context attribute to perform drawing operations for each link. The callback function will be called for each link at every frame, and has the signature: .linkCanvasObject(<link>, <canvas context>, <current global scale>). default link object is a line, styled according to width and color.
linkCanvasObjectMode([str or fn]) Link object accessor function or attribute for the custom drawing mode. Use in combination with linkCanvasObject to specify how to customize links painting. Possible values are:
  • replace: the link is rendered using just linkCanvasObject.
  • before: the link is rendered by invoking linkCanvasObject and then proceeding with the default link painting.
  • after: linkCanvasObject is applied after the default link painting takes place.
Any other value will be ignored and the default drawing will be applied.
() => 'replace'
linkDirectionalArrowLength([num, str or fn]) Link object accessor function, attribute or a numeric constant for the length (in px) of the arrow head indicating the link directionality. The arrow is displayed directly over the link line, and points in the direction of source > target. A value of 0 hides the arrow. 0
linkDirectionalArrowColor([str or fn]) Link object accessor function or attribute for the color of the arrow head. color
linkDirectionalArrowRelPos([num, str or fn]) Link object accessor function, attribute or a numeric constant for the longitudinal position of the arrow head along the link line, expressed as a ratio between 0 and 1, where 0 indicates immediately next to the source node, 1 next to the target node, and 0.5 right in the middle. 0.5
linkDirectionalParticles([num, str or fn]) Link object accessor function, attribute or a numeric constant for the number of particles (small circles) to display over the link line. The particles are distributed equi-spaced along the line, travel in the direction source > target, and can be used to indicate link directionality. 0
linkDirectionalParticleSpeed([num, str or fn]) Link object accessor function, attribute or a numeric constant for the directional particles speed, expressed as the ratio of the link length to travel per frame. Values above 0.5 are discouraged. 0.01
linkDirectionalParticleWidth([num, str or fn]) Link object accessor function, attribute or a numeric constant for the directional particles width (diameter). 4
linkDirectionalParticleColor([str or fn]) Link object accessor function or attribute for the directional particles color. color
emitParticle(link) An alternative mechanism for generating particles, this method emits a non-cyclical single particle within a specific link. The emitted particle shares the styling (speed, width, color) of the regular particle props. A valid link object that is included in graphData should be passed as a single parameter.

Render control

Method Description Default
autoPauseRedraw([boolean]) Getter/setter for performance optimization to automatically pause redrawing the canvas at every frame whenever the simulation engine is halted. If you have custom dynamic objects that rely on a constant redraw of the canvas, it's recommended to switch this option off. true
pauseAnimation()
(alias: stopAnimation)
Pauses the rendering cycle of the component, effectively freezing the current view and cancelling all user interaction. This method can be used to save performance in circumstances when a static image is sufficient.
resumeAnimation() Resumes the rendering cycle of the component, and re-enables the user interaction. This method can be used together with pauseAnimation for performance optimization purposes.
centerAt([x], [y], [ms]) Getter/setter for the coordinates of the center of the viewport. This method can be used to perform panning on the canvas programmatically. Each of the x, y coordinates is optional, allowing for motion in just one dimension. An optional 3rd argument defines the duration of the transition (in ms) to animate the canvas motion. A value of 0 (default) centers immediately in the final position. 0,0
zoom([num], [ms]) Getter/setter for the canvas zoom amount. The zoom is defined in terms of the scale transform of each px. A value of 1 indicates unity, larger values zoom in and smaller values zoom out. An optional 2nd argument defines the duration of the transition (in ms) to animate the canvas motion. A value of 0 (default) jumps immediately to the final position. By default the zoom is set to a value inversely proportional to the amount of nodes in the system.
zoomToFit([ms], [px], [nodeFilterFn]) Automatically zooms/pans the canvas so that all of the nodes fit inside it. If no nodes are found no action is taken. It accepts three optional arguments: the first defines the duration of the transition (in ms) to animate the canvas motion (default: 0ms). The second argument is the amount of padding (in px) between the edge of the canvas and the outermost node (default: 10px). The third argument specifies a custom node filter: node => <boolean>, which should return a truthy value if the node is to be included. This can be useful for focusing on a portion of the graph. (0, 10, node => true)
minZoom([num]) Getter/setter for the lowest zoom out level permitted. 0.01
maxZoom([num]) Getter/setter for the highest zoom in level permitted. 1000
onRenderFramePre(fn) Callback function to invoke at every frame, immediately before any node/link is rendered to the canvas. This can be used to draw additional external items on the canvas. The canvas context and the current global scale are included as parameters: .onRenderFramePre(<canvas context>, <global scale>). -
onRenderFramePost(fn) Callback function to invoke at every frame, immediately after the last node/link is rendered to the canvas. This can be used to draw additional external items on the canvas. The canvas context and the current global scale are included as parameters: .onRenderFramePost(<canvas context>, <global scale>). -

Force engine (d3-force) configuration

Method Description Default
dagMode([str]) Apply layout constraints based on the graph directionality. Only works correctly for DAG graph structures (without cycles). Choice between td (top-down), bu (bottom-up), lr (left-to-right), rl (right-to-left), radialout (outwards-radially) or radialin (inwards-radially).
dagLevelDistance([num]) If dagMode is engaged, this specifies the distance between the different graph depths. auto-derived from the number of nodes
dagNodeFilter([fn]) Node accessor function to specify nodes to ignore during the DAG layout processing. This accessor method receives a node object and should return a boolean value indicating whether the node is to be included. Excluded nodes will be left unconstrained and free to move in any direction. node => true
onDagError([fn]) Callback to invoke if a cycle is encountered while processing the data structure for a DAG layout. The loop segment of the graph is included for information, as an array of node ids. By default an exception will be thrown whenever a loop is encountered. You can override this method to handle this case externally and allow the graph to continue the DAG processing. Strict graph directionality is not guaranteed if a loop is encountered and the result is a best effort to establish a hierarchy. throws exception
d3AlphaMin([num]) Getter/setter for the simulation alpha min parameter. 0
d3AlphaDecay([num]) Getter/setter for the simulation intensity decay parameter. 0.0228
d3VelocityDecay([num]) Getter/setter for the nodes' velocity decay that simulates the medium resistance. 0.4
d3Force(str, [fn]) Getter/setter for the internal forces that control the d3 simulation engine. Follows the same interface as d3-force's simulation.force. Three forces are included by default: 'link' (based on forceLink), 'charge' (based on forceManyBody) and 'center' (based on forceCenter). Each of these forces can be reconfigured, or new forces can be added to the system.
d3ReheatSimulation() Reheats the force simulation engine, by setting the alpha value to 1. Only applicable if using the d3 simulation engine.
warmupTicks([int]) Getter/setter for number of layout engine cycles to dry-run at ignition before starting to render. 0
cooldownTicks([int]) Getter/setter for how many build-in frames to render before stopping and freezing the layout engine. Infinity
cooldownTime([num]) Getter/setter for how long (ms) to render for before stopping and freezing the layout engine. 15000
onEngineTick(fn) Callback function invoked at every tick of the simulation engine. -
onEngineStop(fn) Callback function invoked when the simulation engine stops and the layout is frozen. -

Interaction

Method Description Default
onNodeClick(fn) Callback function for node (left-button) clicks. The node object and the event object are included as arguments onNodeClick(node, event). -
onNodeRightClick(fn) Callback function for node right-clicks. The node object and the event object are included as arguments onNodeRightClick(node, event). -
onNodeHover(fn) Callback function for node mouse over events. The node object (or null if there's no node under the mouse line of sight) is included as the first argument, and the previous node object (or null) as second argument: onNodeHover(node, prevNode). -
onNodeDrag(fn) Callback function for node drag interactions. This function is invoked repeatedly while dragging a node, every time its position is updated. The node object is included as the first argument, and the change in coordinates since the last iteration of this function are included as the second argument in format {x,y,z}: onNodeDrag(node, translate). -
onNodeDragEnd(fn) Callback function for the end of node drag interactions. This function is invoked when the node is released. The node object is included as the first argument, and the change in coordinates from the node's initial postion are included as the second argument in format {x,y,z}: onNodeDragEnd(node, translate). -
onLinkClick(fn) Callback function for link (left-button) clicks. The link object and the event object are included as arguments onLinkClick(link, event). -
onLinkRightClick(fn) Callback function for link right-clicks. The link object and the event object are included as arguments onLinkRightClick(link, event). -
onLinkHover(fn) Callback function for link mouse over events. The link object (or null if there's no link under the mouse line of sight) is included as the first argument, and the previous link object (or null) as second argument: onLinkHover(link, prevLink). -
linkHoverPrecision([int]) Whether to display the link label when hovering the link closely (low value) or from far away (high value). 4
onBackgroundClick(fn) Callback function for click events on the empty space between the nodes and links. The event object is included as single argument onBackgroundClick(event). -
onBackgroundRightClick(fn) Callback function for right-click events on the empty space between the nodes and links. The event object is included as single argument onBackgroundRightClick(event). -
onZoom(fn) Callback function for zoom/pan events. The current zoom transform is included as single argument onZoom({ k, x, y }). Note that onZoom is triggered by user interaction as well as programmatic zooming/panning with zoom() and centerAt(). -
onZoomEnd(fn) Callback function for on 'end' of zoom/pan events. The current zoom transform is included as single argument onZoomEnd({ k, x, y }). Note that onZoomEnd is triggered by user interaction as well as programmatic zooming/panning with zoom() and centerAt(). -
nodePointerAreaPaint([fn]) Callback function for painting a canvas area used to detect node pointer interactions. The provided paint color uniquely identifies the node and should be used to perform drawing operations on the provided canvas context. This painted area will not be visible, but instead be used to detect pointer interactions with the node. The callback function has the signature: .nodePointerAreaPaint(<node>, <color>, <canvas context>, <current global scale>). default interaction area is a circle centered on the node and sized according to val.
linkPointerAreaPaint([fn]) Callback function for painting a canvas area used to detect link pointer interactions. The provided paint color uniquely identifies the link and should be used to perform drawing operations on the provided canvas context. This painted area will not be visible, but instead be used to detect pointer interactions with the link. The callback function has the signature: .linkPointerAreaPaint(<link>, <color>, <canvas context>, <current global scale>). default interaction area is a straight line between the source and target nodes.
enableNodeDrag([boolean]) Getter/setter for whether to enable the user interaction to drag nodes by click-dragging. If enabled, every time a node is dragged the simulation is re-heated so the other nodes react to the changes. Only applicable if enablePointerInteraction is true. true
enableZoomInteraction([boolean]) Getter/setter for whether to enable zooming user interactions. true
enablePanInteraction([boolean]) Getter/setter for whether to enable panning user interactions. true
enablePointerInteraction([boolean]) Getter/setter for whether to enable the mouse tracking events. This activates an internal tracker of the canvas mouse position and enables the functionality of object hover/click/drag and tooltip labels, at the cost of performance. If you're looking for maximum gain in your graph performance it's recommended to switch off this property. true

Utility

Method Description
getGraphBbox([nodeFilterFn]) Returns the current bounding box of the nodes in the graph, formatted as { x: [<num>, <num>], y: [<num>, <num>] }. If no nodes are found, returns null. Accepts an optional argument to define a custom node filter: node => <boolean>, which should return a truthy value if the node is to be included. This can be useful to calculate the bounding box of a portion of the graph.
screen2GraphCoords(x, y) Utility method to translate viewport coordinates to the graph domain. Given a pair of x,y screen coordinates, returns the current equivalent {x, y} in the domain of graph node coordinates.
graph2ScreenCoords(x, y) Utility method to translate node coordinates to the viewport domain. Given a pair of x,y graph coordinates, returns the current equivalent {x, y} in viewport coordinates.

Input JSON syntax

{
    "nodes": [
        {
          "id": "id1",
          "name": "name1",
          "val": 1
        },
        {
          "id": "id2",
          "name": "name2",
          "val": 10
        },
        ...
    ],
    "links": [
        {
            "source": "id1",
            "target": "id2"
        },
        ...
    ]
}

Giving Back

paypal If this project has helped you and you'd like to contribute back, you can always buy me a โ˜•!

force-graph's People

Contributors

alexithemia avatar benjaminaaron avatar davidballester avatar davidmyersdev avatar enixcoda avatar gabynevada avatar jumpinjackie avatar micahstubbs avatar mihirgokani007 avatar p-kimberley avatar raulprop avatar stefanprobst avatar tinchoz49 avatar trombach avatar vasturiano avatar veryspry avatar

Stargazers

 avatar  avatar  avatar  avatar  avatar  avatar  avatar  avatar  avatar  avatar  avatar  avatar  avatar  avatar  avatar  avatar  avatar  avatar  avatar  avatar  avatar  avatar  avatar  avatar  avatar  avatar  avatar  avatar  avatar  avatar  avatar  avatar  avatar  avatar  avatar  avatar  avatar  avatar  avatar  avatar  avatar  avatar  avatar  avatar  avatar  avatar  avatar  avatar  avatar  avatar  avatar  avatar  avatar  avatar  avatar  avatar  avatar  avatar  avatar  avatar  avatar  avatar  avatar  avatar  avatar  avatar  avatar  avatar  avatar  avatar  avatar  avatar  avatar  avatar  avatar  avatar  avatar  avatar  avatar  avatar  avatar  avatar  avatar  avatar  avatar  avatar  avatar  avatar  avatar  avatar  avatar  avatar  avatar  avatar  avatar  avatar  avatar  avatar  avatar  avatar

Watchers

 avatar  avatar  avatar  avatar  avatar  avatar  avatar  avatar  avatar  avatar  avatar  avatar  avatar  avatar  avatar  avatar  avatar  avatar

force-graph's Issues

WebGL 3D version vs force-graph

Hi @vasturiano,

I love your project, especially the nice concise and useful API.

What's the difference between this project and using the other 3-D force graph project with numDimensions = 2? I see this one uses a canvas renderer, and the other uses ThreeJS which in turn uses WebGL, but I though ThreeJS also uses a canvas renderer backup?

The feature-set of the 3D version looks almost the same as the 2D version.

Edit: To be more specific, could I simply use the 3d-force w/ numDimensions = 2 to achieve a nice WebGL-based 2d force rendering?

Disable dagMode with null or 'null'?

Hi! And thanks for this amazing lib!

I'm starting my graph with .dagMode('lr') and then trying to disable it with .dagMode(null) without success. That is the null value in the example:
https://github.com/vasturiano/force-graph/blob/master/example/tree/index.html#L20

After sometime I've found out it do disable with .dagMode('null') or any other non-valid dag mode string (like .dagMode('aaaaa').

I guess the example is working because the way it is because the gui select convert null to 'null' automatically. But if the right is 'null', maybe it would be better to fix the example.

issue with zoom

Describe the bug
A clear and concise description of what the bug is.
I want to change node drawing after some level of zoom. For this I want to set some threshold level for zoom.
is there any way to set zoom threshold level

on solution I thought that, if some how I can get the zoom level then I can check that zoom level with my threshold value but problem is how do I get current zoom level.

Also please let me know how can I get onwheel event on graph view.

To Reproduce
Steps to reproduce the behavior:

  1. Go to '...'
  2. Click on '....'
  3. Scroll down to '....'
  4. See error

Expected behavior
A clear and concise description of what you expected to happen.

Screenshots
If applicable, add screenshots to help explain your problem.

Desktop (please complete the following information):

  • OS: [e.g. iOS]
  • Browser [e.g. chrome, safari]
  • Version [e.g. 22]

Smartphone (please complete the following information):

  • Device: [e.g. iPhone6]
  • OS: [e.g. iOS8.1]
  • Browser [e.g. stock browser, safari]
  • Version [e.g. 22]

Additional context
Add any other context about the problem here.

Getting exception while use force-graph

Describe the bug
A clear and concise description of what the bug is.
I am facing below exception when I try to use sample example.

Uncaught TypeError: selection.interrupt is not a function
at Function.zoom.transform (vendor.js:136361)
at Function.zoom.translateBy (vendor.js:136390)
at adjustCanvasSize (vendor.js:137694)
at Function.init (vendor.js:138036)
at initStatic (vendor.js:150687)
at comp (vendor.js:150681)
at Class.drawNetworkView (vendor.js:605158)
at Class.didInsertElement (vendor.js:605135)
at Class.trigger (vendor.js:67828)
at Class.superWrapper [as trigger] (vendor.js:65474)

To Reproduce
Steps to reproduce the behavior:
I just copy the sample code and try to launch graph view but not able to see any thing due to exception.

I am able to see view when I try to hit yours link
https://vasturiano.github.io/force-graph/example/basic/
Screen Shot 2019-08-14 at 3 36 08 PM

Expected behavior
A clear and concise description of what you expected to happen.

Screenshots
If applicable, add screenshots to help explain your problem.

Desktop (please complete the following information):

  • OS: [e.g. iOS]
  • Browser [e.g. chrome, safari]
  • Version [e.g. 22]

Smartphone (please complete the following information):

  • Device: [e.g. iPhone6]
  • OS: [e.g. iOS8.1]
  • Browser [e.g. stock browser, safari]
  • Version [e.g. 22]

Additional context
Add any other context about the problem here.

my sample code attached here.
in my templlate.hbs file I've declared div
and
in my js file I've write below method.
drawNetworkView () {

const N = 80;
const gData = {
  nodes: [...Array(N).keys()].map(i => ({ id: i })),
  links: [...Array(N).keys()]
    .filter(id => id)
    .map(id => ({
      source: id,
      target: Math.round(Math.random() * (id-1))
    }))
};
const NODE_R = 8;
let highlightNodes = [];
let highlightLink = null;
const elem = document.getElementById('graph');
window.ForceGraph()(elem)
  .graphData(gData)
  .nodeRelSize(NODE_R)
  .onNodeHover(node => {
    highlightNodes = node ? [node] : [];
    elem.style.cursor = node ? '-webkit-grab' : null;
  })
  .onLinkHover(link => {
    highlightLink = link;
    highlightNodes = link ? [link.source, link.target] : [];
  })
  .linkWidth(link => link === highlightLink ? 5 : 1)
  .linkDirectionalParticles(4)
  .linkDirectionalParticleWidth(link => link === highlightLink ? 4 : 0)
  .nodeCanvasObjectMode(node => highlightNodes.indexOf(node) !== -1 ? 'before' : undefined)
  .nodeCanvasObject((node, ctx) => {
    // add ring just for highlighted nodes
    ctx.beginPath();
    ctx.arc(node.x, node.y, NODE_R * 1.4, 0, 2 * Math.PI, false);
    ctx.fillStyle = 'red';
    ctx.fill();
  });

}

motion warning for move-viewport example?

the control you have over the camera in the move-viewport example is pretty cool.

that said, this particular example made me feel a bit seasick after a couple rotations (a few seconds of watching) https://github.com/vasturiano/force-graph/blob/master/example/move-viewport/index.html

perhaps we could add a README.md to the examples directory https://github.com/vasturiano/force-graph/tree/master/example

that warned new people about the motion in the move-viewport example

Push particles by demand.

Is your feature request related to a problem? Please describe.
I want to show data flowing into a network using the particles system but show something like impulses.

I have a node stream that represent a link in the graph (a connection) and I want to show a particle everytime I send/receive data from it.

Describe the solution you'd like
Could be nice to have something like: pushDirectionalParticle(from, to)

Awesome work btw! thanks!

handle links named edges gracefully

it would be friendly to handle datasets that have and edges key instead of a links key

some code like this has done this for me before

    // be flexible, accept datasets that have
    // edges instead of links
    if (
      typeof data.links === 'undefined' &&
      typeof data.edges !== 'undefined'
    ) {
      data.links = data.edges
      delete data.edges
    }

how to know the mouse position when mouse hovering custom thing

I want to implement this effect that when click a node it shows more tool like in neo4j browser.
Selection_048

here is my implement:

image

next, I want to capture the mouse position to know whether it is hover the three tools, and which one. but mouse position in the canvas "mousePos.x" and "mousePos.Y" is not same as the node position.

I want to know how to connect the relationship between mousePos and node's position. so when click a node, it show three tools, and then i can know which tool mouse hovering

Part of data caption in node

Hi,

First off i would like to say that i really like this libary :) The visualisation look amazing. That said i was wondering if it's possible to display the data caption, partial in the node? Like this image:
image

I'm using this code:

session
.run('MATCH (n)-->(m) RETURN { id: id(n), label:head(labels(n)), caption:n.title } as source, { id: id(m), label:head(labels(m)), caption:m.title } as target LIMIT $limit', {limit: 1000})
.then(function (result) {
const nodes = {}
const links = result.records.map(r => {
var source = r.get('source');source.id = source.id.toNumber();
nodes[source.id] = source;
var target = r.get('target');target.id = target.id.toNumber();
nodes[target.id] = target;
return {source:source.id,target:target.id};
});
session.close();
console.log(links.length+" links loaded in "+(new Date()-start)+" ms.")
const gData = {nodes: Object.values(nodes), links: links}
const Graph = ForceGraph()(elem)
.graphData(gData)
.backgroundColor('#ffffff')
.nodeLabel(node => ${node.label}: ${node.caption})
.onNodeHover(node => elem.style.cursor = node ? 'pointer' : null)
.nodeAutoColorBy('label')
.nodeCanvasObjectMode(() => 'after')
.nodeCanvasObject((node, ctx) => 'label')
.nodeCanvasObject((node, ctx, globalScale) => {
const label = node.caption;
const fontSize = 12/globalScale;
ctx.font = ${fontSize}px Sans-Serif;
const textWidth = ctx.measureText(label).width;
const bckgDimensions = [textWidth, fontSize].map(n => n + fontSize * 0.2); // some padding
ctx.fillStyle = 'rgba(255, 255, 255, 0.8)';
ctx.fillRect(node.x - bckgDimensions[0] / 2, node.y - bckgDimensions[1] / 2, ...bckgDimensions);
ctx.textAlign = 'center';
ctx.textBaseline = 'middle';
ctx.fillStyle = node.color;
ctx.fillText(label, node.x, node.y);
});
});

Examples do not seem to work in Safari or Firefox

On the console I keep getting:

[Error] Unhandled Promise Rejection: TypeError: The provided value is non-finite
getImageData (force-graph.min.js:2:96999)
e (force-graph.min.js:2:96999)
init (force-graph.min.js:2:97459)
n (force-graph.min.js:2:44363)
i (force-graph.min.js:2:44325)
(anonymous function) (directional-links:13)
promiseReactionJob

Which relates to:
var t = o.colorTracker.lookup(u.getImageData(s.x, s.y, 1, 1).data);

Looking at the code, it seems to check if pointer interaction is enabled, but even if I disable it, I still get the exception.

When hiding and showing the graph, pointer events no longer work

I have been using jquery to .hide(), .empty(), and .detach() the div containing the force graph, and when I try to redraw the graph, no mouse pointer events work (on hover tooltip doesn't display, even though it's div and position show in the div) and the style=cursor:point tag isn't fired on the parent div.

Link visibility as option

It would be good, if there is an parameter for visibility. When setting width to a really small value, the link just doesnt appear, but if i have linkLabel on hover, all the links are still there.

disable capturing scroll events unless clicked

I'm trying to have my force graph only be zoom-able if a user actively clicks the graph. Right now if i hover over the graph for a period of time, it seems to automatically capture this and forces a user to click outside the graph to be able to scroll the rest of the window. Is there a method I am missing to enable such a feature?

Use predefined coordinates for nodes

Hi,

I'm working with a fairly large graph (22K nodes and 70K edges) and I'm trying to find the best way of rendering it in the browser. So far I've tried both D3 and Sigma.js, with sigma performing the best, but still with a lot of lag when interacting with the graph.

I tested my data with this component, and it looks promising, but because it's computing the layout it takes too long for my use case. But since my data already includes x and y coordinates for the nodes, I was wondering if it's possible to use the component to render the graph without a iterative layout? Maybe I missed this in some of the examples, but they all seemed to use a computed layout.

Thanks for a great component!

add .gitignore

it would be nice to ignore some generated dirs, so that contributors don't accidentally commit them.

	dist/
	node_modules/

Text as Nodes doesn't allow for .nodeColor()

I'm trying to use the "text as nodes" example listed in the documentation. However, when I replace .nodeAutoColorBy('group') with .nodeColor(), the text is white and unreadable regardless of what color I attempt to input.

How to create external drawing.

I am able to create graph view successfully. Now I want to add some external drawing with the graph view.
For this I want canvas context object. How can get this.

for example: In the attached image I have display two rect which is not a part of graph view but I want to display this with graph. How can I archive this.

It will be helpful for me if somehow I can get context object as a global object.

Screen Shot 2019-08-28 at 6 31 56 PM

Control on Link Length, Collision detection and Node spacing

@vasturiano Thanks for all the good work.

I am working on this graph with higher number of nodes. But when i have built it the nodes size is reduced a lot, i have custom sized it in nodeCanvasObject(). There are multiple groups and distance between this groups is increased a lot, which the groups come closer, can you please suggest how to get groups closer?

And the links length is also more, wish to control this, any suggestions ?
And i have fixed div, width and height and want my force graph not to cross those limits. I have checked collision detection example but that is not serving my purpose. Can you please suggest?

Note: have given all group names as "Sample Group" but all of them have different ids
image

combine "text as nodes" and "click"

while using these together:
.nodeCanvasObject()
.onNodeClick(),
only small center of the canvas can trigger click event, not entire object.

New feature request: node and link rendering function on top of default behavior

Hi. First of all, amazing library. I enjoy it a lot.

I'm working on a personal project and found a situation in which I want to customize how the links are rendered (by adding a label), but also want to relay on the default rendering mechanism.

I thought it could be interesting to be able to specify that my linkCanvasObject function is not meant to substitute the link rendering, just to be executed and then proceed with the default rendering. Possibly by returning a boolean, for instance. Or maybe specifying a different prop for that, I haven't thought much about it.

If you think that is something worth doing, I could try and make a PR for it.

Reheating the simulation

Hi Vasturiano!

Thanks for your amazing library, super useful!

In some use cases I want to reheat the force simulation after it has started or change some settings on the fly. Often this requires access to the main simulation object, e.g. by saying simulation.alpha(1).restart(), as per d3.

I guess in general it's very useful to be able to access the main simulation object in case you need it. Is this possible or is there a way this can be done or to expose it?

Any help is much appreciated :-)

text label shown by default

Hello,

I am wondering if it is possible to show node labels next to nodes just like it is the case in sigma.js?

Thank you in advance!

Add div in side the node canvas

Is your feature request related to a problem? Please describe.
A clear and concise description of what the problem is. Ex. I'm always frustrated when [...]
Is it possible if I to use div as a Node. By default node are canvas but I want to use div as a node.
Describe the solution you'd like
A clear and concise description of what you want to happen.

Describe alternatives you've considered
A clear and concise description of any alternative solutions or features you've considered.

Additional context
Add any other context or screenshots about the feature request here.

How to add link label curved linlks.

Am using force-graph in my project and i am using 'linkCurvature ' for curve link and ' .linkCanvasObjectMode' and '.linkCanvasObject' for link label but problem is that am not able to get link label on curved links, how can i do so.

Here i share my code.

`

    fetch('../assets/json/miserables.json').then(res => res.json()).then(data => {
      this.Graph = ForceGraph()
      (document.getElementById('graph'))
        .graphData(data)
        .nodeId('id')
        .nodeLabel('name')
        .linkCurvature('curvature')
        .nodeAutoColorBy('group')
        .linkDirectionalArrowLength(1) // 0 off 1 on for arrow
        .linkDirectionalArrowRelPos(function (d) {
          return d.markerPosition; // 0 start, 0.5 middle, 1 end
        })
        .linkDirectionalArrowLength(5)
        .linkDirectionalArrowLength(5)
        .linkCanvasObjectMode(() => 'after')
    .linkCanvasObject((link, ctx) => {
      const MAX_FONT_SIZE = 4;
      const LABEL_NODE_MARGIN = this.Graph.nodeRelSize() * 1.5;
      const start = link.source;
      const end = link.target;
      // ignore unbound links
      if (typeof start !== 'object' || typeof end !== 'object') return;
      // calculate label positioning
      const textPos = Object.assign({},...['x', 'y'].map(c => ({
        [c]: start[c] + (end[c] - start[c]) / 2 // calc middle point
      })));
      const relLink = { x: end.x - start.x, y: end.y - start.y };
      const maxTextLength = Math.sqrt(Math.pow(relLink.x, 2) + Math.pow(relLink.y, 2)) - LABEL_NODE_MARGIN * 2;
      let textAngle = Math.atan2(relLink.y, relLink.x);
      // maintain label vertical orientation for legibility
      if (textAngle > Math.PI / 2) textAngle = -(Math.PI - textAngle);
      if (textAngle < -Math.PI / 2) textAngle = -(-Math.PI - textAngle);
      const label = link.linkType;
      // estimate fontSize to fit in link length
      ctx.font = '1px Sans-Serif';
      const fontSize = Math.min(MAX_FONT_SIZE, maxTextLength / ctx.measureText(label).width);
      ctx.font = `${fontSize}px Sans-Serif`;
      const textWidth = ctx.measureText(label).width;
      const bckgDimensions = [textWidth, fontSize].map(n => n + fontSize * 0.2); // some padding
      // draw text label (with background rect)
      ctx.save();
      ctx.translate(textPos.x, textPos.y);
      ctx.rotate(textAngle);
      ctx.fillStyle = 'rgba(255, 255, 255, 0.8)';
      ctx.fillRect(- bckgDimensions[0] / 2, - bckgDimensions[1] / 2, ...bckgDimensions);
      ctx.textAlign = 'center';
      ctx.textBaseline = 'middle';
      ctx.fillStyle = 'darkgrey';
      ctx.setLineDash([5, 5]);
      ctx.fillText(label, 0, 0);
      ctx.restore();
    })

    .nodeCanvasObjectMode(() => 'after')
    .nodeCanvasObject((node, ctx, globalScale) => {
      const label = node.Name;
      const fontSize = 18 / globalScale;
      ctx.font = `${fontSize}px Arial`;
      const textWidth = ctx.measureText(label).width;
      const bckgDimensions = [textWidth, fontSize].map(n => n + fontSize * 0.2); // some padding
      ctx.fillStyle = 'rgba(255, 255, 255, 0.8)';
      ctx.fillRect(node.x - bckgDimensions[0] / 2, node.y - bckgDimensions[1] / 2, ...bckgDimensions);
      ctx.textAlign = 'center';
      ctx.textBaseline = 'middle';
      ctx.fillStyle = node.color;
      // ctx.fillStyle = '#7D8080';
      ctx.fillText(label, node.x, node.y);
    })

   
    .d3Force('collide', d3.forceCollide(30))
    
    .linkColor(function(d){
      return d.color;
    })
    
    .zoom(2)
    .nodeRelSize(10)
    .linkDirectionalParticles(1)
    .linkDirectionalParticleColor(function(){
      return "#6ECF9C";
    })
    .linkDirectionalArrowColor(function(){
      return "#757977";
    })
    .onNodeClick(node => {
      // Center/zoom on node
      this.Graph.centerAt(node.x, node.y, 1000);
      this.Graph.zoom(8, 1500);
    });
});`

[Question] Set forceLink via d3Force

I would like to set link forces through d3Force option. The edges have types and I would like to set different link forces to different link types as the README describes: d3Force(str, [fn])

So my code looks like this:

(document.getElementById('canvas'))
  ...
  .d3Force('link', link => isHighPriorityEdge(link.type) ? 25 : 2)

When I load the page, I get JavaScript error, that id.x is not a function.
Have I missed something or how can I set different forces to different links?

Search

Hi, really nice work! This makes dealing with d3 significantly easier! I was wondering what the best way to implement a simple search that highlights desired nodes by name would be? E.g, how could I modify the lower level parts of your code to include search functions like this one - https://bl.ocks.org/jrladd/raw/c76799aa63efd7176bd9006f403e854d/

Default position of nodes on canvas

Is your feature request related to a problem? Please describe.
A clear and concise description of what the problem is. Ex. I'm always frustrated when [...]
By default in the graph view, nodes would take its own positions. I want to place each node at particular place.

for example by default my graph view look link as shown in attachment "view 1" but I want my default view would be as show in attachment "view 2"

How can I achieve this?
view 1
view 2

Describe the solution you'd like
A clear and concise description of what you want to happen.

Describe alternatives you've considered
A clear and concise description of any alternative solutions or features you've considered.

Additional context
Add any other context or screenshots about the feature request here.

Node is not clickable or responding to any mouseevent if corresponding node object has 'val' property

Describe the bug
Node is not clickable or response to any mouse event if corresponding node object has 'val' property. Using such graph data, if by default, the node will not be drawn. if use nodecanvasobject function, customized things will be drawn but not clickable.

To Reproduce
Steps to reproduce the behavior:
Go to any example, add val property to any node in the graph data

see jsfiddle: https://jsfiddle.net/0b16jmkq/4/

Additional context
the type definition lib: @types/force-graph has a GraphNode type which takes node associated data as 'val', this could be really buggy for the graph and make ppl (like me) debugging why the click is not working for 6 hours.

Create nodes on click

Thank you very much for the excellent features!
In the docs, there are many event listeners for what concerns nodes and links interactions. However, I see no similar container events for what concerns the graph area on which the components are rendered.
Is there any way to trigger events tied to the graph container, such as creating a node on mouse click with specific coordinates (for example accessing the underlying graph canvas)?

XSS vulnerability in labels

Thanks for the great library! I've found it very useful.

I wanted to point out a possible vulnerability present when visualizin user-submitted data with the library. This is tested with the 2d graph utilities and I'm not sure if it applies to 3d and VR too.

Node and link labels enable embedding HTML content in addition to plain text. In a scenario where the node or label label is user-inputed (for example a username or data scraped online), it is possible to inject javascript that gets executed. A simple example is a node label that contains <img src="aaa" onError="alert('danger')">. The onError callback gets executed and can contain any arbitrary JS. If the graph data is stored on backend this becomes a stored XSS.

The behavior of rendering HTML in labels is not necessarily obvious to a user of this library even when it is documented. I would suggest including a note to the documentation that any user/3rd pary input to labels should be properly sanitized to prevent the issue. As an even more efficient precaution rendering HTML could be behind a flag with the default being just text content though this would require a breaking API change.

More info on XSS vulnerabilities: https://www.owasp.org/index.php/Cross-site_Scripting_(XSS)

Data Structure for DAG?

Sorry if this is the wrong place for this, but I was wondering if there is an example data structure to use when the graph is set to a DAG layout, specifically 'td'. Not sure if the Force-Graph just detected and laid out the hierarchy based on link connections, or if the data set could be restructured to specify children.

The layout is broken for the basic example code

Describe the bug

The final layout of the graph is nearly broken when I try the basic example with my data.

To Reproduce
Steps to reproduce the behavior:

  1. Use my HTML code.
  2. Load a graph with 5000 nodes and 5000 edges.
  3. Use Chrome to browser the HTML.

Expected behavior

A beautiful graph

Screenshots

The final layout looks like this:

image

Desktop (please complete the following information):

  • OS: Win10
  • Browser: Chrome 77
  • UA: Mozilla/5.0 (Windows NT 10.0; Win64; x64) AppleWebKit/537.36 (KHTML, like Gecko) Chrome/77.0.3865.90 Safari/537.36

Additional context

My script:

<head>
    <style> body { margin: 0; } </style>

    <script src="//unpkg.com/force-graph"></script>
    <!--<script src="../../dist/force-graph.js"></script>-->
</head>

<body>
<div id="graph"></div>

<script type="text/javascript" src="../data/data.js"></script>
<script>
  let i, s, N = data["nodes"].length, E = data["links"].length;
  let g = {
    nodes: [],
    edges: []
  };
  let h = {}; // Hash table, IP/domain->id

  for (let i = 0; i < N; i++)
  {
    let node = data['nodes'][i]
    h[node['id']] = i.toString();
    g.nodes.push({
      id: i.toString(),
      label: node["id"],
      x: Math.random(),
      y: Math.random(),
      size: 1,
      color: (node["group"] == '0' ? '#ff0000' : '#0099ee')
    })
  }


  for (let i = 0; i < E; i++)
  {
    let edge = data['links'][i]
    g.edges.push({
      id: i.toString(),
      source: h[edge["source"]],
      target: h[edge["target"]],
      color: '#666'
    })
  }

  // Random tree
  const gData = {
    nodes: g.nodes,
    links: g.edges
  };

  const Graph = ForceGraph()
  (document.getElementById('graph'))
    .linkDirectionalParticles(2)
    .graphData(gData);
</script>
</body>

`data.js`` defines a JSON graph with ~5000 nodes and ~5000 edges. As it contains confidential information, I cannot share it in current form.

Node hovering sensitivity

Hello again!
I was wondering if there is a parameter I can access to in order to configure the sensitivity area of a node when hovering. I want to do this because currently, I am drawing the nodes dynamically, and their size depends on a given feature of a node. I also add labels to the nodes, which are centered. When trying to drag or click the node, I can only do this if I place the cursor over the label, this is, at the center of the node.

Recommend Projects

  • React photo React

    A declarative, efficient, and flexible JavaScript library for building user interfaces.

  • Vue.js photo Vue.js

    ๐Ÿ–– Vue.js is a progressive, incrementally-adoptable JavaScript framework for building UI on the web.

  • Typescript photo Typescript

    TypeScript is a superset of JavaScript that compiles to clean JavaScript output.

  • TensorFlow photo TensorFlow

    An Open Source Machine Learning Framework for Everyone

  • Django photo Django

    The Web framework for perfectionists with deadlines.

  • D3 photo D3

    Bring data to life with SVG, Canvas and HTML. ๐Ÿ“Š๐Ÿ“ˆ๐ŸŽ‰

Recommend Topics

  • javascript

    JavaScript (JS) is a lightweight interpreted programming language with first-class functions.

  • web

    Some thing interesting about web. New door for the world.

  • server

    A server is a program made to process requests and deliver data to clients.

  • Machine learning

    Machine learning is a way of modeling and interpreting data that allows a piece of software to respond intelligently.

  • Game

    Some thing interesting about game, make everyone happy.

Recommend Org

  • Facebook photo Facebook

    We are working to build community through open source technology. NB: members must have two-factor auth.

  • Microsoft photo Microsoft

    Open source projects and samples from Microsoft.

  • Google photo Google

    Google โค๏ธ Open Source for everyone.

  • D3 photo D3

    Data-Driven Documents codes.