uwglaciology / communityfirnmodel Goto Github PK
View Code? Open in Web Editor NEWThe repository for the Community Firn Model
License: MIT License
The repository for the Community Firn Model
License: MIT License


Hi there!
This looks like an awesome model, I'd suggest to add it to
https://github.com/awesome-cryosphere/cryosphere-links
....if you wish to, of course ;-)
Hi,
I set up the repo on my computer and tried to run the main.py file with the example.json but got this error:
Traceback (most recent call last): File "C:\Users\xxxx\Documents\perso_work\CommunityFirnModel\CFM_main\main.py", line 84, in <module> firn = FirnDensityNoSpin(configName, climateTS = climateTS, NewSpin = NewSpin) ^^^^^^^^^^^^^^^^^^^^^^^^^^^^^^^^^^^^^^^^^^^^^^^^^^^^^^^^^^^^^^^^^^^^^^^ File "C:\Users\xxxx\Documents\perso_work\CommunityFirnModel\CFM_main\firn_density_nospin.py", line 466, in __init__ self.sublimSec = self.sublim / S_PER_YEAR / (S_PER_YEAR/self.dt) # sublimation at each time step (meters i.e. per second). gets multiplied by S_PER_YEAR later. (sort of hacky, I know) ~~~~~~~~~~~~~~~~~~~~~~~~~^~~~~~~~~~~~~~~~~~~~~~ ValueError: operands could not be broadcast together with shapes (6827,) (6828,)
I am not sure what the issue is.
I installed all the requirements ( in requirement file, missing psutil, that was required to run the example).
Thank you for your assistance.
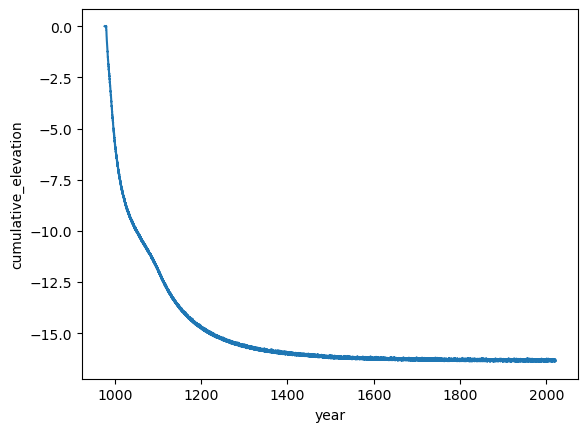
Hi there, I've created a simple script to plot the cumulative elevation change against time for the example output with the following path '/CommunityFirnModel/CFM_main/CFMoutput_example/df/CFMresults.hdf5'. I've included this script below. The elevation change for the 40 years is showing as around -17.5m, this seems far too significant a decrease given that the example is meant to be for the Summit station on Greenland, am I missing something?
import xarray as xr
results_filename = '/CommunityFirnModel/CFM_main/CFMoutput_example/df/CFMresults.hdf5'
ds = xr.open_dataset(results_filename)
dimensions_dict = {ds.density.dims[0]:'time',ds.density.dims[1]:'cell'}
ds = ds.rename_dims(dimensions_dict)
year_data = ds.isel(cell=0).density.data
ds = ds.assign_coords(year = ('time',year_data))
ds = ds.isel(cell=slice(1,None))
ds['cumulative_elevation']=ds.DIP[:,6]
ds['cumulative_elevation'].plot.line(x='year')
Would it be possible to include the example CSV files in CFMinput? The pkl file of MERRA data (MERRA2_CLIM_df_72.5_-38.75.pkl) is there, but the following CSV files (that are required for the example run) are not.
"InputFileFolder": "CFMinput",
"InputFileNameTemp": "example_tskin.csv",
"InputFileNamebdot": "example_smb.csv",
"InputFileNameIso": "example_isotope.csv",
"InputFileNamerho": "example_rhos.csv",
"InputFileNamemelt": "example_melt.csv",
"initfirnFile": "example_firndata.csv",
This would make it very easy for a newbie (like myself) to clone the CFM and run the example case using example.json. It would also provide a starting place to start creating one's own input files.
I've noticed some odd behaviour with cumulative elevation. That is cumulative elevation during the reference spin-up phase does not flatten (e.g. I would expect eventually cumulative elevation would stop changing as the state reaches an equilibrium). To show this behaviour I've created the following example script, where I've used the example csvs for the Summit station and have extended the spinup time even further to emphasise the result. Note, since the average snowfall is 0.23 mIeq/yr it's expected the number of years required to completely refresh the column is 120/0.23=522 (120m is the domain depth).
import glob
import numpy as np
import pandas as pd
import json
import subprocess
### Extending SpinUP
for f in glob.glob('/CommunityFirnModel/CFM_main/CFMinput_example/example*'):
	df = pd.read_csv(f).T
	df_spin = df[df.index.astype('float32') < 1980]
	df_extended = pd.concat([df_spin,df])
	old_index = df_extended.index.astype('float32')
	step_size = old_index[1]-old_index[0]
	new_index = np.arange(0,len(old_index))*step_size + old_index.max() - len(old_index)*step_size
	df_extended = df_extended.set_index(new_index)
	new_filename = f.split('/')[-1].replace('example','extended')
	df_extended.T.to_csv(f'/CommunityFirnModel/CFM_main/CFMinput_example/{new_filename}',index=False, header=True)

### Loading and editing JSON file for CFM run
with open('/CommunityFirnModel/CFM_main/example.json', 'r') as read_file:
	adjusted_json = json.load(read_file)
adjusted_json['InputFileNameTemp'] = 'extended_TSKIN.csv'
adjusted_json['InputFileNamebdot'] = 'extended_BDOT.csv'
adjusted_json['InputFileNamemelt'] = 'extended_SMELT.csv'
adjusted_json['InputFileNameRain'] = 'extended_RAIN.csv'
adjusted_json['input_type'] = 'csv'
adjusted_json['TWriteStart'] = 980.0
adjusted_json['residual_strain'] = 0.0
adjusted_json['doublegrid'] = False

with open('/CommunityFirnModel/CFM_main/adjusted.json', 'w') as json_file:
	json.dump(adjusted_json, json_file, indent=0)

### Running CFM with edited JSON
subprocess.call(['python','/CommunityFirnModel/CFM_main/main.py','/CommunityFirnModel/CFM_main/adjusted.json','-n'])
The result of running the above script is the following, where it can be seen no steady state is reached.
import xarray as xr
ds = xr.open_dataset('/CommunityFirnModel/CFM_main/CFMoutput_example/df/CFMresults.hdf5')
dimensions_dict = {ds.density.dims[0]:'time',ds.density.dims[1]:'cell'}
ds = ds.rename_dims(dimensions_dict)
year_data = ds.isel(cell=0).density.data
ds = ds.assign_coords(year = ('time',year_data))
ds = ds.isel(cell=slice(1,None))
ds['cumulative_elevation']=ds.DIP[:,6]
ds['cumulative_elevation'].plot.line(x='year')
The equation for elevation change is given in firn_density_no_spin.py as:
self.dHcorr = (self.sdz_new - self.sdz_old) + self.dh_acc + self.dh_melt - (iceout_corr*self.t[iii]) # iceout has units m ice/year, t is years per time step.This doesn't make complete sense to me as it feels like melt is being counted twice since (a similar issue as mentioned in issue #9), since self.sdz_new is labelled as including the impact of melt:
self.sdz_new = np.sum(self.dz) #total column thickness after densification, melt, horizontal strain, before new snow addedI tried adjusting the code to leave out self.dh_melt from the above:
#self.dHcorr = (self.sdz_new - self.sdz_old) + self.dh_acc + self.dh_melt - (iceout_corr*self.t[iii]) # iceout has units m ice/year, t is years per time step.
self.dHcorr = (self.sdz_new - self.sdz_old) + self.dh_acc - (iceout_corr*self.t[iii]) # iceout has units m ice/year, t is years per time step.
Doing this I get the following result, where minimal difference is made since Summit receives minimal melt:
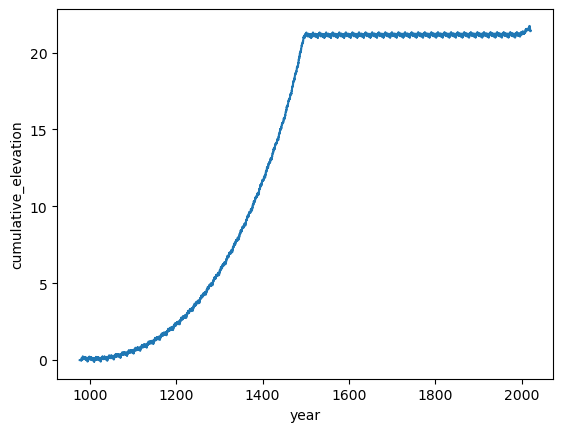
I've also tried replacing the above with a commented out line in the original code, which seems like it should work:
#self.dHcorr = (self.sdz_new - self.sdz_old) + self.dh_acc + self.dh_melt - (iceout_corr*self.t[iii]) # iceout has units m ice/year, t is years per time step.
self.dHcorr = self.z[-1] - self.z_old[-1]
This does seem to result in a steady state reached at around 500 years:
Although, this doesn't seem to work for high-melt sites, which I've simulated using the following example adjustment to the input data:
### Extending SpinUP
for f in glob.glob('/CommunityFirnModel/CFM_main/CFMinput_example/example*'):
df = pd.read_csv(f).T
df_spin = df[df.index.astype('float32') < 1980]
###############
if 'SMELT' in f:
df_spin = df_spin+2
df = df+5
elif 'BDOT' in f:
df_spin = df_spin+1
df = df+1
###############
df_extended = pd.concat([df_spin,df])
old_index = df_extended.index.astype('float32')
step_size = old_index[1]-old_index[0]
new_index = np.arange(0,len(old_index))*step_size + old_index.max() - len(old_index)*step_size
df_extended = df_extended.set_index(new_index)
new_filename = f.split('/')[-1].replace('example','extended')
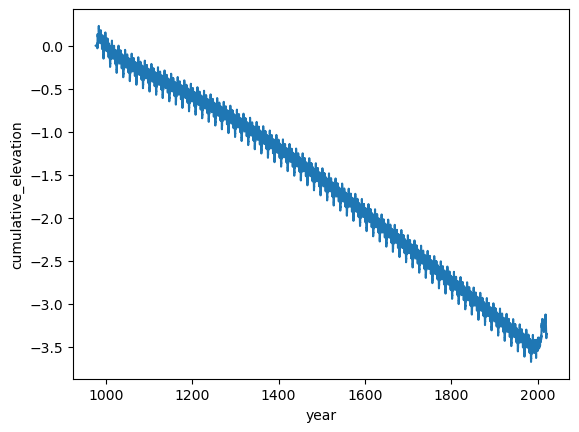
df_extended.T.to_csv(f'/CommunityFirnModel/CFM_main/CFMinput_example/{new_filename}',index=False, header=True)The above adjustment produces the following, which while it reaches an equilibrium shows no step change at the year 1452 where melt goes from approximately 2 to 5 m iEq/yr.
Am I missing something in all the above or is there an issue with the calculation of cumulative elevation?
Best,
Jez
Hi there, I'm interested in the calculation for total compaction, specifically the line 1402 in firn_density_nospin.py:
self.comp_firn = self.sdz_new - self.sdz_old #total compaction of just the firn during the previous time stepThe calculations for self.sdz_new and self.sdz_old are given in lines 1126 and 938 respectively:
self.sdz_new = np.sum(self.dz) #total column thickness after densification, melt, horizontal strain, before new snow addedself.dz_old = np.copy(self.dz) # model volume thicknesses before the compaction
self.sdz_old = np.sum(self.dz) # old total column thickness (s for sum)Given these definitions it seems that the calculation for total compaction is also including effects from melt and horizontal strain. To remove these effects I would expect something like:
self.comp_firn = self.sdz_new - self.sdz_old - self.dh_melt - (iceout_corr*self.t[iii])Alternatively, adding a couple of lines after 940:
(line 940) self.dz         = self.mass / self.rho * self.dx # new dz after compaction
self.sdz    = np.sum(self.dz) # total column thickness after compaction
self.comp_firn = self.sdz - self.sdz_old
Am I getting confused and missing something?
Best,
Jez
Hello,
I was trying to run the CFM using csv input files and got the error: "ValueError: could not convert string to float: '1980.00'"
I fixed this by editing the reader on line 25 from:
data = np.loadtxt(FID, delimiter=',') #changed 3/6/17 to loadtxt from genfromtxt; much faster
to:
data = np.genfromtxt(FID, delimiter=',') #changed 3/6/17 to loadtxt from genfromtxt; much faster
This issue also occurred when I used np.loadtxt to read a csv outside a CFM run.
Not sure if this is an issue with my computer specifically or not.
Thanks!
A declarative, efficient, and flexible JavaScript library for building user interfaces.
🖖 Vue.js is a progressive, incrementally-adoptable JavaScript framework for building UI on the web.
TypeScript is a superset of JavaScript that compiles to clean JavaScript output.
An Open Source Machine Learning Framework for Everyone
The Web framework for perfectionists with deadlines.
A PHP framework for web artisans
Bring data to life with SVG, Canvas and HTML. 📊📈🎉
JavaScript (JS) is a lightweight interpreted programming language with first-class functions.
Some thing interesting about web. New door for the world.
A server is a program made to process requests and deliver data to clients.
Machine learning is a way of modeling and interpreting data that allows a piece of software to respond intelligently.
Some thing interesting about visualization, use data art
Some thing interesting about game, make everyone happy.
We are working to build community through open source technology. NB: members must have two-factor auth.
Open source projects and samples from Microsoft.
Google ❤️ Open Source for everyone.
Alibaba Open Source for everyone
Data-Driven Documents codes.
China tencent open source team.