This code is a GUI wrapper around polyfit and scipy curve optimize to easily allow users to plot polynomial and custom law graphs. The code gives values for fitting parameters with uncertainties and reduced chi squared values for data analysis and comparison with theory.
This code allows users to easily create their own plots of experimental data for polynomial fits or for custom laws defined by the user. The code is fully GUI based for simplicity to use. If you are using the anaconda distribution of python (the default for UoM physics) then you do not need any extra library instillations you wil be able to run the code straight away.
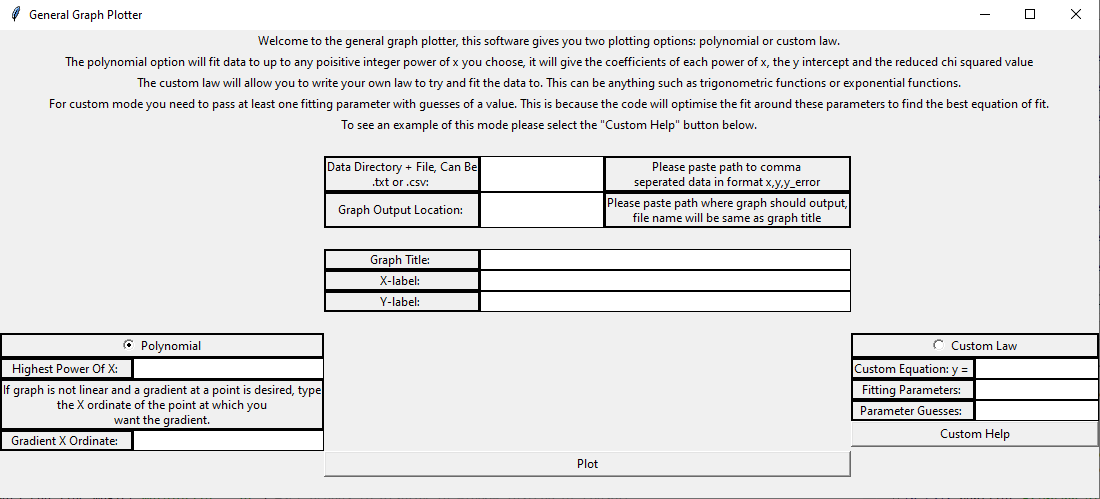
Above is an example of the default window you will get when running the code. First a data file needs to be specified, this can be done by copying and pasting the directory where the file is stored then adding \filename.txt or \filename.csv to the end of it depending on which format your data file is written in.
Next you can specify an output directory, this is where the graph that is plotted will be saved to automatically. As before just copy and paste the directory you would like the file to be stored in but do not add anything to the end of this one, titling will be done automatically. If you do not specify an output directory the file will be saved in the same directory as the code.
Next there are three entry fields, these will add the title to the graph, the x-label to the graph and the y-label to the graph respectively. For these just enter the text string that you wish to be displayed on the graph. The output file will be named as [graph_title].png in the directory specified.
Next you can choose between a polynomial fit or custom law fit, just click on whichever one you want and the radio button will change to the one you have clicked.
If you are using a polynomial fit then the next thing to specify is the highest power of x you want to fit the graph to. For example if you wanted to fit a quartic graph just type the number 4 in and it will fit a graph in the style ax^4+bx^3+cx^2+dx+e. If you want to get the gradient of the fit at a specifica x value then type this x value in the entry field below. For example if you want the gradient at x=5 just type 5 in this box. Only do this if you are fitting a graph that is not linear as a linear graph will give the gradient of the whole line by default.
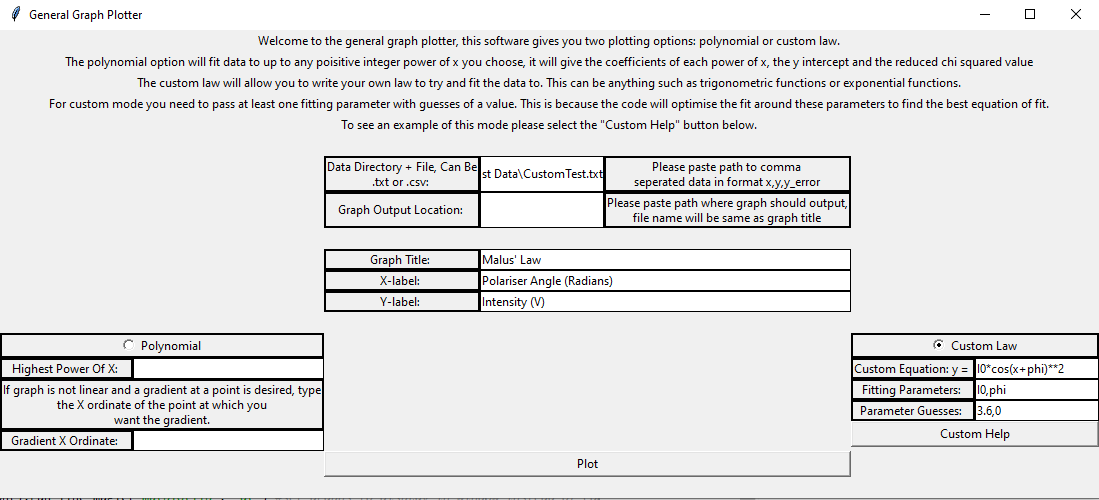
If you are using the custom law fit you instead need to specify an equation to fit to. If you do not understand how to do this then click the custom help button below for more detailed information and a video outlining how to do this or see the image above. The equation already has y= which can be seen in the label, therefore you just need to type an expression in terms of x in the entry field. An example can be seen above for Malus' law. Next some fitting parameters need to be specified, these are constants that the code is allowed to adjust for optimising the fit. It can be seen that this example uses I0 and phi for the fitting parameters. In the experiment I0 was a value of light intensity (as a voltage reaction) without any polariser in front which was measured to be 3.6V hence a guess value was put in as 3.6. There was no predicted phase shift in the values so a phase shift parameter was put in with a guess value of 0. The guess values do not need to be exact, as long as they are in similar order of magnitudes to the true values. You will be able to tell from the graphs if it has not optimised far enough as the fitting line will be too far from the data, if you over estimated your parameter it could be above the data and if you underestimated it could be below so you will know which way the guess needs adjusting. It is unlikely you will be far enough away to require this.
When you press the plot button if there is anything wrong with the inputs you have specified you will get an error mesaage explaining why it has not worked and how you could fix it. If you have no errors then the graph will plot and display in a new window. The graph will be interactive, if you only want to focus on a certain range you can enhance it using the buttons at the top of the graph window to interact with it. This graph has been automatically saved to the output directory specified earlier, if you want a copy of zoomed in or edited range then when the graph is how you want it you can press save at the top of the graph window to get a copy of that version. If you look back to the main window after plotting a graph all of the fitting parameters will now be listed below the plot button and can be written down to go with the corresponding graph.
Three test data files have been included to practice using this code with, one of these is made up linear data, one of these is made up quadratic data and one of these is real custom mode data. The real custom data is fit with Malus' law as shown in the images above.
Advanced styling options are a new trial feature where the user can enter some extra styling options for their displayed graphs. These are not yet fully error handled so if your graph fails to plot after using them you have entered an advanced option incorrectly. All but one of these has links to documentation to find available options for that styling parameter, the one that doesn't just takes a number as input for a marker size. No documentation is available for this hence the lack of a link.


