Code Monkey home page Code Monkey logo

noaastn's Introduction

noaastn

Buildbadge codecov Deploy Documentation Status

The US National Oceanic and Atmospheric Administration (NOAA) collects and provides access to weather data from land-based weather stations within the US and around the world (Land-Based Station Data). One method for accessing these data is through a publicly accessible FTP site. This package allows users to easily download data from a given station for a given year, extract several key weather parameters from the raw data files, and visualize the variation in these parameters over time. The weather parameters that are extracted with this package are:

  • Air Temperature (degrees Celsius)
  • Atmospheric Pressure (hectopascals)
  • Wind Speed (m/s)
  • Wind Direction (angular degrees)

Installation

This package can be installed from TestPyPI by running the following command in a terminal

pip install --index-url https://test.pypi.org/simple/ --extra-index-url https://pypi.org/simple noaastn

Features

  • get_stations_info:
    • This function downloads and cleans the data of all stations available at ftp://ftp.ncei.noaa.gov/pub/data/noaa/
  • get_weather_data:
    • This function loads and cleans weather data for a given NOAA station ID and year. It returns a dataframe containing a time series of air temperature, atmospheric pressure, wind speed, and wind direction.
  • plot_weather_data:
    • This function visualizes the weather station observations including air temperature, atmospheric pressure, wind speed, and wind direction changing over time.

Dependencies

The list of the dependencies for this package can be viewed under [tool.poetry.dependencies] in pyproject.toml

Related Packages

There are few packages in the python ecosystem like noaa, noaa-coops, noaa-sdk that do analysis related to NOAA weather station data. These tools are more focused on using the NOAA's API service to obtain forecast information. They do not provide an interface to obtain historical weather data from the NOAA's FTP site, process and visualize key weather parameters like this package does.

Usage

Typical usage will begin with downloading the list of available weather stations in the country of interest using the get_stations_info() function. A dataframe is returned which can be reviewed to find a suitable station in the area of interest. Alternatively, the NOAA provides a graphical interface for exploring the available weather stations.

>>> from noaastn import noaastn
>>> noaastn.get_stations_info(country = "US")

Tabular output from get_stations_info function

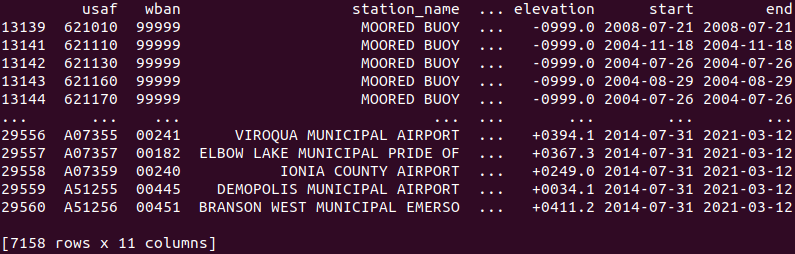
After selecting a weather station number, the get_weather_data() function can be used to download various weather parameters for the station number and year of interest. NOAA stations are specified using two ID codes: the USAF station ID and the NCDC WBAN number. The station_number argument must have the form '-', both of which can be found in the table returned by get_stations_info() (if a WBAN ID does not exist, a value of '99999' should be used in its place). The following usage example downloads weather data from station number "911650-22536" for the year 2020 and saves the data to a variable called 'weather_data'. 'weather_data' will be a data frame containing a time series of the following parameters for the station and year of interest:

  • air temperature (degrees Celsius)
  • atmospheric pressure (hectopascals)
  • wind speed (m/s)
  • wind direction (angular degrees)
>>> weather_data = noaastn.get_weather_data("911650-22536", 2020)
>>> print(weather_data)

Tabular output from get_weather_data function

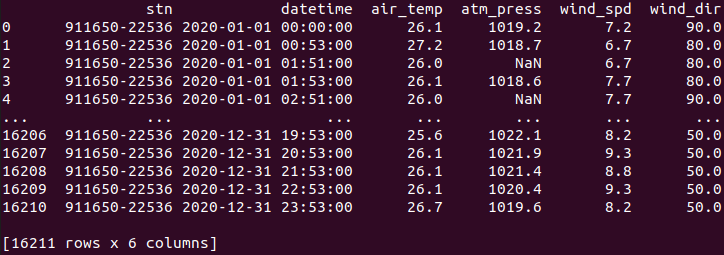
The function plot_weather_data() can be used to visualize a time series of any of the available weather parameters either on a mean daily or mean monthly basis. The function returns an Altair chart object which can be saved or displayed in any environment which can render Altair objects.

>>> noaastn.plot_weather_data(weather_data, col_name="air_temp", time_basis="monthly")

Altair chart with time series of air temperature

Documentation

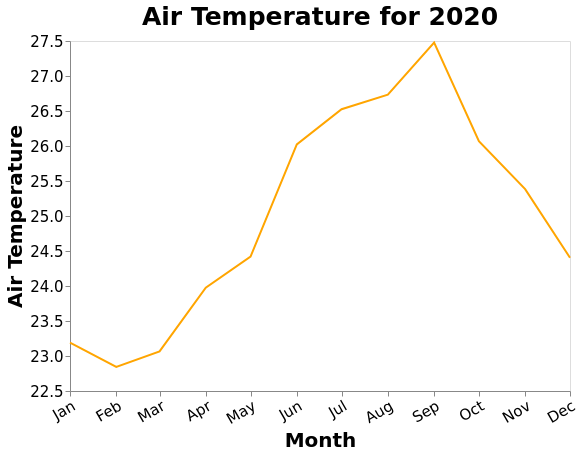
Documentation for this package can be found on Read the Docs

Contributors

We welcome and recognize all contributions. You can see a list of current contributors in the contributors tab. The package was originally developed by Chen Zhao, Chirag Rank, and Steffen Pentelow.

Credits

This package was created with Cookiecutter and the UBC-MDS/cookiecutter-ubc-mds project template, modified from the pyOpenSci/cookiecutter-pyopensci project template and the audreyr/cookiecutter-pypackage.

noaastn's People

Contributors

actions-user avatar chenzhao2020 avatar chiragrank avatar spentelow avatar

Stargazers

 avatar  avatar  avatar

Watchers

 avatar

noaastn's Issues

Rename functions

  • get_data() --> get_stations_info()
  • processed_data() --> get_weather_data()
  • plot_data() --> plot_weather_data()

build.yml

Your task here is to make sure the workflow in .github/workflows/build.yml is correctly configured so that at a minimum, it runs the test suite and style checkers on pushes and pull requests to your project's repository's deployment branch (typically the main branch). At time of submission, we expect that your project successfully runs this workflow.

A couple things you might need to change in your .github/workflows/build.yml file:

Ensure the deployment branch (typically the main branch) is correctly specified on lines 7 & 10

Ensure that the correct Python version is listed on lines 21 and 24 (it should match the version in your pyproject.toml file)

Package Review Suggestion For plot_weather_data

def plot_weather_data(obs_df, col_name, time_basis):
    """
    Visualizes the weather station observations including air temperature,
    atmospheric pressure, wind speed, and wind direction changing over time.
    Parameters
    ----------
    obs_df : pandas.DataFrame
        A dataframe that contains a time series of weather station
        observations.
    col_name : str
        Variables that users would like to plot on a timely basis,
        including 'air_temp', 'atm_press', 'wind_spd', 'wind_dir'
    time_basis : str
        The users can choose to plot the observations on 'monthly' or
        'daily basis'
    Returns
    -------
    altair.vegalite.v4.api.Chart
        A plot can visualize the changing of observation on the timely basis
        that user chooses.
    Examples
    --------
    >>> plot_weather_data(obs_df, col_name="air_temp", time_basis="monthly")
    """

    # Test input types
    assert (
        type(obs_df) == pd.core.frame.DataFrame
    ), "Weather data should be a Pandas DataFrame."
    assert type(col_name) == str, "Variable name must be entered as a string"
    assert type(time_basis) == str, "Time basis must be entered as a string"
    # Test edge cases
    assert col_name in [
        "air_temp",
        "atm_press",
        "wind_spd",
        "wind_dir",
    ], "Variable can only be one of air_temp, atm_press, wind_spd or wind_dir"
    assert time_basis in [
        "monthly",
        "daily",
    ], "Time basis can only be monthly or daily"

    df = obs_df.dropna()
    assert (
        len(df.index) > 2
    ), "Dataset is not sufficient to visualize"  # Test edge cases
    year = df.datetime.dt.year[0]

    title_dic = {"air_temp": "Air Temperature",
                 "atm_press": "Atmospheric Pressure",
                 "wind_spd": "Wind Speed",
                 "wind_dir": "Wind Direction"}
    
    if time_basis == "monthly":
        df = df.set_index("datetime").resample("M").mean().reset_index()
        assert (
            len(df.index) > 2
        ), "Dataset is not sufficient to visualize"  # Test edge cases
        
        line = (
                alt.Chart(df, title= title_dic[col_name] + " for " + str(year))
                .mark_line(color="orange")
                .encode(
                    alt.X(
                        "month(datetime)",
                        title="Month",
                        axis=alt.Axis(labelAngle=-30),
                    ),
                    alt.Y(
                        col_name,
                        title=title_dic[col_name],
                        scale=alt.Scale(zero=False),
                    ),
                    alt.Tooltip(col_name),
                )
            )        

    else:
        df = df.set_index("datetime").resample("D").mean().reset_index()
        assert (
            len(df.index) > 2
        ), "Dataset is not sufficient to visualize"  # Test edge cases

        line = (
                alt.Chart(df, title= title_dic[col_name] + " for " + str(year))
                .mark_line(color="orange")
                .encode(
                    alt.X(
                        "datetime", title="Date", axis=alt.Axis(labelAngle=-30)
                    ),
                    alt.Y(
                        col_name,
                        title=title_dic[col_name],
                        scale=alt.Scale(zero=False),
                    ),
                    alt.Tooltip(col_name),
                )
            )

    chart = (
        line.properties(width=500, height=350)
        .configure_axis(labelFontSize=15, titleFontSize=20, grid=False)
        .configure_title(fontSize=25)
    )

    return chart

Team work contract

  • Create a team-work contract that outlines how we are committed to work together so that we are accountable to one another
  • Save it as google doc and remember to copy in the submission to Canvas

deploy.yml

Your task here is to make sure the workflow in .github/workflows/deploy.yml is correctly configured so it runs the test suite, style checkers and deplys to package to test PyPI on pushes to your project's repository's deployment branch (typically the main branch). At time of submission, we expect that your project successfully runs this workflow. This should be evidenced by a green release button on your package repository's README.

A couple things you might need to change in your .github/workflows/deploy.yml file:

Ensure the deployment branch (typically the main branch) is correctly specified on lines 7

Ensure that the correct Python version is listed on line 14 (it should match the version in your pyproject.toml file)

process_data() function

  • Set-up empty function with appropriate function name and arguments as discussed
  • Write function documentation

Create project structure for the Python project

  • We have created the project structure for this python project and pushed it as a public repository in the UBC-MDS organization on Github.com

  • The contributors' names are shared in the Contributors section of README.md file

  • Need to review 'CONDUCT' and 'CONTRIBUTING' file to make sure it adapts with appropriate attributions

  • Need to finish 'README.md' file

Documentation

Your package documentation should be very clear by the end of this milestone and deployed by ReadTheDocs. All docstrings for all functions should be rendered using the napolean Sphinx extnesion and readable on ReadTheDocs. Your documentation should also include a demonstration of how to use each function in the package, so that any user with minimal Python expertise would be able to run your package functions and play around with them.

Pick a topic

  • We come up with a topic to develop a python package that downloads, processes and visualizes weather data from NOAA website
  • We have discussed the topic with the instructor and got approved

Manage issues

  • Remember to assign each issue of each function to a single person on the team after add every team member as contributor to this project
  • Create project boards and milestones

Pick a topic

  • Come up with a topic for your project.

  • Discuss the topic with your TA or lab instructor and proceed only after your topic has been approved by one of them.

Recommend Projects

  • React photo React

    A declarative, efficient, and flexible JavaScript library for building user interfaces.

  • Vue.js photo Vue.js

    ๐Ÿ–– Vue.js is a progressive, incrementally-adoptable JavaScript framework for building UI on the web.

  • Typescript photo Typescript

    TypeScript is a superset of JavaScript that compiles to clean JavaScript output.

  • TensorFlow photo TensorFlow

    An Open Source Machine Learning Framework for Everyone

  • Django photo Django

    The Web framework for perfectionists with deadlines.

  • D3 photo D3

    Bring data to life with SVG, Canvas and HTML. ๐Ÿ“Š๐Ÿ“ˆ๐ŸŽ‰

Recommend Topics

  • javascript

    JavaScript (JS) is a lightweight interpreted programming language with first-class functions.

  • web

    Some thing interesting about web. New door for the world.

  • server

    A server is a program made to process requests and deliver data to clients.

  • Machine learning

    Machine learning is a way of modeling and interpreting data that allows a piece of software to respond intelligently.

  • Game

    Some thing interesting about game, make everyone happy.

Recommend Org

  • Facebook photo Facebook

    We are working to build community through open source technology. NB: members must have two-factor auth.

  • Microsoft photo Microsoft

    Open source projects and samples from Microsoft.

  • Google photo Google

    Google โค๏ธ Open Source for everyone.

  • D3 photo D3

    Data-Driven Documents codes.