Comments (4)
 twopirllc
commented on May 13, 2024
twopirllc
commented on May 13, 2024
Hello @ajmal017,
Thanks for checking out Pandas TA!
If you do not like using TA Lib's implementation of ema which begins with an sma, you can easily disable it by passing in the keyword argument sma=False into ema like so: ema15 = ta.ema(close, length=15, sma=False).
If you are curious about how to use any Pandas TA indicator, just do: help(ta.indicator) for more specific options or calculation adjustments. For further details on how to use Pandas TA, please check out the README.
How can we get this thing done
If any of the indicators are incorrectly calculated, feel free to make adjustments to your fork. Please note, if the indicator also exists in TA Lib, make sure that the output is at least 90% correlated, preferably 99% correlated, with TA Lib before submitting a pull request as well as your corrected rendition as an additional keyword argument for the indicator. If the indicator in question has no corresponding indicator in TA Lib, then all you need to do is submit a pull request.
I look forward to our collaboration and your submissions to help making Pandas TA a better TA Library for the Python community!
Thanks!
KJ
from pandas-ta.
twopirllc
commented on May 13, 2024
Hello @ajmal017,
Curious if you have tried the following regarding ema?
ema15 = ta.ema(close, length=15, sma=False)
Thanks,
KJ
from pandas-ta.
 webclinic017
commented on May 13, 2024
webclinic017
commented on May 13, 2024
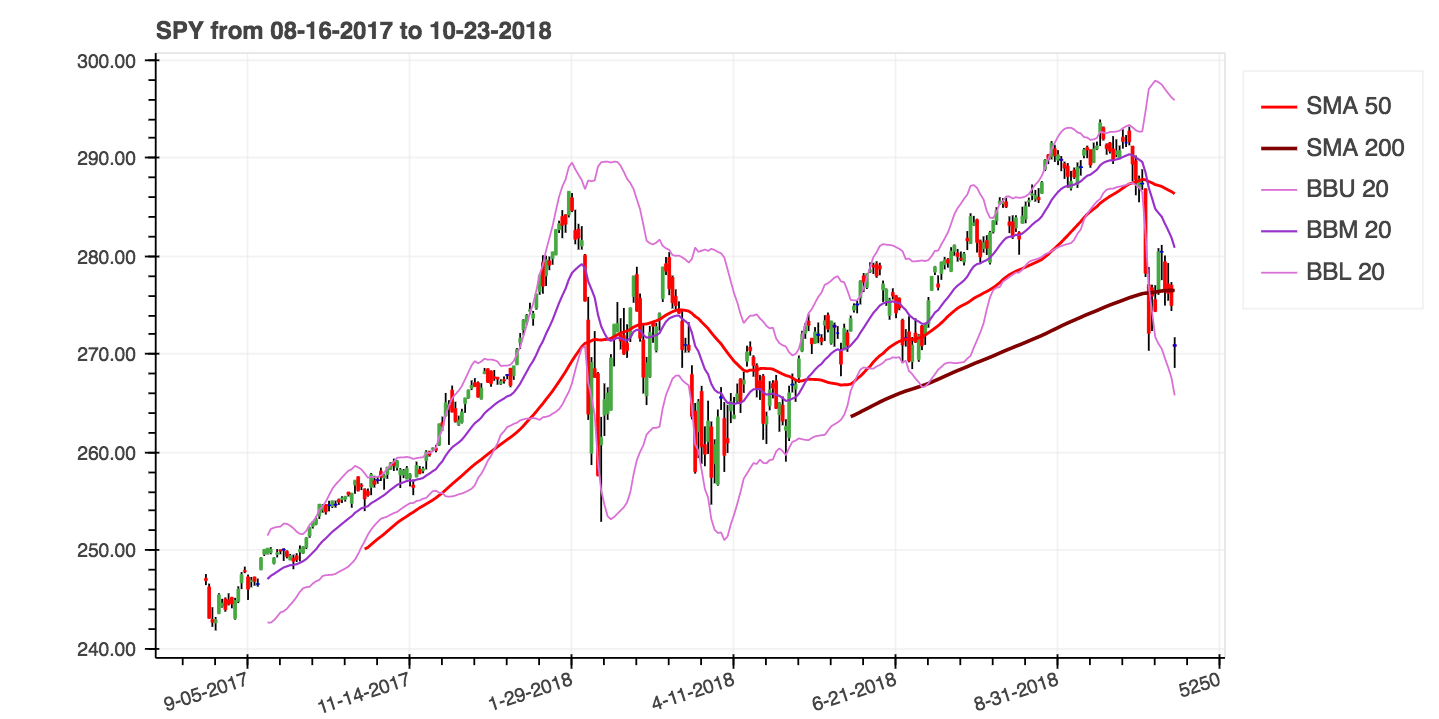
I felt the question was misunderstood, it wasnt about any error or any wrong calculation - its about displaying all variables in a chart in a full way.. https://raw.githubusercontent.com/twopirllc/pandas-ta/master/images/TA_Chart.png take for example this image, the 200 MA is display after 200 days in the chart, so is bands etc - to display rightly in a chart, we usually take backward data to calculate the SMA but display from the date asked.. was wanting to know if anyone has done this or any guidance on it..
user wants from 1-1-2020 but asks for 20 day MA - the data is taken from 10-12-2019 and calculated to display MA from start in chart and display from 1-1-2020

from pandas-ta.
twopirllc
commented on May 13, 2024
I felt the question was misunderstood, ...
Your original post, did not have a question.
This is a Technical Analysis Library, not a charting library. There are plenty of Data Source APIs, Analysis and Backtesting Libraries, Charting Libraries, ML/AI Frameworks and Brokerage APIs required/needed to build an Algo Trading Platform. This is just one component, not two or more, of the pipeline that many traders and investors rely upon and use. As such, it is up to the user to display charts to their liking and specifications.
It appears that your real issue is with an example chart displaying it's resultant calculations. It is only an example, it shows that SMA and Bollinger Bands are calculating properly because there is no data for values less than it's period of calculation. The SMA200 will not have any data for those first 200 periods, likewise the first 20 periods for Bollinger Bands. Why is that an issue? 🤷♂️ Here are some Matplotlib Charts without the period gaps. I have been planning to update the Example Charts in the README anyhow after adding some more indicators.
I spend considerable free time to produce an easy to use Open Source Technical Analysis library that is comparable to other de facto Open Source TA Libraries plus other features not commonly found in other libraries. With the rest of my non-existent free time, I am building out the other components of the pipeline for my own Algo Trading Platform. So I would greatly appreciate if future issues are related to adding or improving indicators.
Thank you,
KJ
from pandas-ta.
Related Issues (20)
- how to use it ? HOT 1
- Simple bug on downloading data using example Backtesting with vectorbt HOT 4
- Having trouble attempting to "import pandas_ta as ta" HOT 2
- NATR in non TA-lib mode HOT 1
- How To Test TMO Indicator HOT 8
- Adjusted Close vs Close HOT 4
- Pythonv3.12 support HOT 2
- Indicators using moving averages variable does not pass kwargs to ma(mamode, close, length=length) HOT 1
- Attribute error when I remove a specific group from dataframe HOT 2
- Fix for RMA - adjust=False
- natr behaves the same as atr(percent=True)
- ta.cci returns entire original dataframe if there aren't enough rows for the period value HOT 1
- outstanding tickets for next release? HOT 3
- Weird behaviour in RSI moment indicator on development branch HOT 9
- Failing tests HOT 3
- EVERYONE: Removing the 'fillna' keyword option if there is no opposition!
- can you support smc/bos/choch smart money indicator HOT 2
- The Jurik Moving Average (JMA) is a proprietary indicator, How likely is it to be close to the actual implementation as it looks quite like a closely guarded secret? HOT 4
- Discripency Between Yahoo Finance and Panda's TA in Accumulation/Distribution Indicator HOT 1
- StochRSI on development branch HOT 3
Recommend Projects
-
 React
React
A declarative, efficient, and flexible JavaScript library for building user interfaces.
-
Vue.js
🖖 Vue.js is a progressive, incrementally-adoptable JavaScript framework for building UI on the web.
-
 Typescript
TypeScript is a superset of JavaScript that compiles to clean JavaScript output.
-
TensorFlow
An Open Source Machine Learning Framework for Everyone
-
Django
The Web framework for perfectionists with deadlines.
-
 Laravel
A PHP framework for web artisans
-
D3
Bring data to life with SVG, Canvas and HTML. 📊📈🎉
-
Recommend Topics
-
javascript
JavaScript (JS) is a lightweight interpreted programming language with first-class functions.
-
web
Some thing interesting about web. New door for the world.
-
server
A server is a program made to process requests and deliver data to clients.
-
Machine learning
Machine learning is a way of modeling and interpreting data that allows a piece of software to respond intelligently.
-
Visualization
Some thing interesting about visualization, use data art
-
Game
Some thing interesting about game, make everyone happy.
Recommend Org
-
Facebook
We are working to build community through open source technology. NB: members must have two-factor auth.
-
Microsoft
Open source projects and samples from Microsoft.
-
Google
Google ❤️ Open Source for everyone.
-
Alibaba
Alibaba Open Source for everyone
-
D3
Data-Driven Documents codes.
-
Tencent
China tencent open source team.
from pandas-ta.