![]()
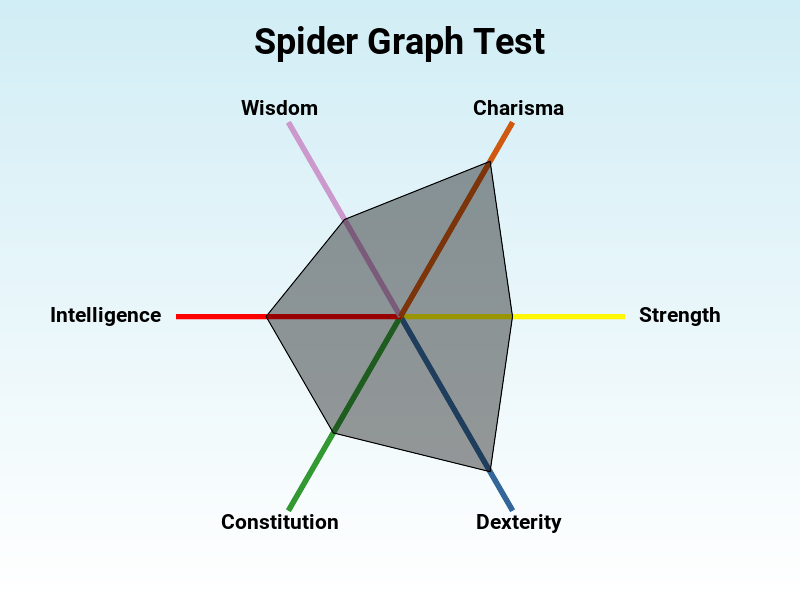
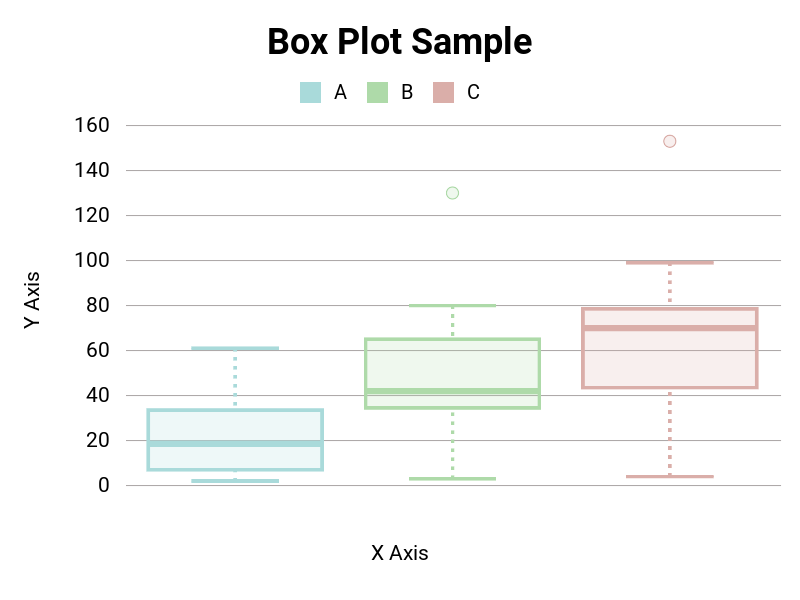
A library for making beautiful graphs.
Built on top of rmagick; see its web page for a list of the system-level prerequisities (ImageMagick etc) and how to install them.
Add this line to your application's Gemfile:
gem 'gruff'And then execute:
$ bundleOr install it yourself as:
$ gem install gruffGruff uses Roboto font as default font which is licensed under the Apache License, Version 2.0.
require 'gruff'
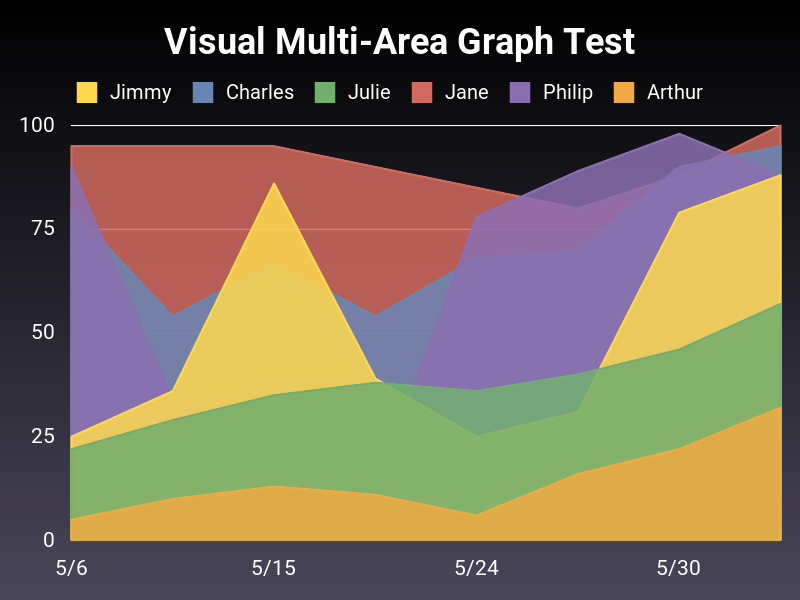
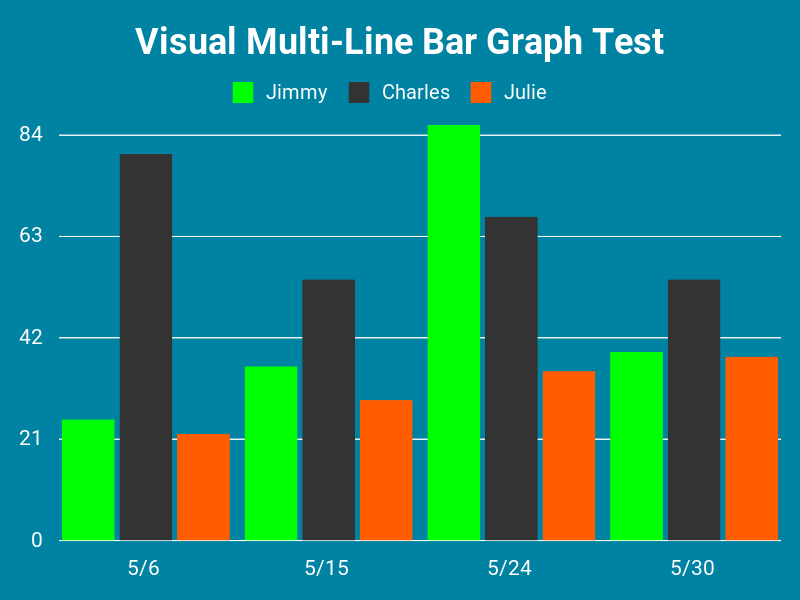
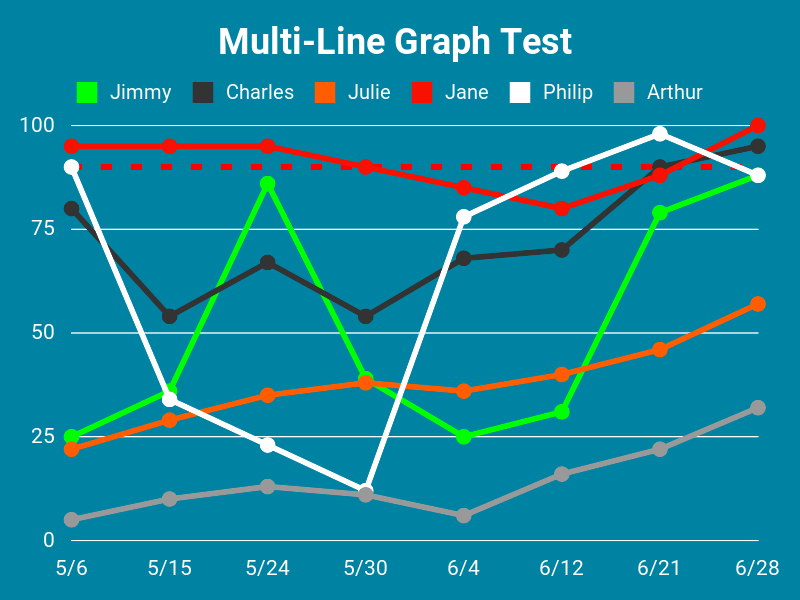
g = Gruff::Line.new
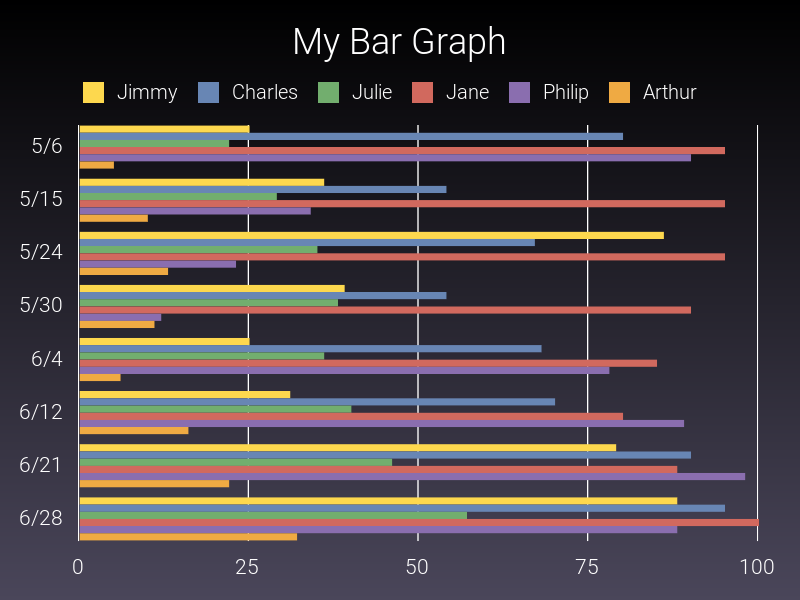
g.title = 'Wow! Look at this!'
g.labels = { 0 => '5/6', 1 => '5/15', 2 => '5/24', 3 => '5/30', 4 => '6/4',
5 => '6/12', 6 => '6/21', 7 => '6/28' }
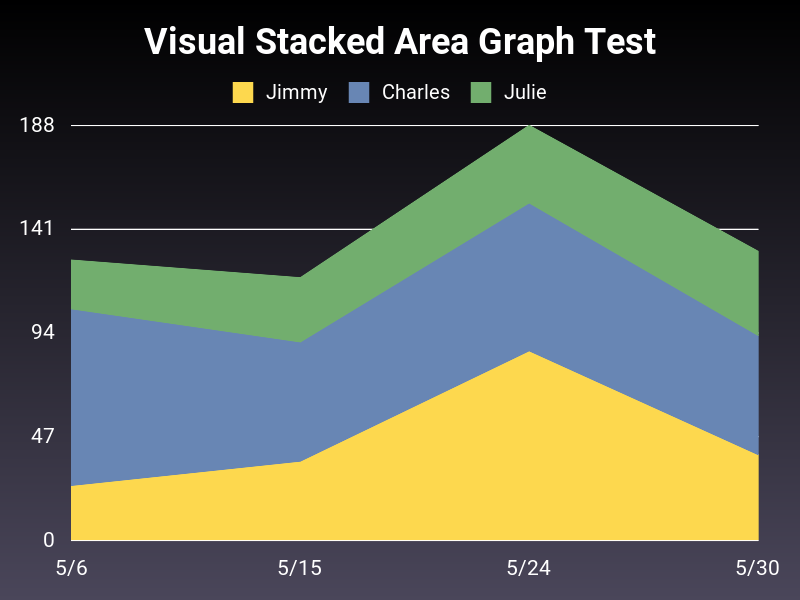
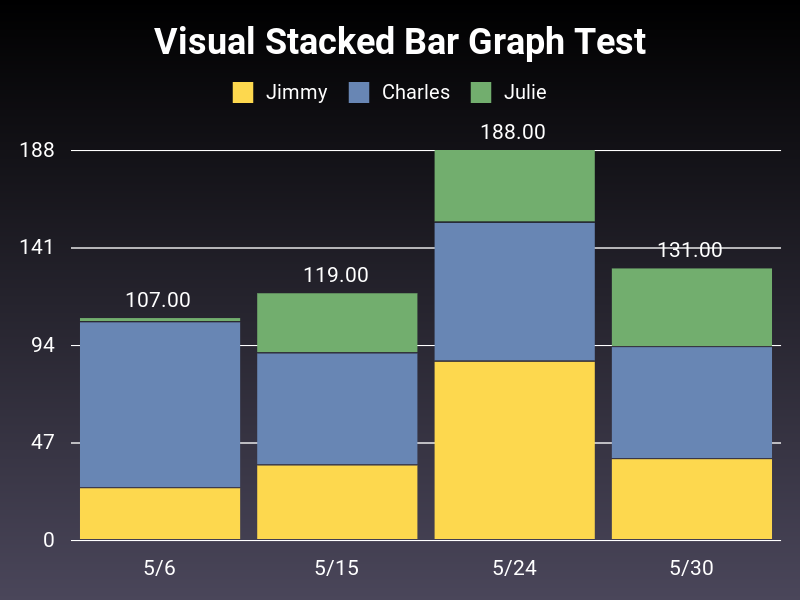
g.data :Jimmy, [25, 36, 86, 39, 25, 31, 79, 88]
g.data :Charles, [80, 54, 67, 54, 68, 70, 90, 95]
g.data :Julie, [22, 29, 35, 38, 36, 40, 46, 57]
g.data :Jane, [95, 95, 95, 90, 85, 80, 88, 100]
g.data :Philip, [90, 34, 23, 12, 78, 89, 98, 88]
g.data :Arthur, [5, 10, 13, 11, 6, 16, 22, 32]
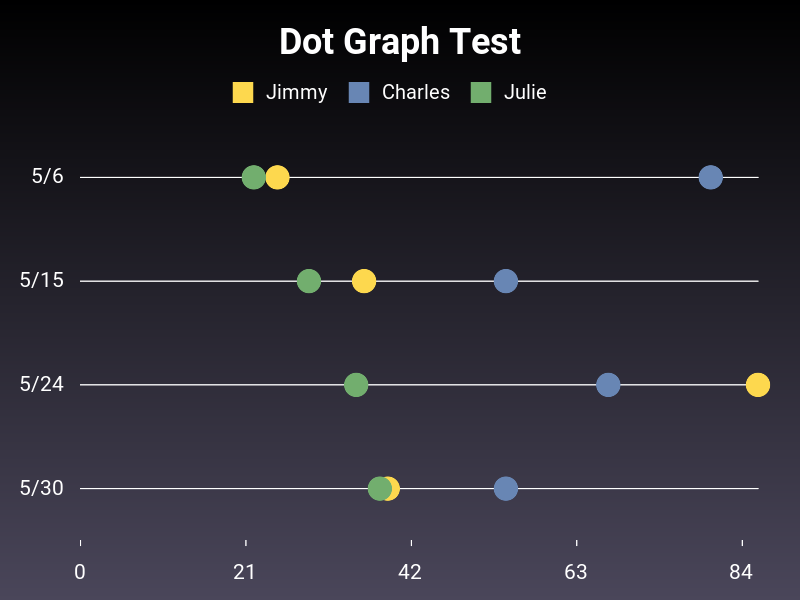
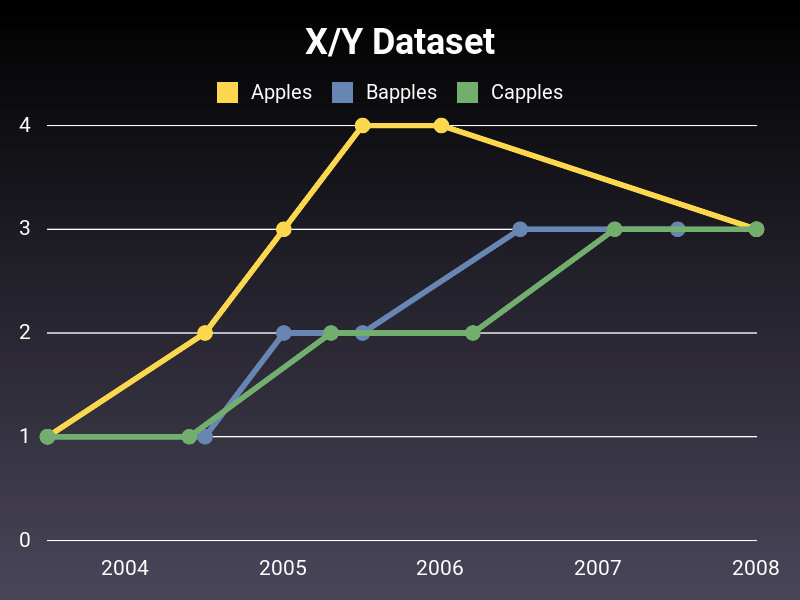
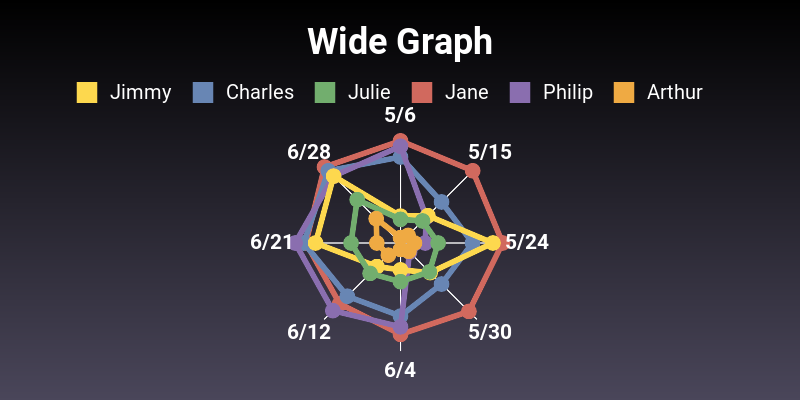
g.write('exciting.png')You can find many examples in the test directory along with their resulting charts in the expected directory.
In progress!
In progress!

http://www.rubydoc.info/github/topfunky/gruff/frames
- Ruby 2.6 or later
- JRuby 9.3.x or later
- Build docker image
$ ./docker-build.sh- Launch docker image
$ ./docker-launch.sh- Run tests
$ bundle exec rakeIf you have made changes that involve updating the expected image, you need to update the image with the following command after running tests.
$ bundle exec rake test:image:updateThe source for this project is now kept at GitHub:
http://github.com/topfunky/gruff
- Fork it
- Create your feature branch (
git checkout -b my-new-feature) - Commit your changes (
git commit -am 'Add some feature') - Push to the branch (
git push origin my-new-feature) - Create new Pull Request


