This project can read csv, text file (in Thai Meteorological Department format) and Upper-Air code to decode and clean or filter data before use template to plot charts and calculate indicators. Skew-t, hodograph, wind brab and indicators use MetPy library (https://pypi.org/project/MetPy/) to make template.
- metpy, numpy, pandas, requests, matplotlib
- Download top_air.py and condition.py to your project folder
- Import file
import top_air as rws[Read Upper-Air in text file]
- Use Upper-Air or pilot data (.txt) to create skew-t ,wind brab and hodograph.
- Read data from text file, It will return to filtered output data as temperature, dew potnt , wind speed , wind direction in list.
CM_SIGLVLS_name = "CM2023111523_SIGLVLS"
souce_file_input = "example_data\\"
dest_file_output = "example_output\\"
P2, T2, Td2, Wd2, Ws2 = rws.rawindsonde_txt(CM_SIGLVLS_name, souce_file_input).data_merge()- Input pressure, temperature, dew point, wind speed ,wind direction to template (use metpy and matplotlib library to make template.)
pilot_txt_vtcc = rws.skew_t_create(P2, T2, Td2, Wd2, Ws2)
pilot_txt_vtcc.plot_skew_t("Output_name_1", dest_file_output, "15-11-2023", "15:23",name_location="Chiang maistaion", size=[14, 8])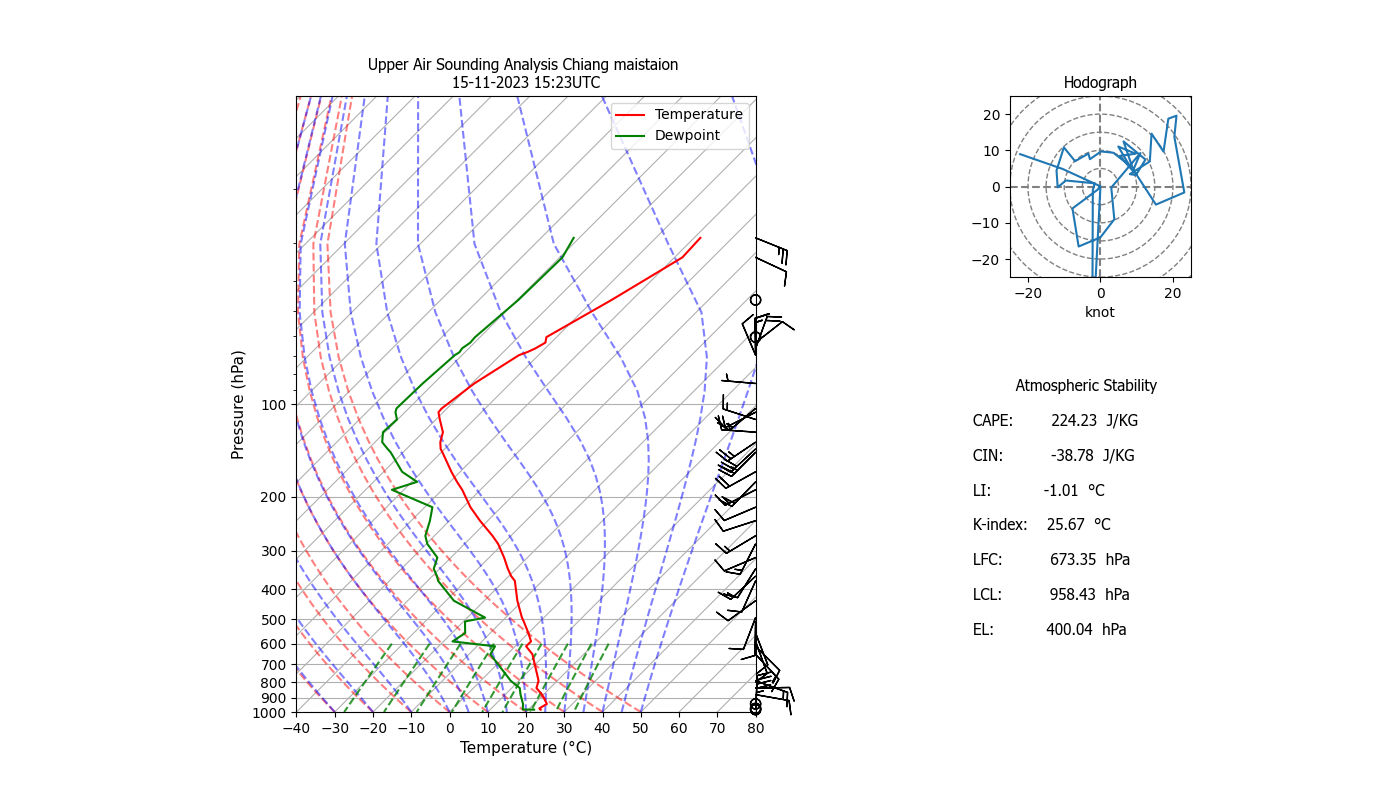
[Select data range]
- You can limit pressure level and make out put data to csv or excel by use parameter just like this code.
P3, T3, Td3, Wd3, Ws3 = rws.rawindsonde_txt(CM_SIGLVLS_name,souce_file_input).data_merge(press_limit=250,type="excel",file_name="excel_output",dest="example_output\\")
pilot_txt_vtcc = rws.skew_t_create(P3, T3, Td3, Wd3, Ws3)- but you should adjust parameter to make ratio template and decorate skew-t chart like this command.
pilot_txt_vtcc.plot_skew_t("Output_name_2", dest_file_output, "15-11-2023", "15:23", name_location="Chiang maistaion",
size=[14, 8],y_limit=200,x_limit=[-20, 40], hodo_color=True,pacel_prof_plot = True,cape_cin_plot = True)
[Read and decode Upper-Air code file]
- Use rawindsonde or pilot code to create skew-t, hodograph.
Code_file_name = "16112566"
Code_file_input = "example_data\\"
pilot_code = rws.rawindsonde_decode(Code_file_name, Code_file_input)
P4, T4, Td4, Pb4, Wd4, Ws4 = pilot_code.data_merge(press_limit=25)- you should add more Pressure brab, wind direction and wind speed to template maker because of data from decoder is separate group.
pilot_code_plt.plot_skew_t("decode_data", "example_output\\", "16-11-2023", "00:00", name_location="title name",
show_skt=False, hodo_itv=[2, 2, 2],press_barb=Pb4, wd_barb=Wd4, ws_barb=Ws4, hodo_color=True, size=[14, 8])
[Read wind profiler file in csv format]
- Use csv from wind profiler to filter and make data template.
CSV_file_name = "20231117_0450"
source_csv_input = "example_data\\"
P5, T5, Td5, Pb5, Wd5, Ws5 = rws.windprofiler_csv(CSV_file_name,source_csv_input).data_merge()

wpfl_csv_vtcc = rws.skew_t_create(P5, T5, Td5, Wd5, Ws5)
wpfl_csv_vtcc.plot_skew_t("wind_profiler_output", "example_output\\", "17-11-2023", "00:00",name_location="Chiang mai",
y_limit=200, show_skt=False,press_barb=Pb5, wd_barb=Wd5, ws_barb=Ws5,brab_itv=[5, 5, 5], x_limit=[-20, 40],
size=[8, 6],hodo_color=True)
- you can use your data from different format file by copy and paste data instead example input file.
Develop by Supaporn Noisen
