This code plots a barplot in R. It loads ggplot2, and calculates the frequency of two categorical variables to plot. xname will be the main variable to be plotted. fillname will be the variable to segment by. The default is prop = FALSE, indicating proportions will not be plotted. Marginal proportions are not offered here. The function takes in a data.table object from the data.table package.
> install.packages("data.table")
> require(data.table)
> x <- data.table(x)
> x
# TechSupport SeniorCitizen
# 1 No 0
# 2 No 0
# 3 Yes 0
# 4 Yes 0
# 5 No 0
# 6 No 0
# 7 No 0
# 8 Yes 0
# 9 No 1
# 10 No 1
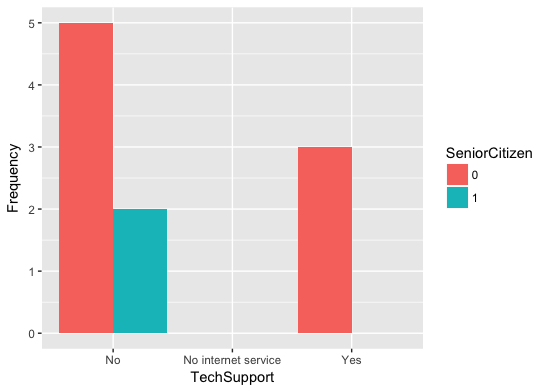
> plot.barplot(x = x, xname = "TechSupport", fillname = "SeniorCitizen")