thedeanlab / navigate Goto Github PK
View Code? Open in Web Editor NEWnavigate - open source light-sheet microscope controls
Home Page: https://thedeanlab.github.io/navigate/
License: Other
navigate - open source light-sheet microscope controls
Home Page: https://thedeanlab.github.io/navigate/
License: Other


Interestingly enough, it does seem that the concurrency tools dependency for threading.excepthook has some strange Python version-specific availability.
3.10.1 - threading.excepthook available
3.9.9 - threading.excepthook available.
3.8.12 - threading.excepthook available.
3.7.12 - Not available!
3.6.15 - Not available!
3.5.9 - Not available!
I believe we are using Python 3.7. Would love to hear what version of Python everyone else has in their environments.
Ultimately, we will likely use a convolution-based particle detection approach to find cells of interest for follow-up imaging. It would be nice to develop a Python or C++ equivalent of a common function used in the Danuser Lab:
https://github.com/DanuserLab/u-track3D/blob/master/software/pointSourceDetection3D.m
The only reason why I mention C++ is the fact that this is typically a slow operation, so perhaps we could call a compiled C++ object. This function, if I recall correctly, does a laplaucian of gaussian convolution, finds the peaks, fits the peaks and evaluates their statistical likelihood, and then only gives back the statistically robust events.
Scikit-Image seems to have most of what we need in the 'blob-log' function.
https://github.com/scikit-image/scikit-image/blob/v0.19.0/skimage/feature/blob.py#L401-L564
@annie-xd-wang - I ran into a strange problem today where it didn't seem like changes that I was making to the experiment configuration in the controller were propagating to the experiment configuration in the model.
Upon closer look, it seems as if we are creating two instances of the experiment and configuration instances, each in the model and experiment. Is there a reason for this?
Thanks,
Kevin
Given that the View is not completely done, it may be a bit early. But at the very least, for organizational purposes, it would be great if we could introduce the sub_gui_controllers as you did in the separate branch. I'm not sure if we can simply merge the branches, but that would be a good project that doesn't require an intimate knowledge of how the microscope is working.
We will also want to populate the camera view tab with a bunch of functionality. This includes:

Related to #20 , more specifically, when injecting negative, large values (e.g., "-10000") in the increments box, one can blow past the "maximum" allowable limits specified (both positive and negative directions)
We need to create a parent class for the analysis module and then going forward the software will decide whether to run on the GPU or CPU depending on the OS.
Need the GUI to display images from the camera. This requires creating a controller and updating both the synthetic and base models for the Camera class. The below task list outlines some of the required tasks, benchmarks and optimizations needed to ensure proper and efficient functionality. Any comments on my process or logic is appreciated and welcome. I don't want to miss anything.
Creating the popup discussed in Slack. It will use the popup base class, going forward you can reuse the code structure for other popups.

When changing the step size, start position, etc., it does not appear to be updating the MicroscopeState dictionary in the experiment module.
Also, if one briefly deletes a value such that the tkinter .get function retrieves an empty string, it throws an error. I tried to put something in there to fix it, but wasn't successful.
Andrew, you are the expert here. I messed with it a bit, but need some help. Perhaps this is something we can knock out today while going over the architecture.
There are several Spinbox and Entry that should not accept random strings but only integer/float numbers. Otherwise, it will trigger some errors in computation functions or even in the model when dealing with devices. I decided to solve this problem in three steps:
Another thing we should do is that we need to add range limits in the configure.yml file.
Right now, the controller can populate settings from model.configuration and model.experiment to the GUI(View), and save the settings to an experiment.yml file when the user chooses to save data. Although I try my best to guess what the field's name is for and make them related to the view, we'd better walk through those files to make sure I didn't miss or mess something.
Opening up this one so that I don't forget. The goal is to incorporate data validation for user inputs to prevent wonky behavior. Widgets will reject bad input or notify users.
Currently we have the different modes of the software. Continuous, Z-Stack, Single Acquisition, and Projection.
For Z-Stack, Single Acquisition, and Projection, the only time the popup bar should occur is if the 'Save Data' button is enabled in the Channels Settings dialog. Otherwise, the data is being acquired and saved in RAM for inspection by the user (e.g., using the maximum intensity projection interface).
For Continuous, it should never pop up but just display the data live in the window.

Add Laser Power Control Option between Laser and Filterwheel in the channels settings. Additionally, add interval function after the exposure time. An example is in slack.
We will also want to populate the camera view tab with a bunch of functionality. This includes:

Hi Kevin, some calculations need to be added to the channels_tab_controller, I have already added the function definition and comments in the file 'src\view\main_window_content\tabs\channels_tab_controller.py'. The function name is 'update_timepoint_setting'. If you need some help, please let me know.
We typically use the module to save images, but we have not been controlling our metadata: https://pypi.org/project/tifffile/
We will need to adopt the proper metadata architecture as specified here: https://docs.openmicroscopy.org/ome-model/5.6.3/ome-tiff/specification.html
According to tifffile, "Numpy arrays can be written to TIFF, BigTIFF, OME-TIFF, and ImageJ hyperstack compatible files in multi-page, volumetric, pyramidal, memory-mappable, tiled, predicted, or compressed form." We will need to look into how we can do this with the proper descriptors in the metadata.
Sensor Mode: Normal Scan or Light-Sheet Mode
if Sensor Mode == Normal Scan
Nothing
if Sensor Mode == Light-Sheet Mode
Readout Direction = Top to Bottom, Bottom to Top, or Bidirectional. Drop down menu.
Number of Pixels = Cycle box.
Originally posted by @AdvancedImagingUTSW in #3 (comment)
Based upon the number of channels selected, the camera exposure time of each channel, and the size of each image stack, we need to calculate the time necessary to acquire a stack for all of the 3 channels.
Thus it will have to figure out how many channels are selected, figure out the number of steps, and the laser cycling mode. If we are set to perZ cycling, we need to provide a finite amount of time for the filter wheel to change between adjacent image slices.
If we are in the perStack mode, then this finite amount of time only needs to be done at the image of each image stack.

When we finally have the image displayed in the view, there are a couple of nice features that we could implement (hopefully).
The first would be for us to be able to double-click a region in the image, and have it determine what distance the stages would need to move laterally, and to then move the stages and position that region in the center of the field of view.
The second would be for us to position the mouse over the window, and then have it adjust the focus of the microscope when we roll the wheel on the mouse.
A potential third is for us to triple-click or right-click on the image, and then perform an autofocus routine. Sampath has coded some metrics that calculate the image sharpness (analysis/contrast.py -> normalized_dct_shannon_entropy()) The goal would be to adjust the focus by some user-specified distance, collect an image, calculate the dct_shannon_entropy, and repeat. You then find the maximum dct_shannon_entropy, and move the stage to that position.
We would like to test the feasibility of doing online or real-time analysis. What is the best architecture to do this? And how best to perhaps leverage GPU speedups. For the latter, I have been working quite a bit with TensorFlow and cucim, and using this should be pretty easy. But moving forward, should we do sub-processes, or threads, or something else?
To start easy, we will do an autofocusing routine. Assume single channel currently, may independently measure focus parameter for each channel in the future.
We can make an autofocus menu item. We also talked about possibly having it be something you can right click on the image canvas for a menu popup?
Select the channel (CH1, CH2, CH3), and we have to select the device we want to adjust. For the low-resolution imaging mode, this is the focus ("F") stage. User must say how many images to acquire, and how far apart?
For example. If we want to adjust F a total range of 50 microns, with 5 micron steps... - 1 stage optimization - We would acquire one image at:
0, 5, 10, 15, 20, 25, 30, 35, 40, 45, 50 = 11 steps. Always an odd number. For each image, we would then calculate the Shannon Entropy of the Discrete Cosine Transform. Then we find the maximum response, and then move the stage to that position...
2-stage optimization. Adjust F for a total range of 500 microns, with 50 micron steps.
0, 50, 100, 150... 500
Find the local maxima, then do a second stage optimization step over 50 microns with 5 micron steps.
Maybe having the option to do both 1 stage or 2 stage optimization would be nice. Your call.
Local maxima detection. Simplest would be to find the index of the maximum response. Or, we could do some sort of curve fitting to find the maximum response. Is the response Gaussian-like with focus. Start with the index, and then move forward with more complex steps in the future.
6x_focus.pdf
model/analysis/image_contrast -> normalized_dct_shannon_entropy()
Need a pop-up window that allows the user to specify the spatial limits of an acquisition. X0, X1, Y0, Y1, Z0, Z1. What the % overlap?
For example, you might want 10% overlap, or 25% overlap. Useful depending upon the sparsity of the thing being imaged.
Pop-up window would come up when the user selects the option in the menu of the Pandastable data object.
Hypothetical 2D case. Calculate the field of view size from the pixel size (6.5 microns), the zoom value (e.g., 1x), and the number of pixels. 2048*6.5/1x = 13.3 mm FOV. If we wanted to image a field of view of 50 mm square, 3.8 images in x and Y, but that isn't accounting for the overlap. 10% overlap. 0,0 -> 12,0 -> 24,0 -> 36,0... 0,12 -> 12,12....
Really we also need to account for tiling in the z dimension. Which we will pull from the stack acquisition settings. If the z-stack is 250 microns thick, 10% overlap would 25 microns.
Attempted to test out the new autofocus mode with the hardware. When trying to acquire continuously, or even collect a single image acquisition, I run into some thread issues:
Please feel free to add ideas here so we can discuss and keep track of a "wishlist" of sorts for widget functionality we want.
We need to arrange the codes of menus to make it work more like a module and add a controller to make the menu work functionally. This includes:
We will need a sub-controller for the ETL popup dialog.
It will need to automatically populate the imaging modes and their respective magnifications. For the low-resolution mode, there is only one magnification. For the high-resolution, there are 0.63x, 1x, 2x, 3x, 4x, 5x, and 6x. I updated the ETL constants file.
The percent duty cycle, duty clcle, etc., will be pulled from the configuration file.
It will also need to enable saving of the ETL parameters once they have been changed.
Let's improve the software responsiveness by properly laying out a threading/sub-module strategy for our devices. Ideally, we want certain functions, like presenting the image to the viewer after each acquisition, to occur in real-time. When the software is too laggy it can be quite difficult to optimize a microscope's configuration and alignment (e.g., changing the focus, adjusting the ETL can, etc..).
We should decide whether or not we want to make the camera as an ObjectInSubprocess, or other items, such as the stage, filter_wheel, etc., as a ResultThread, etc. Once these settings are configured, having some readout for improvement in performance would be reaffirming.
In the camera settings tab we need a drop down menu that will include a sensor mode for light-sheet mode, and normal mode. If in light-sheet mode, have the ability to select from another drop down list for readout direction. Options include top to bottom, bottom to top, and bidirectional. If in light-sheet mode be able to select number of pixels in the rolling shutter. A spinbox with integer steps. In a separate fram have all the ROI info as shown in the slack converstation.
If the user hits acquire in the continuous mode (1 laser, 1 filter position, 1 exposure time):
Get the channel properties (laser, filter wheel, exposure time).
Set laser
Set the filter wheel
Set the exposure time
Prepare the data acquisition card (sends and receives voltages)
Once everything has prepared itself, send out the voltage that triggers the camera.
Grab the image, and display it to the user.
Repeat until the user hits the acquire button again.
Distant goal/idea for the autonomous mode of imaging operation.
The tissues are oddly shaped, so imaging them in a set grid is often a stupid idea (e.g., x0-x1, y0-y1, z0-z1). Thus, we will need an effective way to map out the tissue boundaries in a coarse imaging mode (e.g. with 0.63 or 1x magnification), and then do follow-up imaging at a slightly higher resolution (e.g. 6x magnification). Remember, that the low-resolution arm of the microscope has a motorized zoom servo that can automatically change the magnification of the imaging system.
So, what is the best way to do a search? Perhaps an R-Tree? It is slightly different because we aren't dealing with points, but images, which also need to be analyzed for the presence or absence of tissue.
https://en.wikipedia.org/wiki/R-tree
Couple other interesting ideas here: https://blog.mapbox.com/a-dive-into-spatial-search-algorithms-ebd0c5e39d2a
At some point,, we will have to start thinking about this.
Ensure that all widgets and variables tied to widgets are inside of dicts or arrays so that data can easily be called/passed to the sub-controller modules.
I've noticed that when we launch the software 3 channels are selected by default. If we do not do anything, but acquire a single image, you will notice that it is acquiring only 2 frames, not 3. Then the second time you hit acquire, it collects 3. Not sure what causes this.
One possible feedback mechanism is to use the measured resolution. In such a case, if the resolution falls below some threshold, then we could flag those regions for reanalysis or for automatic optimization of the imaging parameters.
Ideally, this would be performed in a way that is agnostic to the sample characteristics. One method is decorrelation analysis. This could possibly be a nice project for our St. Marks team.
https://github.com/Ades91/ImDecorr
https://www.nature.com/articles/s41592-019-0515-7
One possibility is to try to rewrite the code in a format where the data can be pushed to the GPU (we have 1, and possibly 2 if we want it Titan RTX GPUs). Pyclesperanto is a nice package that makes it easy to use the GPU, and I have had excellent results from it. The other is cupy.
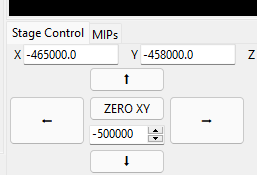
Need to begin calling the position from the physik instrumente device, and populating these values. Likewise, want to be able to connect the buttons to the stage movement functions.

I would like to start to build out the toolbar's functionality.

I think to do this, we should first build out a sub-controller for the toolbar using @annie-xd-wang's format. This will pass the commands to the controller, and be initialized in the controller.
Under File, we would like to be able to load a particular 'experiment' yaml file, and populate the experiment settings in the model. Likewise, we would also like to save an experiment yaml file so that it can be reused later on. We do not have code for saving the experiment, but it should essentially give the user a standard save dialog so that they can choose the name and save location. When the user chooses to load the config, I believe our 'session' class (https://github.com/AdvancedImagingUTSW/ASLM/blob/b9f1583878343670452077cad681f2cfadfb01c7/base/1.0.0/model/aslm_model_config.py)

Under File, we will also provide the opportunity for a user to load images. Just like we had a save dialog to save the experiment, we would give a similar popup window that allows the user to explore the file tree and choose the image that they would like. As we get further along, this will allow the user to load an image, evaluate it using some of the computer vision tools that we will build out.
We can Change 'Edit' to 'Mode'. Two options should be 'Mesoscale' and 'Nanoscale'. This will ultimately decide which shutters to operate, cameras, etc. It will toggle the operation between the left half and the right half of the microscope, which we ultimately hope to do automatically in the future.
The Zoom buttons will need to work properly. In reality, it only influences the operation in the Mesoscale mode. These buttons will interact with the set_zoom function within the DynamixelZoom Device: https://github.com/AdvancedImagingUTSW/ASLM/blob/develop/base/1.0.0/model/devices/zoom/dynamixel/DynamixelZoom.py
The values that we send to this function are located in the model.configuration.ZoomParameters.zoom_position dictionary.
def set_zoom(self, zoom, wait_until_done=False):
"""
Changes zoom after checking that the commanded value exists
"""
if zoom in self.zoomdict:
self._move(self.zoomdict[zoom], wait_until_done)
self.zoomvalue = zoom
else:
raise ValueError('Zoom designation not in the configuration')
if self.verbose:
print('Zoom set to {}'.format(zoom))
ZoomParameters:
#Dynamixel or SyntheticZoom
type: SyntheticZoom
servo_id: 1
COMport: COM21
baudrate: 1000000
zoom_position: {
0.63x: 0,
1x: 627,
2x: 1711,
3x: 2301,
4x: 2710,
5x: 3079,
6x: 3383
}
The GUI will need to be resized to dynamically fit any display size/resolution. For example, because the current setup is static, the acquire bar is not showing up on some displays due to the sizing of the total GUI. This will only be further exacerbated as more dense features are added.
A declarative, efficient, and flexible JavaScript library for building user interfaces.
🖖 Vue.js is a progressive, incrementally-adoptable JavaScript framework for building UI on the web.
TypeScript is a superset of JavaScript that compiles to clean JavaScript output.
An Open Source Machine Learning Framework for Everyone
The Web framework for perfectionists with deadlines.
A PHP framework for web artisans
Bring data to life with SVG, Canvas and HTML. 📊📈🎉
JavaScript (JS) is a lightweight interpreted programming language with first-class functions.
Some thing interesting about web. New door for the world.
A server is a program made to process requests and deliver data to clients.
Machine learning is a way of modeling and interpreting data that allows a piece of software to respond intelligently.
Some thing interesting about visualization, use data art
Some thing interesting about game, make everyone happy.
We are working to build community through open source technology. NB: members must have two-factor auth.
Open source projects and samples from Microsoft.
Google ❤️ Open Source for everyone.
Alibaba Open Source for everyone
Data-Driven Documents codes.
China tencent open source team.