![]()
After collecting multiple experimental results files from a TAM Air calorimeter you will be left with multiple .xls-files obtained as exports from the device control software. To achieve a side by side comparison of theses results and some basic extraction of relevant parameters, TAInstCalorimetry is here to get this done smoothly.
Note: TAInstCalorimetry has been developed without involvement of TA Instruments and is thus independent from the company and its software.
The full documentation can be found here.


Import the tacalorimetry module from TAInstCalorimetry.
# import
import os
from CaloCem import tacalorimetry
Next, we define where the exported files are stored. With this information at hand, a Measurement is initialized. Experimental raw data and the metadata passed in the course of the measurement are retrieved by the methods get_data() and get_information(), respectively.
# define data path
# "mycalodata" is the subfoldername where the calorimetry
# data files (both .csv or .xlsx) are stored

pathname = os.path.dirname(os.path.realpath(__file__))
path_to_data = pathname + os.sep + "mycalodata"

# Example: if projectfile is at "C:\Users\myname\myproject\myproject.py", then "mydata"
# refers to "C:\Users\myname\myproject\mycalodata" where the data is stored

# load experiments via class, i.e. instantiate tacalorimetry object with data
tam = tacalorimetry.Measurement(folder=path_to_data)

# get sample and information
data = tam.get_data()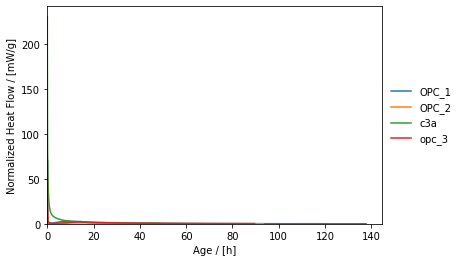
info = tam.get_information()Furthermore, the Measurement features a plot()-method for readily visualizing the collected results.
# make plot
tam.plot()
# show plot
tacalorimetry.plt.show()
Without further options specified, the plot()-method yields the following.
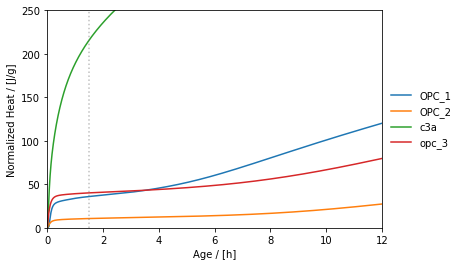
The plot()-method can also be tuned to show the temporal course of normalized heat. On the one hand, this "tuning" refers to the specification of further keyword arguments such as t_unit and y. On the other hand, the plot()-method returns an object of type matplotlib.axes._subplots.AxesSubplot, which can be used to further customize the plot. In the following, a guide-to-the-eye line is introduced next to adjuting the axes limts, which is not provided for via the plot()-method's signature.
# show cumulated heat plot
ax = tam.plot(
    t_unit="h",
    y='normalized_heat',
    y_unit_milli=False
)

# define target time
target_h = 1.5

# guide to the eye line
ax.axvline(target_h, color="gray", alpha=0.5, linestyle=":")

# set upper limits
ax.set_ylim(top=250)
ax.set_xlim(right=6)
# show plot
tacalorimetry.plt.show()
The following plot is obtained:
Additionally, the package allows among others for streamlining routine tasks such as
- getting cumulated heat values,
- identifying peaks positions and characteristics,
- identifying peak onsets,
- Plotting by Category,
- ...
Use the package manager pip to install TAInstCalorimetry.
pip install CaloCemPull requests are welcome. For major changes, please open an issue first to discuss what you would like to change.
Please make sure to update tests as appropriate.
List of contributors:
![]()

