Code Monkey home page Code Monkey logo

grafana-unraid-stack's Introduction

Grafana-Unraid-Stack

Meet Gus! He has everything you need to start monitoring Unraid (Grafana - Influxdb - Telegraf - Loki - Promtail). 1 docker instead of 5+!

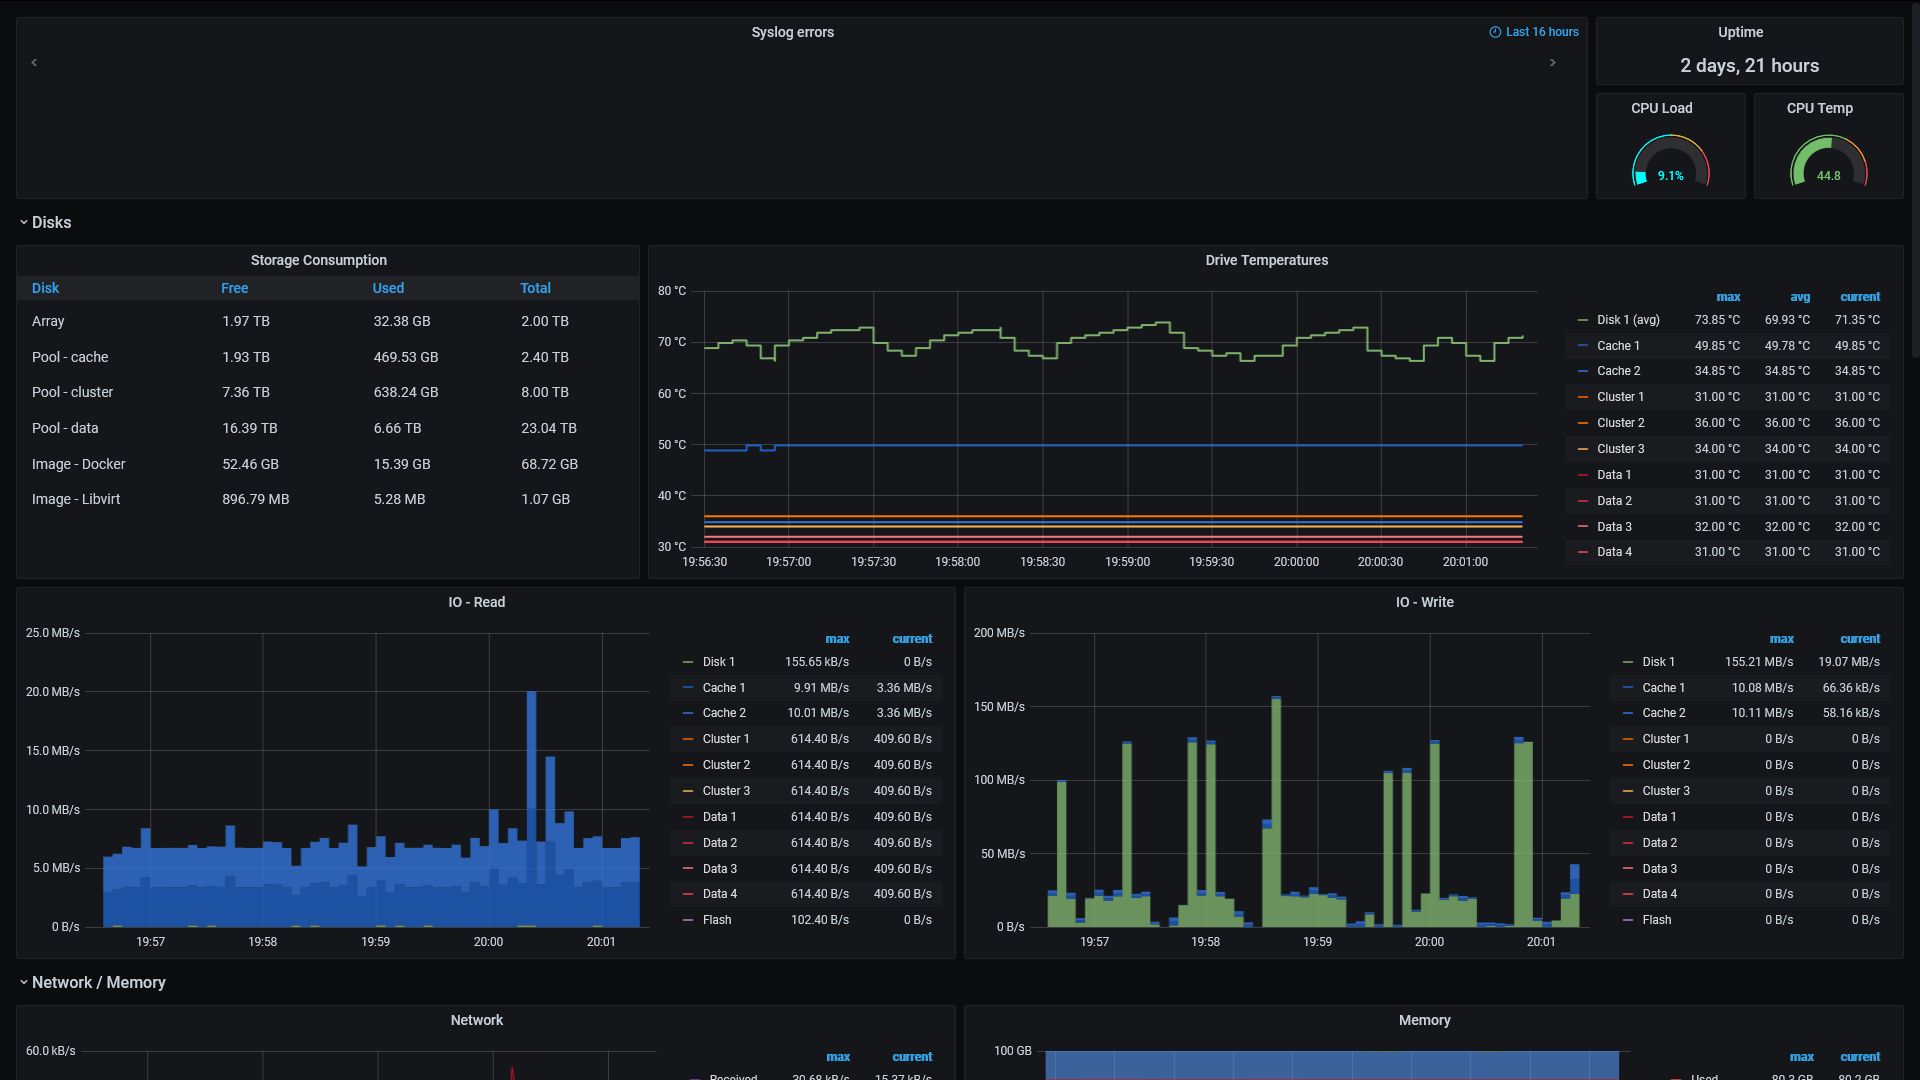
A GUS demo dashboard (preview below) and falconexe's Ultimate UNRAID Dashboard v1.3 (UUD) are included out of the box. Preview

High-level instructions

  • Decide whether you want hddtemp or S.M.A.R.T (smartmontools) and set USE_HDDTEMP variable accordingly.
    • Hint: both GUS and UUD use S.M.A.R.T.
  • Install docker with host network
  • Go to ip:3006 to access grafana, login with admin/admin and make changes as required to fit your system.

Key features

  1. Grafana server. Include both a GUS demo dashboard and falconexe's Ultimate UNRAID Dashboard v1.3.
  2. Influxdb
  3. Telegraf with hddtemp or smartmontools (and ipmitool pre-installed)
  4. Loki + Promtail (so you can now watch your Unraid syslog in the dashboard)

Bits and bobs

  • Use port 3006 because grafana default port 3000 is rather popular among other apps
    • I highly recommend you don't change the port variables unless you know how to deal with various config files. Things are rather tightly integrated.
  • Need to run privileged=true
    • Should be run on "Host" network for max exposure to the server network metrics. You can use bridge if you don't care too much about host network reporting (but remember to map port 3006)
    • The read-only paths are required for Telegraf to report on host devices.
  • Data is separated from config so, for example, you can have the data in RAM so it gets reset after reboot.
  • The included dashboards are intentionally not editable (grafana will tell you it's not possible and provide json). There are 2 ways to save your customization:
    • Save the json file and overwrite the GUS.json / UUD.json at /config/grafana/data/dashboards/.
    • Alternatively, you can copy the json text and import (+ icon -> Import).
  • All s-tag builds after 10 March 2022 is based on Ubuntu LTS (instead of Debian Buster).
  • For more info about Ultinate UNRAID dashboard, please refer to the official thread.
    • Later versions of UUD requires more apps than I yet have time to code for unfortunately.

Usage

docker run -d \
    --name=<container name> \
    --net='host' \
    --privileged=true \
    -v <host path for config>:/config \
    -v <host path for data>:/data \
    -e USE_HDDTEMP=no \
    -e INFLUXDB_HTTP_PORT=8086 \
    -e INFLUXDB_RPC_PORT=58083 \
    -e LOKI_PORT=3100 \
    -e PROMTAIL_PORT=9086 \
    -e GRAFANA_PORT=3006 \
    -v /var/run/utmp:/var/run/utmp:ro \
    -v /var/run/docker.sock:/var/run/docker.sock:ro \
    -v /:/rootfs:ro \
    -v /run/udev:/run/udev:ro \
    -v /sys:/rootfs/sys:ro \
    -v /etc:/rootfs/etc:ro \
    -v /proc:/rootfs/proc:ro \
    -e HOST_PROC=/rootfs/proc \
    -e HOST_SYS=/rootfs/sys \
    -e HOST_ETC=/rootfs/etc \
    -e HOST_MOUNT_PREFIX=/rootfs \
    testdasi/grafana-unraid-stack:<tag>

Unraid example

docker run -d \
    --name='Grafana-Unraid-Stack' \
    --net='host' \
    --privileged=true \
    -v '/mnt/user/appdata/Grafana-Unraid-Stack/config':'/config':'rw' \
    -v '/mnt/user/appdata/Grafana-Unraid-Stack/data':'/data':'rw' \
    -e 'USE_HDDTEMP'='no' \
    -e 'INFLUXDB_HTTP_PORT'='8086' \
    -e 'INFLUXDB_RPC_PORT'='58083' \
    -e 'LOKI_PORT'='3100' \
    -e 'PROMTAIL_PORT'='9086' \
    -e 'GRAFANA_PORT'='3006' \
    -v '/':'/rootfs':'ro' \
    -v '/etc':'/rootfs/etc':'ro' \
    -v '/proc':'/rootfs/proc':'ro' \
    -v '/sys':'/rootfs/sys':'ro' \
    -v '/var/run/docker.sock':'/var/run/docker.sock':'ro' \
    -v '/var/run/utmp':'/var/run/utmp':'ro' \
    -v '/run/udev':'/run/udev':'ro' \
    -e 'HOST_ETC'='/rootfs/etc' \
    -e 'HOST_PROC'='/rootfs/proc' \
    -e 'HOST_SYS'='/rootfs/sys' \
    -e 'HOST_MOUNT_PREFIX'='/rootfs' \
    -e TZ="Europe/London" \
    -e HOST_OS="Unraid" \
    'testdasi/grafana-unraid-stack:stable-amd64'

Notes

  • I code for fun and my personal uses; hence, these niche functionalties that nobody asks for. ;)
  • If you like my work, a donation to my burger fund is very much appreciated.

Donate.

grafana-unraid-stack's People

Contributors

testdasi avatar

Stargazers

 avatar  avatar  avatar  avatar  avatar  avatar  avatar  avatar  avatar  avatar  avatar  avatar  avatar  avatar  avatar  avatar  avatar  avatar  avatar  avatar  avatar  avatar  avatar  avatar  avatar  avatar  avatar  avatar  avatar  avatar  avatar  avatar  avatar  avatar  avatar  avatar  avatar  avatar  avatar  avatar  avatar  avatar  avatar  avatar  avatar  avatar  avatar  avatar  avatar  avatar  avatar  avatar  avatar  avatar  avatar  avatar  avatar  avatar  avatar  avatar  avatar  avatar  avatar  avatar  avatar  avatar  avatar  avatar  avatar  avatar  avatar  avatar  avatar  avatar  avatar  avatar  avatar  avatar  avatar

Watchers

 avatar  avatar  avatar  avatar  avatar

grafana-unraid-stack's Issues

Request: Monitoring capability for kvm

This has been precisely what I'm looking for to keep tabs on container cpu/memory usage. I was using netstat, but the interface is entirely too busy. The only thing that seems to be missing is a way to monitor kvm (specifically cpu and memory by VM). I'm not super familiar with how all of this works, but it appears that it's just not doable right now. I'd love to see it if it's even possible.

All services in s230122 crashed

text error warn system array login

[info] Initialisation started...
[info] influxdb fixed.
[info] loki fixed.
[info] telegraf fixed.
[info] promtail fixed.
[info] grafana fixed.
[info] Initialisation complete

[info] Runing apps...
[info] All done

[error] influxdb crashed!
[error] loki crashed!
[info] Skip hddtemp due to USE_HDDTEMP set to no
[error] telegraf crashed!
[error] promtail crashed!
[error] grafana crashed!

I had a similar issue in the past, when i rolled back to s230122 it was working for quite a while, running on my Unraid Server.
No update has been done from myside, nor any other changes.
Now since a few days everything crashes.

PS: The last time i had the issue, when i fixed it by rolling back i lost all my data i have collected. would appreciate help without losing this data agin :)

influxdb and telegraf crashing after 1/27/23 update

Good morning,

Overall, huge shout out and thank you for creating this...I love the visual view into how the server to doing, and how easy this container made it to setup. After updating this morning, I noticed that it isn't displaying any data (it was fine moments before I updated it), and then noticed that it appears that influxdb and telegraf crashing. Any suggestions on how to fix this? Below is the log.

text error warn system array login

[info] Initialisation started...
[info] influxdb fixed.
[info] loki fixed.
[info] telegraf fixed.
[info] promtail fixed.
[info] grafana fixed.
[info] Initialisation complete

[info] Runing apps...
[info] Run influxdb as service on port 8086
Executable /usr/bin/influxd does not exist!
[info] Run loki as daemon on port 3100
[info] Run telegraf as service
[info] Run promtail as daemon on port 9086
[info] Run grafana as service on port 3006

  • Starting Grafana Server
    ...done.
    [info] All done

[error] influxdb crashed!
[info] loki PID: 60
[info] Skip hddtemp due to USE_HDDTEMP set to no
[error] telegraf crashed!
[info] promtail PID: 75
[info] grafana PID: 91

[info] Initialisation started...
[info] influxdb fixed.
[info] loki fixed.
[info] telegraf fixed.
[info] promtail fixed.
[info] grafana fixed.
[info] Initialisation complete

[info] Runing apps...
[info] Run influxdb as service on port 8086
Executable /usr/bin/influxd does not exist!
[info] Run loki as daemon on port 3100
[info] Run telegraf as service
[info] Run promtail as daemon on port 9086
[info] Run grafana as service on port 3006

  • Starting Grafana Server
    ...done.
    [info] All done

[error] influxdb crashed!
[info] loki PID: 60
[info] Skip hddtemp due to USE_HDDTEMP set to no
[error] telegraf crashed!
[info] promtail PID: 81
[info] grafana PID: 104_

installed plugins not showing in panel.

I am in the process of updating to UIUD 1.6 but I need to install the json datasource plugin. I ran the cli command and it said it downloaded fine I restarted GUS and then it didn't show up when I searched for it in the panel. I check back in cli with the plugins ls command and it indeed does show there but still not in the panel. Any ideas?

Error while installing grafana-unraid-stack

Hey Everyone,

I installed the Docker container on my Unraid.
I became the error:

[warn] influxdb crashed, restarting
/etc/init.d/influxdb: line 114: ulimit: open files: cannot modify limit: Operation not permitted
Unable to set ulimit to 65536 [ FAILED ]

Please help :/

sudden crash how to troubleshoot ?

from one day to the next my stack stopped working i have got no information except the docker logs:
[info] Initialisation started...
[info] influxdb fixed.
[info] loki fixed.
[info] hddtemp fixed.
[info] telegraf fixed.
[info] promtail fixed.
[info] grafana fixed.
[info] Initialisation complete

[info] Runing apps...
[info] All done

[error] influxdb crashed!
[error] loki crashed!
[error] hddtemp crashed!
[error] telegraf crashed!
[error] promtail crashed!
[error] grafana crashed!

how can i fix this ?

Request: Reset Admin Password

Hi, so now it has happened... I've locked out myself from my grafana docker... Is there any way to reset the admin password?
'Cause the official Grafana documentation did not help me anyway...

Healtcheck Failure - File spaming

Hi,

I have the problem that the program is spaming the appdata\Grafana-Unraid-Stack folder with healthcheck-failure files.

Examples:
healthcheck-failure-grafana-at-28.09.2023_145612
healthcheck-failure-influxd-at-28.09.2023_145612
healthcheck-failure-telegraf-at-28.09.2023_145612
healthcheck-failure-grafana-at-28.09.2023_145542
healthcheck-failure-influxd-at-28.09.2023_145542
healthcheck-failure-telegraf-at-28.09.2023_145542
healthcheck-failure-grafana-at-28.09.2023_145512
healthcheck-failure-influxd-at-28.09.2023_145512
healthcheck-failure-telegraf-at-28.09.2023_145512

Every minute 6 files.

How can I solve this problem or disable the healtchecks?
Thanks.

CPU Temp

My attempt to display the CPU temperature was unsuccessful.
What need to change on setting of config for this function on?
screenshot-192 168 31 100_3006-2020 09 29-12_40_13

CVE-2023-4822 vulnerability

This project is currently vulnerable.

"According to its self-reported version number, the version of Grafana Labs running on the remote host is a version 8.0.0 prior to 9.4.17, 9.5.x prior to 9.5.13, 10.0.x prior to 10.0.9 or 10.1.x prior to 10.1.5. It is, therefore, affected by a security bypass vulnerability"

Still crashing on all services on fresh/clean install.

I saw an update was made Nov 21 - but this is still crashing on a fresh install.

Hoping that maybe we can get some momentum going to bring this back to life.

[info] Initialisation started...
[info] influxdb fixed.
[info] loki fixed.
[info] telegraf fixed.
[info] promtail fixed.
[info] grafana fixed.
[info] Initialisation complete

[info] Runing apps...
[info] Run influxdb as service on port 8086
Executable /usr/bin/influxd does not exist!
[info] Run loki as daemon on port 3100
[info] Run telegraf as service
[info] Run promtail as daemon on port 9086
[info] Run grafana as service on port 3006

  • Starting Grafana Server
    ...fail!
    [info] All done

[error] influxdb crashed!
[info] loki PID: 60
[info] Skip hddtemp due to USE_HDDTEMP set to no
[error] telegraf crashed!
[info] promtail PID: 76
[error] grafana crashed!

My appreciation to the maintainer. After spending a few days trying to get this going myself, and finding no other working versions, I know it is difficult to sync up all the versions to run without crashing in a single container.

FYI I don't think it will matter but this was on Unraid Version 6.12.4 2023-08-31.

Recommend Projects

  • React photo React

    A declarative, efficient, and flexible JavaScript library for building user interfaces.

  • Vue.js photo Vue.js

    🖖 Vue.js is a progressive, incrementally-adoptable JavaScript framework for building UI on the web.

  • Typescript photo Typescript

    TypeScript is a superset of JavaScript that compiles to clean JavaScript output.

  • TensorFlow photo TensorFlow

    An Open Source Machine Learning Framework for Everyone

  • Django photo Django

    The Web framework for perfectionists with deadlines.

  • D3 photo D3

    Bring data to life with SVG, Canvas and HTML. 📊📈🎉

Recommend Topics

  • javascript

    JavaScript (JS) is a lightweight interpreted programming language with first-class functions.

  • web

    Some thing interesting about web. New door for the world.

  • server

    A server is a program made to process requests and deliver data to clients.

  • Machine learning

    Machine learning is a way of modeling and interpreting data that allows a piece of software to respond intelligently.

  • Game

    Some thing interesting about game, make everyone happy.

Recommend Org

  • Facebook photo Facebook

    We are working to build community through open source technology. NB: members must have two-factor auth.

  • Microsoft photo Microsoft

    Open source projects and samples from Microsoft.

  • Google photo Google

    Google ❤️ Open Source for everyone.

  • D3 photo D3

    Data-Driven Documents codes.