Code Monkey home page Code Monkey logo

dape's Introduction

Dape - Debug Adapter Protocol for Emacs

GNU ELPA

Dape is a debug adapter client for Emacs. The debug adapter protocol, much like its more well-known counterpart, the language server protocol, aims to establish a common API for programming tools. However, instead of functionalities such as code completions, it provides a standardized interface for debuggers.

To begin a debugging session, invoke the dape command. In the minibuffer prompt, enter a debug adapter configuration name from dape-configs.

For complete functionality, make sure to enable eldoc-mode in your source buffers and repeat-mode for more pleasant key mappings.

Features

  • Batteries included support (describe-variable dape-configs)
  • Log breakpoints
  • Conditional breakpoints
  • Variable explorer
  • Variable watch
  • Variable hover with eldoc
  • REPL
  • gdb-mi.el like interface
  • Memory editor with hexl
  • Integration with compile
  • Debug adapter configuration ergonomics
  • No external dependencies outside of core Emacs

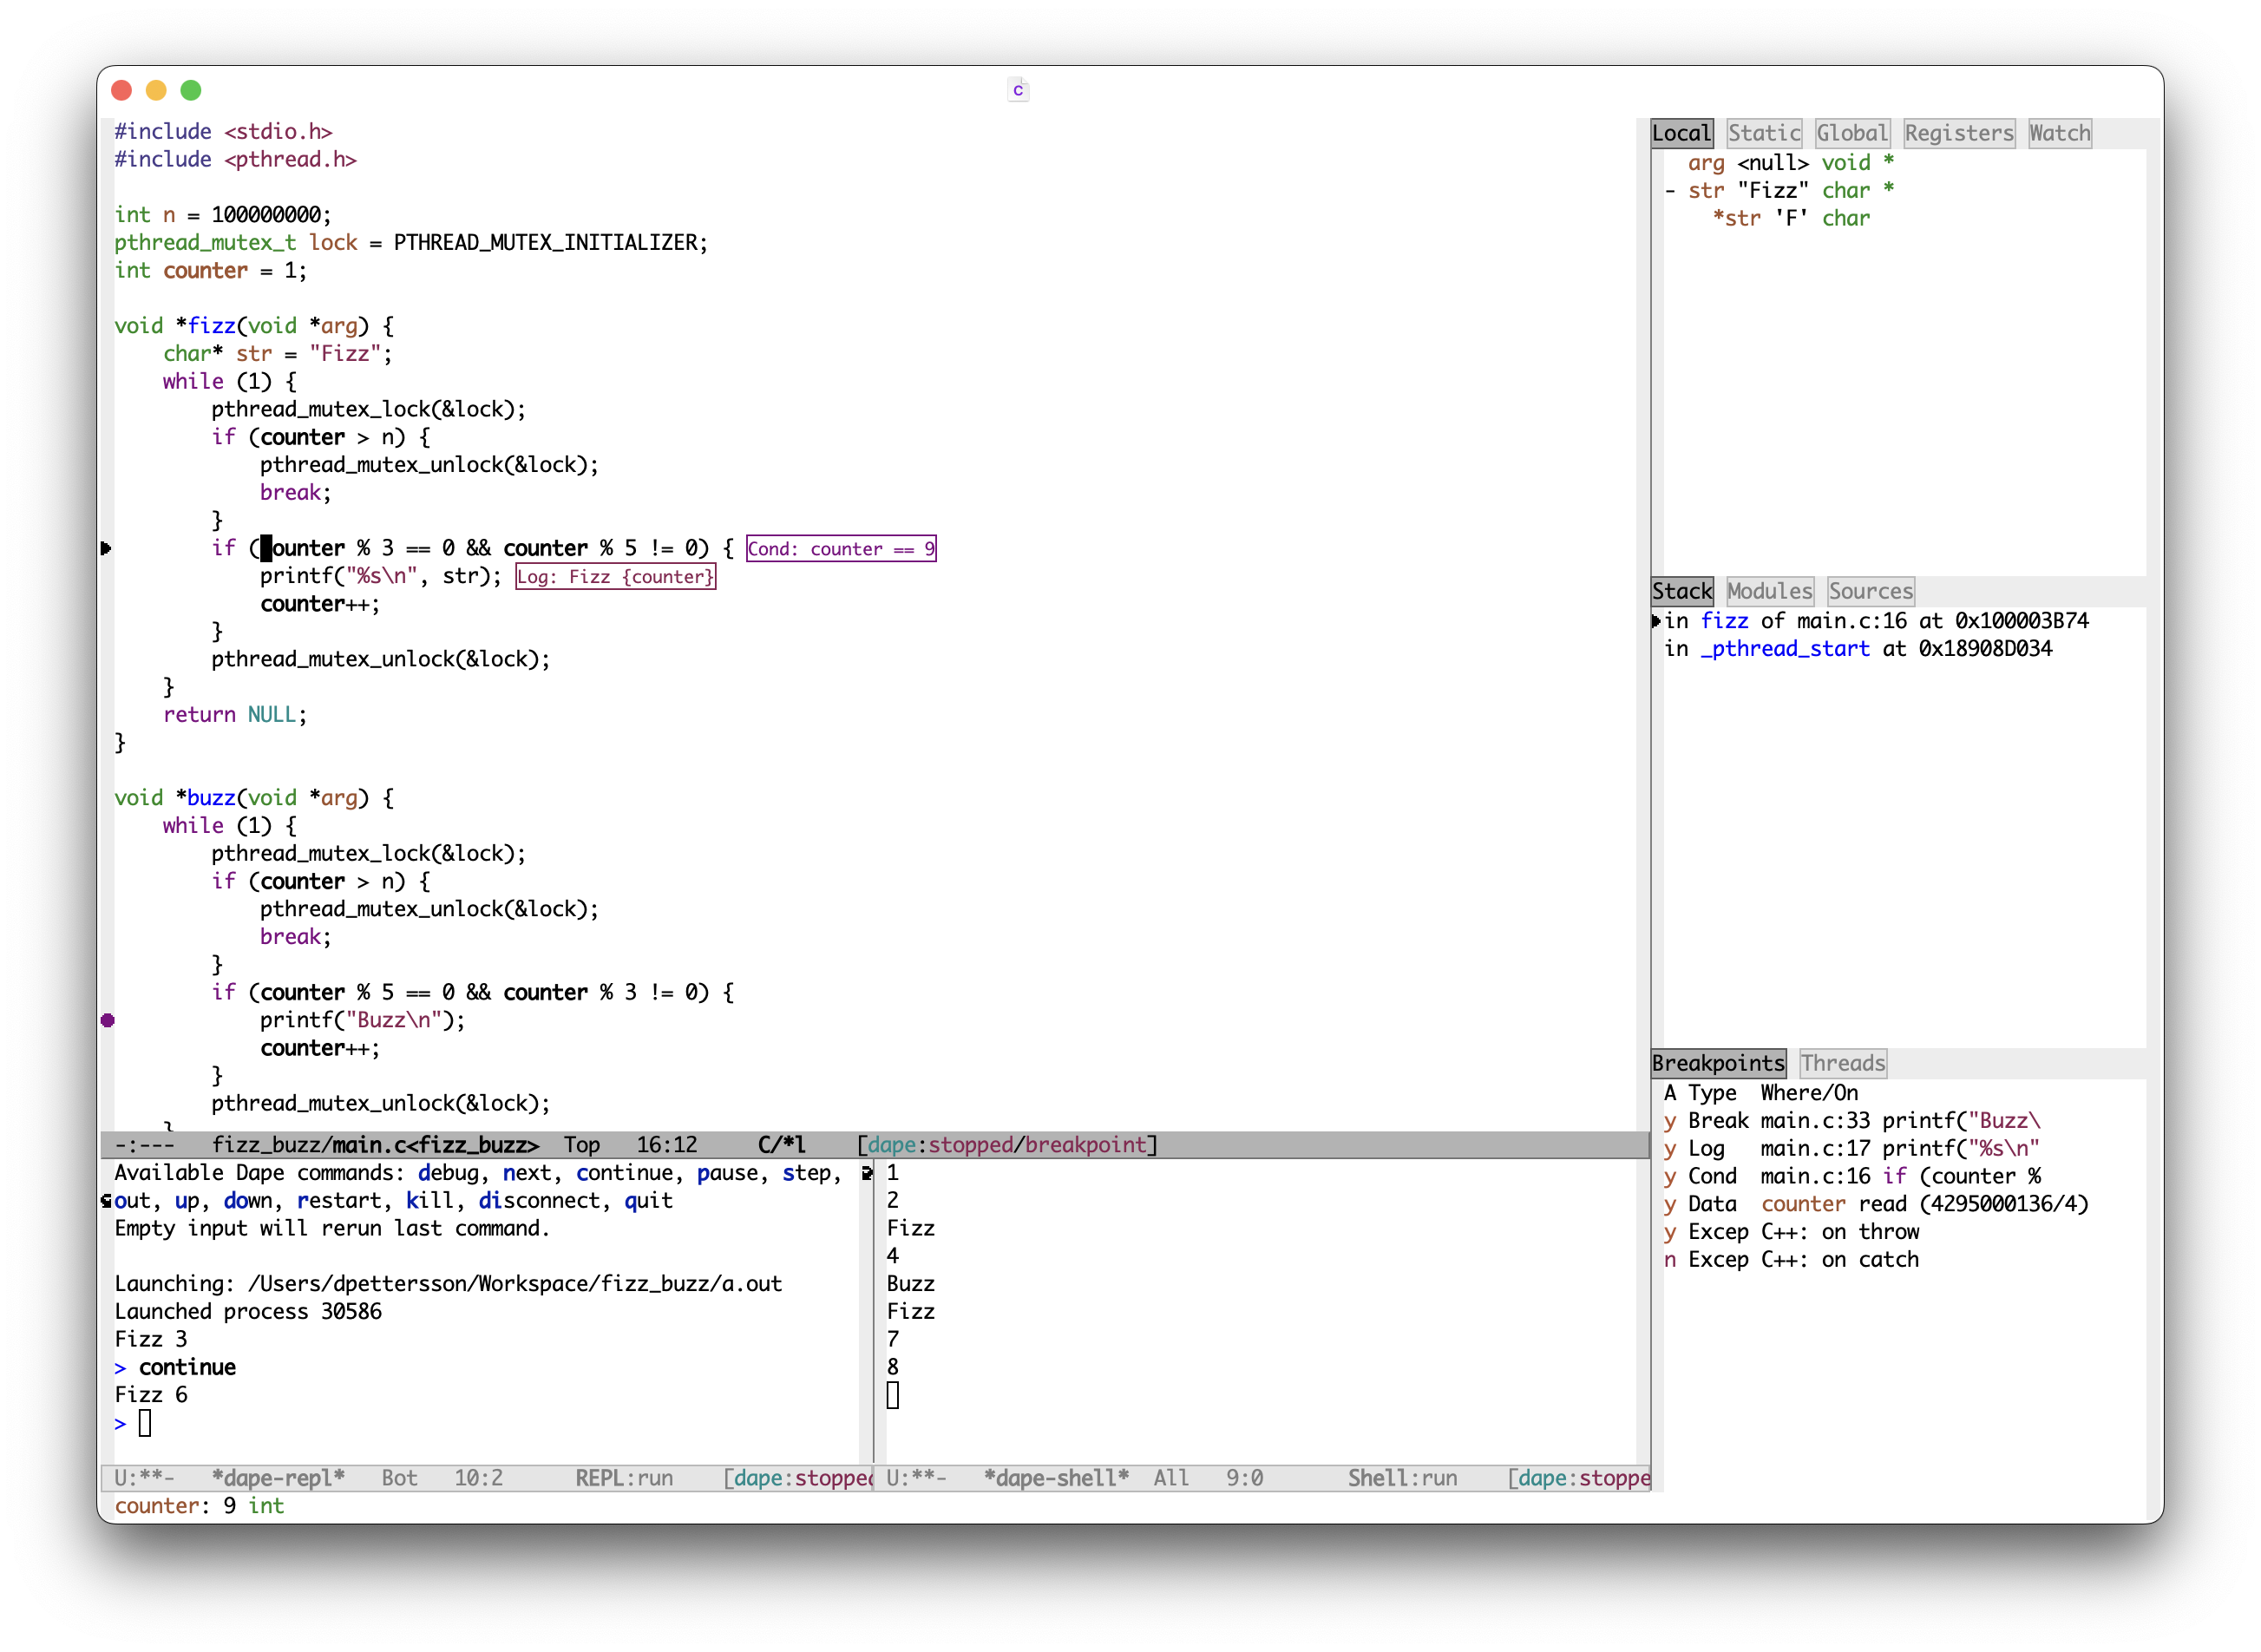
With (setq dape-buffer-window-arrangement 'right): https://raw.githubusercontent.com/svaante/dape/resources/c-right-14.0.0.png And with 
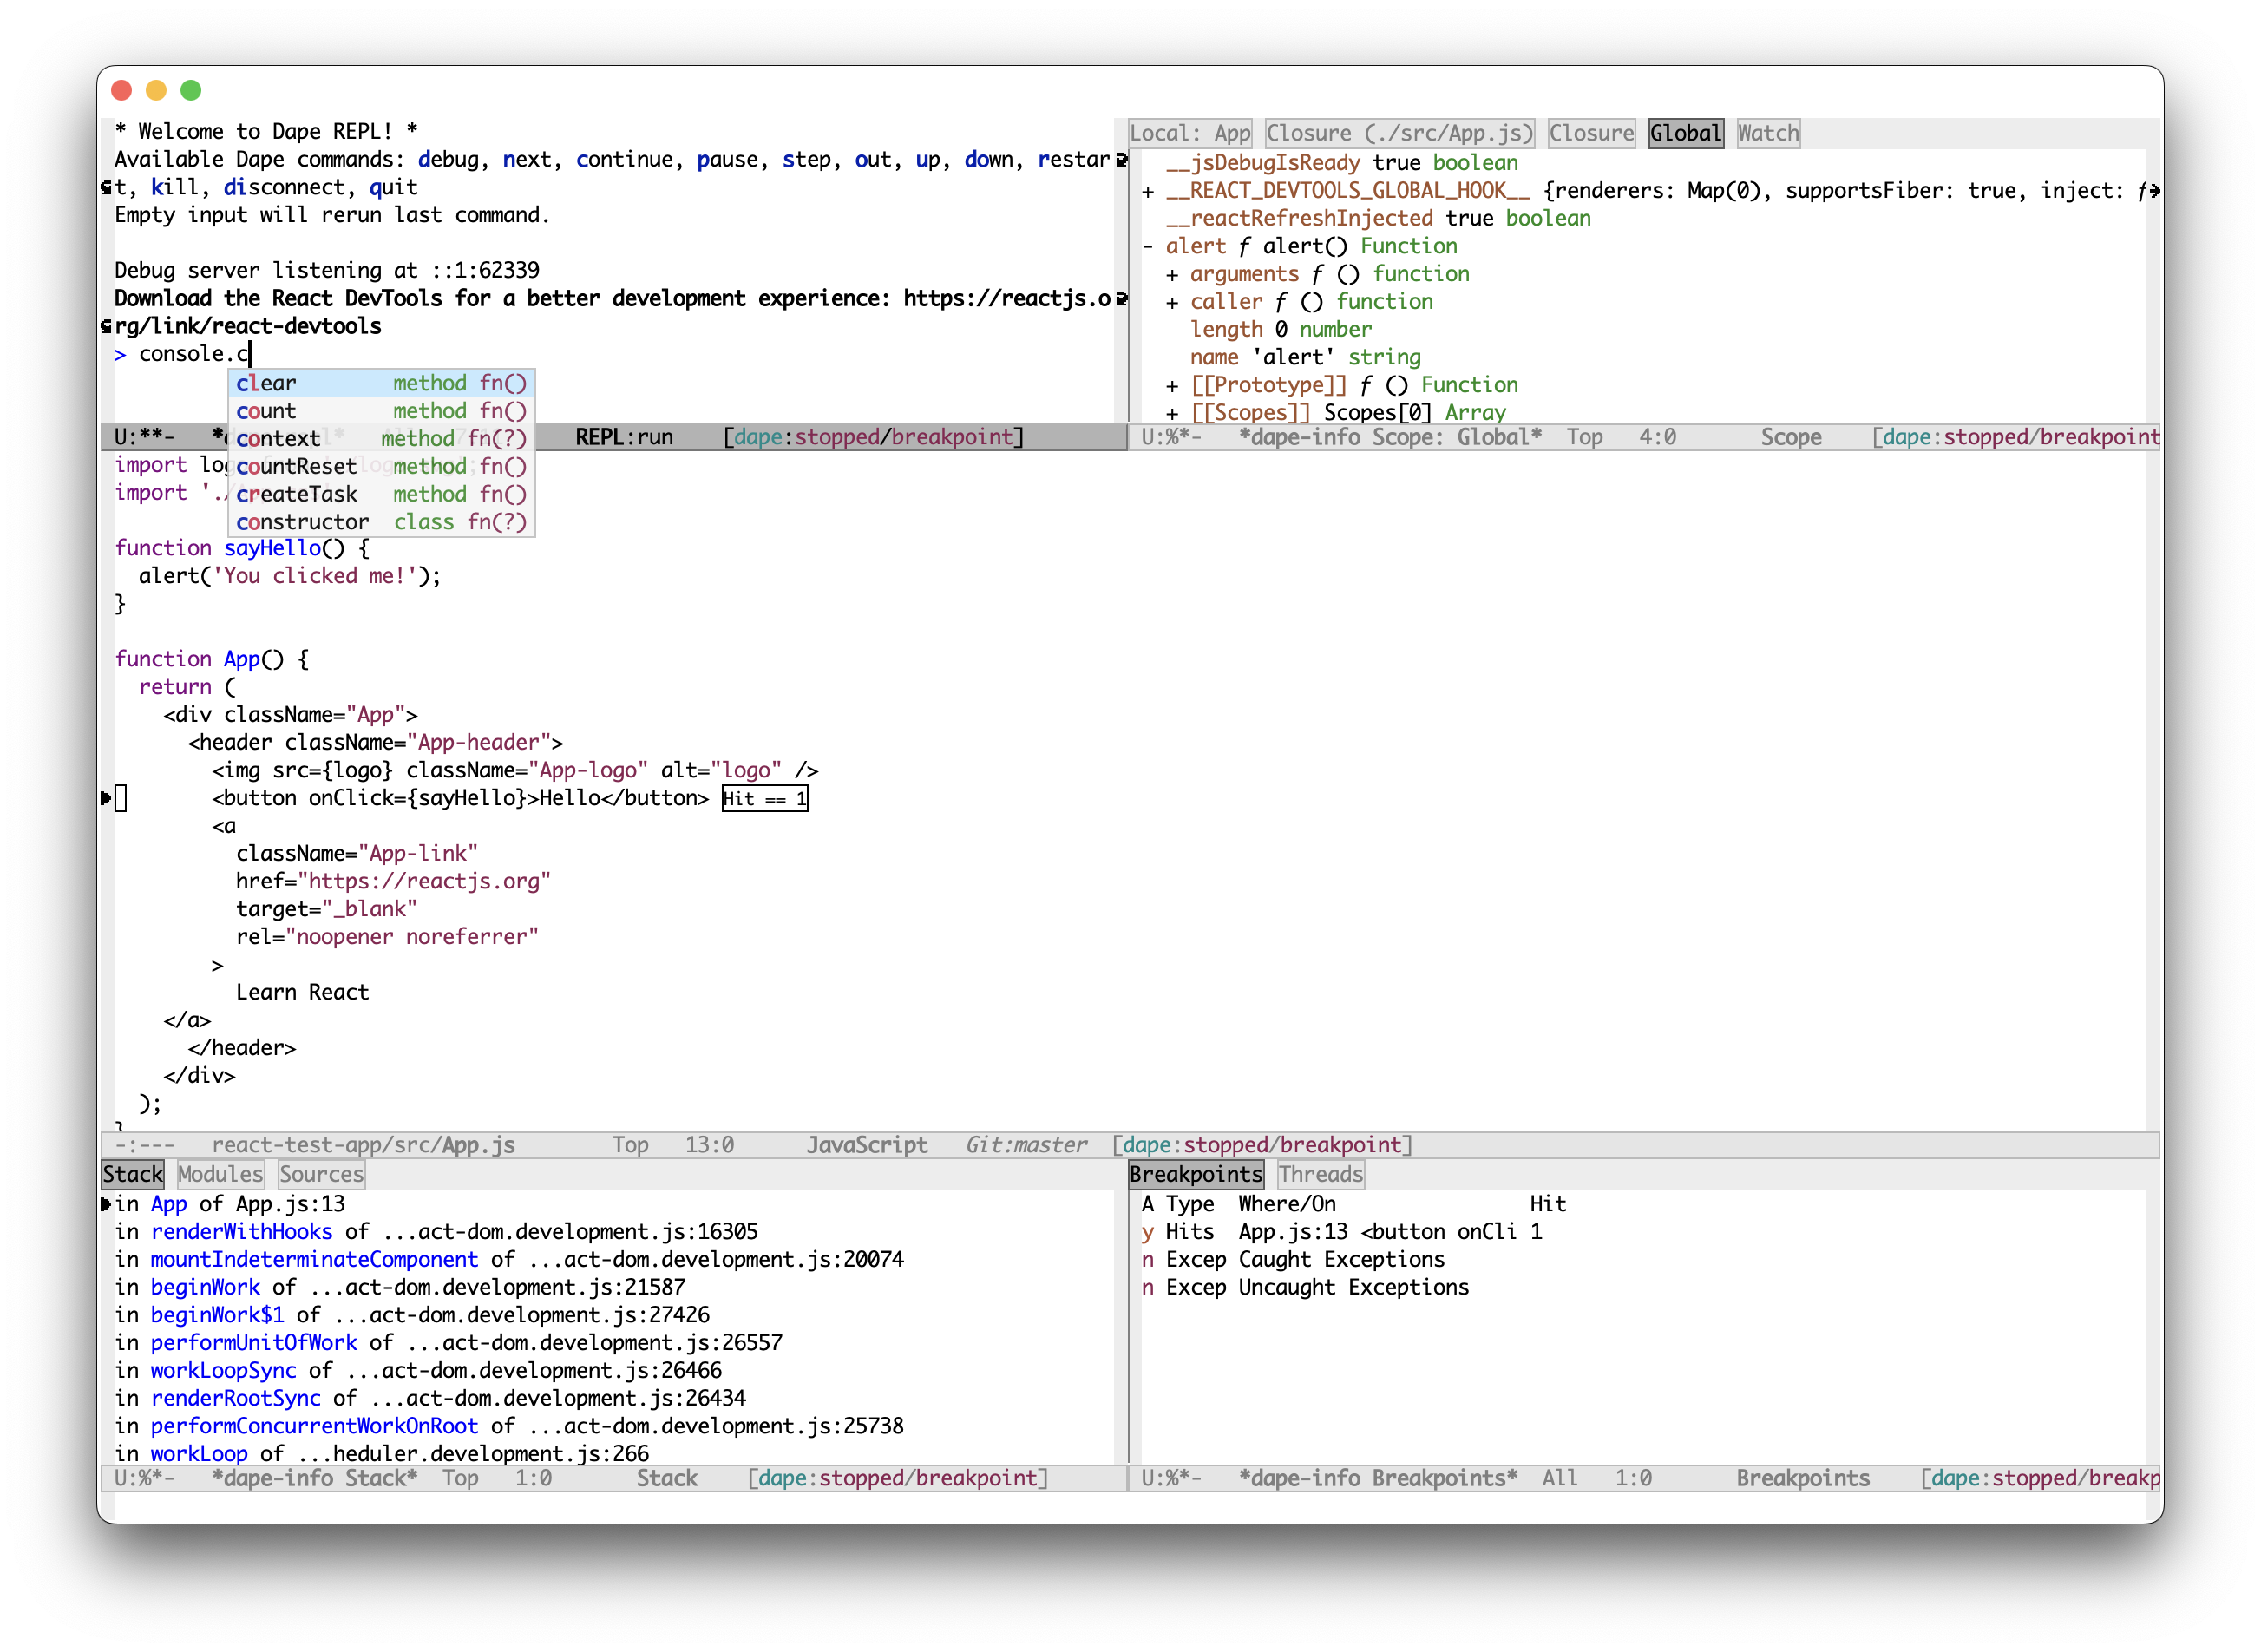
(setq dape-buffer-window-arrangement 'gud) + corfu as completion-in-region-function: https://raw.githubusercontent.com/svaante/dape/resources/js-gud-14.0.0.png With minibuffer adapter configuration hints: https://raw.githubusercontent.com/svaante/dape/resources/minibuffer-hints-14.0.0.png 
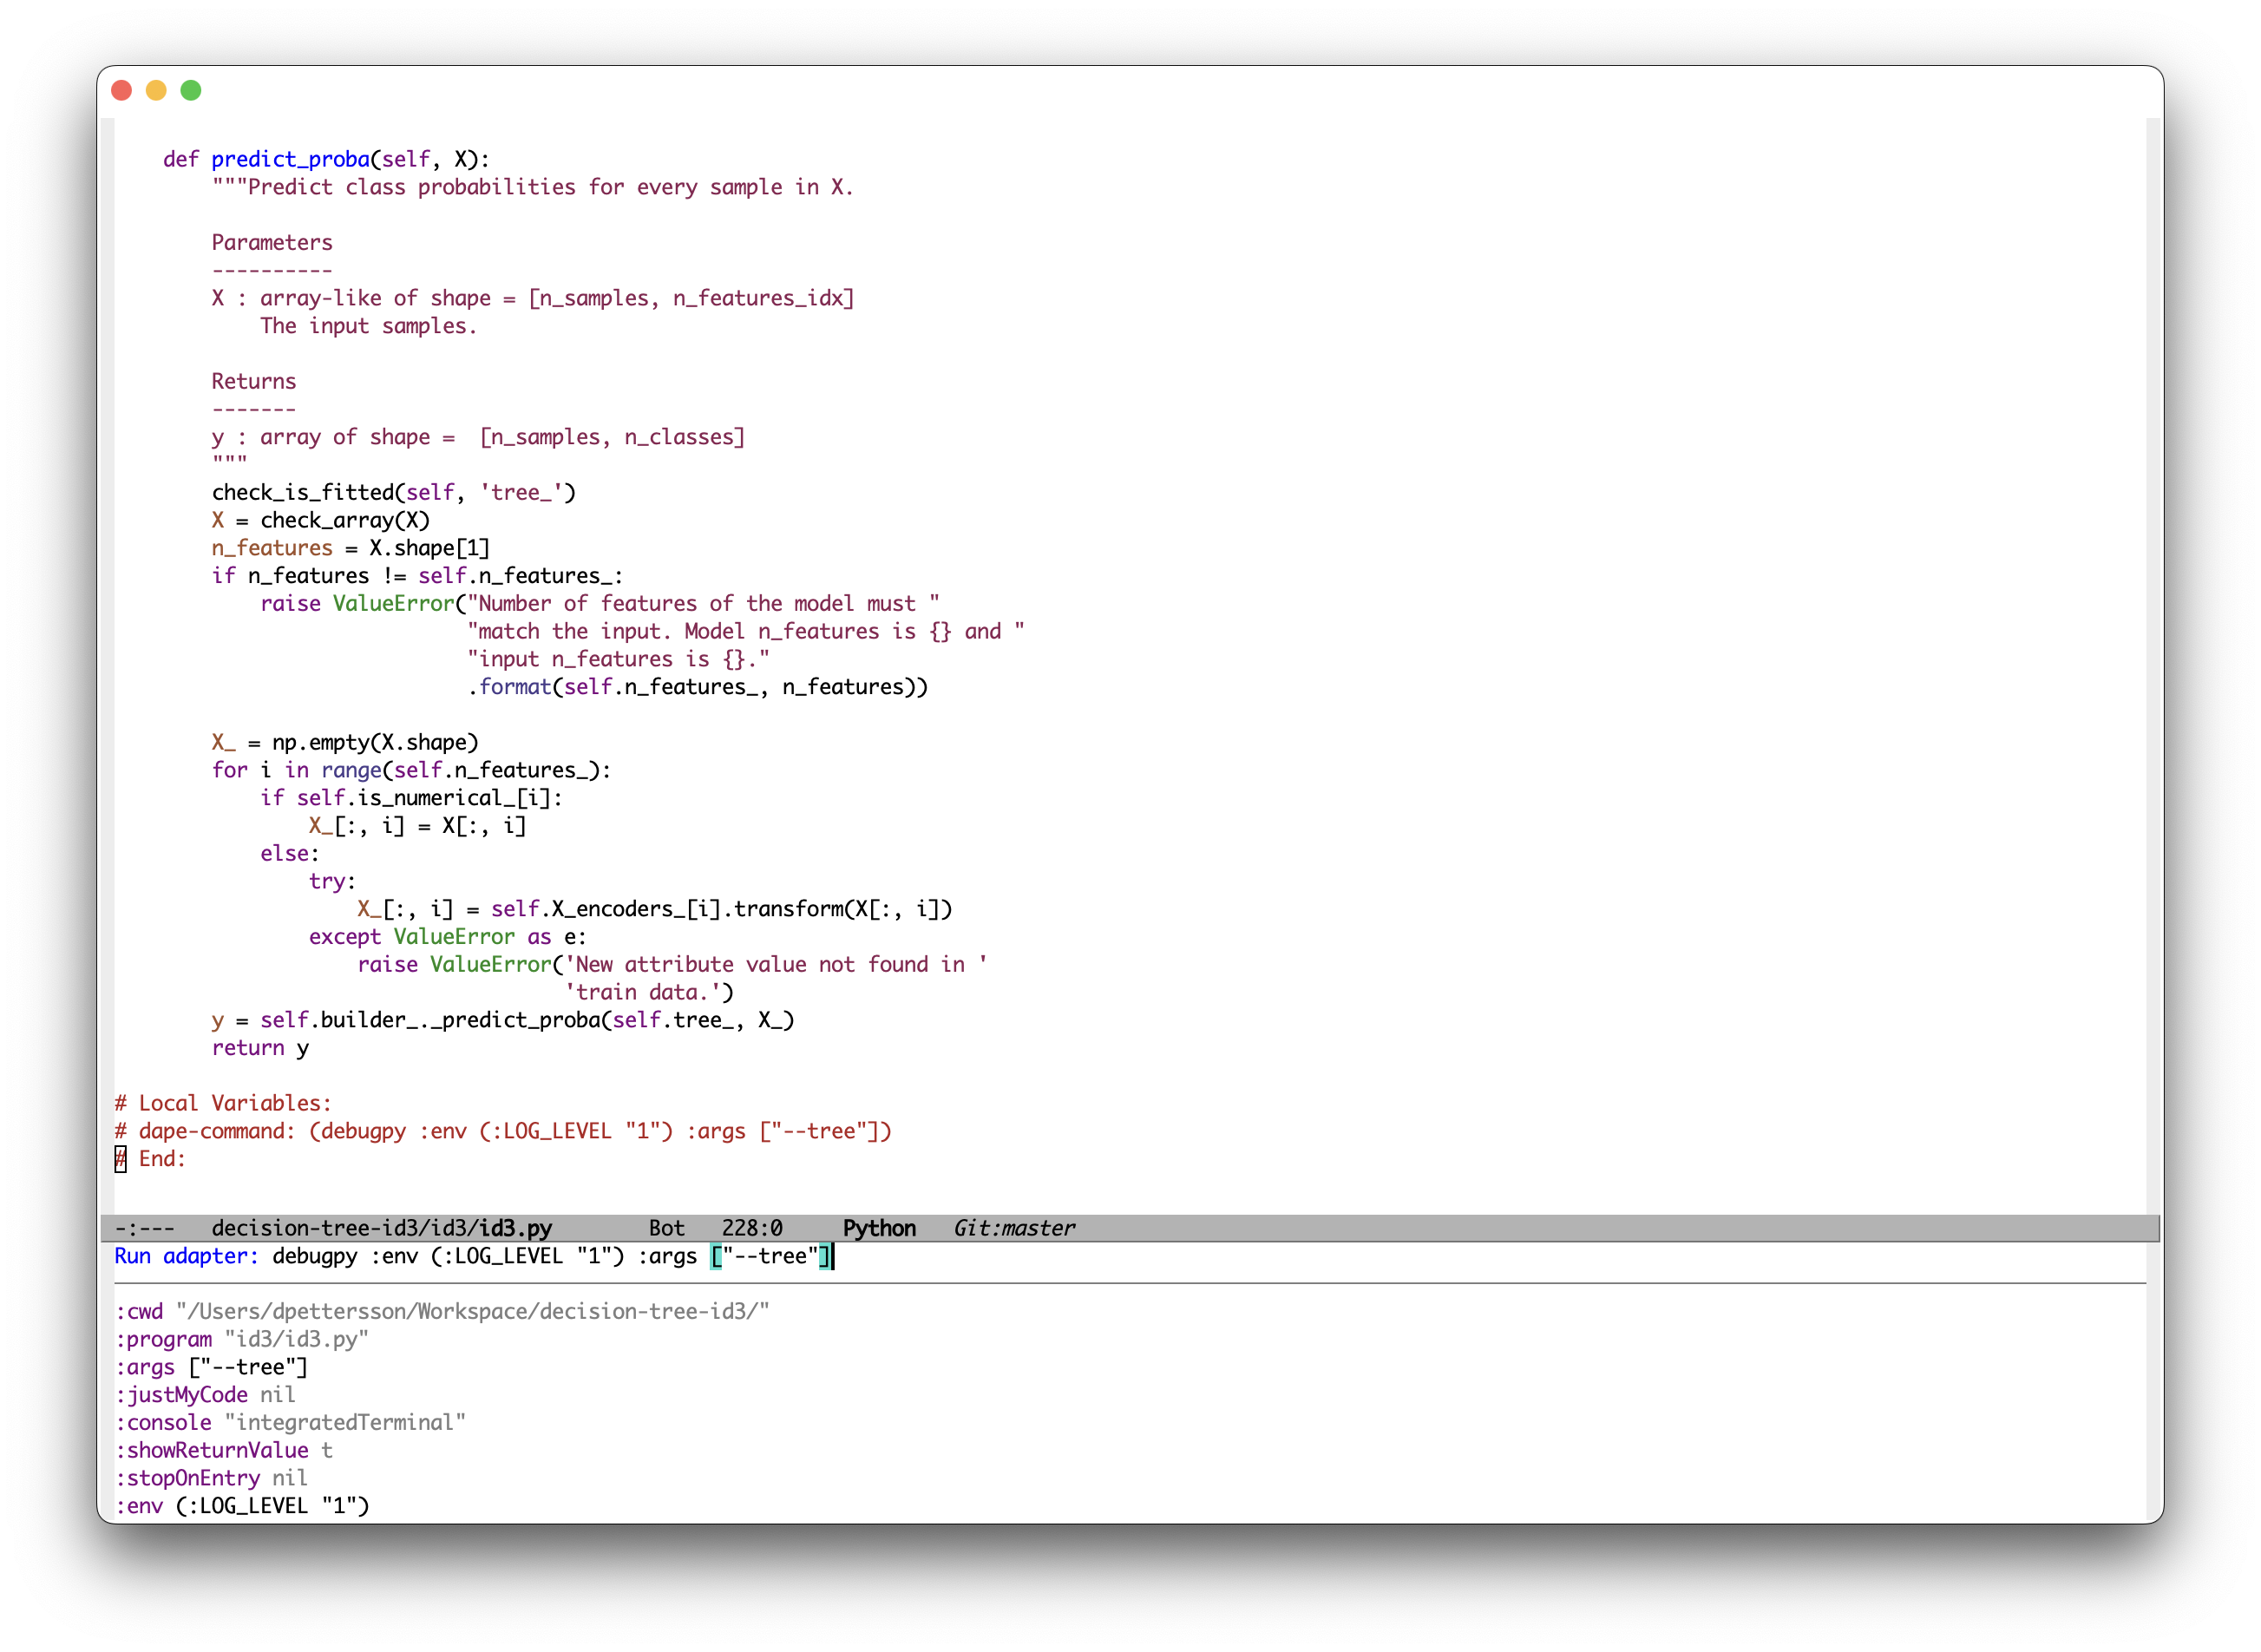
Screenshots taken with standard-light.

Configuration

Dape includes pre-defined debug adapter configurations for various programming languages. Refer to dape-configs for more details. If dape doesn’t include a configuration suitable for your needs, you can implement your own.

(use-package dape
  :preface
  ;; By default dape shares the same keybinding prefix as `gud'
  ;; If you do not want to use any prefix, set it to nil.
  ;; (setq dape-key-prefix "\C-x\C-a")

  :hook
  ;; Save breakpoints on quit
  ;; ((kill-emacs . dape-breakpoint-save)
  ;; Load breakpoints on startup
  ;;  (after-init . dape-breakpoint-load))

  :init
  ;; To use window configuration like gud (gdb-mi)
  ;; (setq dape-buffer-window-arrangement 'gud)

  :config
  ;; Info buffers to the right
  ;; (setq dape-buffer-window-arrangement 'right)

  ;; Global bindings for setting breakpoints with mouse
  ;; (dape-breakpoint-global-mode)

  ;; Pulse source line (performance hit)
  ;; (add-hook 'dape-display-source-hook 'pulse-momentary-highlight-one-line)

  ;; To not display info and/or buffers on startup
  ;; (remove-hook 'dape-start-hook 'dape-info)
  ;; (remove-hook 'dape-start-hook 'dape-repl)

  ;; To display info and/or repl buffers on stopped
  ;; (add-hook 'dape-stopped-hook 'dape-info)
  ;; (add-hook 'dape-stopped-hook 'dape-repl)

  ;; Kill compile buffer on build success
  ;; (add-hook 'dape-compile-hook 'kill-buffer)

  ;; Save buffers on startup, useful for interpreted languages
  ;; (add-hook 'dape-start-hook (lambda () (save-some-buffers t t)))

  ;; Projectile users
  ;; (setq dape-cwd-fn 'projectile-project-root)
  )

Differences with dap-mode

Dape has no dependencies outside of core Emacs packages, and tries to use get as much out of them possible.

Dape takes a slightly different approach to configuration.

  • Dape does not support launch.json files, if per project configuration is needed use dir-locals and dape-command.
  • Dape enhances ergonomics within the minibuffer by allowing users to modify or add PLIST entries to an existing configuration using options. For example dape-config :cwd default-directory :program "/home/user/b.out" compile "gcc -g -o b.out main.c".
  • No magic, no special variables like ${workspaceFolder}. Instead, functions and variables are resolved before starting a new session.
  • Tries to envision how debug adapter configurations would be implemented in Emacs if vscode never existed.

Supported debug adapters

In theory all debug adapters should be compatible with Dape.

Javascript - vscode-js-*

  1. Install node
  2. Visit https://github.com/microsoft/vscode-js-debug/releases/ and download the asset js-debug-dap-<version>.tar.gz
  3. Unpack mkdir -p ~/.emacs.d/debug-adapters && tar -xvzf js-debug-dap-<version>.tar.gz -C ~/.emacs.d/debug-adapters

For more information see OPTIONS.md.

Go - dlv

See delve installation. For more information see documentation.

C, C++, Rust, and more - GDB

Ensure that your GDB version is 14.1 or newer. For further details, consult the documentation.

C, C++ and Rust - codelldb

  1. Download latest vsix release for your platform codelldb-<platform>-<os>.vsix
  2. Unpack mkdir -p ~/.emacs.d/debug-adapters && unzip codelldb-<platform>-<os>.vsix -d ~/.emacs.d/debug-adapters/codelldb

See manual for more information.

C and C++ - cpptools

Download latesnd unpack vsix file with your favorite unzipper.

  1. Download latest vsix release for your platform cpptools-<platform>-<os>.vsix
  2. Unpack mkdir -p ~/.emacs.d/debug-adapters && unzip cpptools-<os>-<platform>.vsix -d ~/.emacs.d/debug-adapters/cpptools
  3. Then chmod +x ~/.emacs.d/debug-adapters/cpptools/extension/debugAdapters/bin/OpenDebugAD7
  4. And chmod +x ~/.emacs.d/debug-adapters/cpptools/extension/debugAdapters/lldb-mi/bin/lldb-mi

See options.

C, C++ and Rust - lldb-dap

  1. Install lldb-dap for your platform

Example for MacOS using homebrew

  1. Install the llvm keg: brew install llvm
  2. Prepend the llvm path to the PATH variable ($(brew --prefix --installed llvm)/bin)
  3. M-x dape and pass in arguments of interest
    • To pass arguments, use :args ["arg1" "arg2" ..]
    • To use a different program instead of a.out (e.g., for Rust), use =:program “target/debug/<crate_name>”=

Python - debugpy

Install debugpy with pip pip install debugpy

See options.

Godot

Configure debug adapter port under “Editor” > “Editor Settings” > “Debug Adapter”.

Dart - flutter

See for installation https://docs.flutter.dev/get-started/install

C# - netcoredbg

See https://github.com/Samsung/netcoredbg for installation

Ruby - rdbg

Install with gem install debug.

See https://github.com/ruby/debug for more information

Java - JDTLS with Java Debug Server plugin

See https://github.com/eclipse-jdtls/eclipse.jdt.ls for installation of JDTLS. See https://github.com/microsoft/java-debug for installation of the Java Debug Server plugin. The Java config depends on Eglot running JDTLS with the plugin prior to starting Dape. Extend eglot-server-programs as follows to have JDTLS load the plugin:

(add-to-list 'eglot-server-programs
             `((java-mode java-ts-mode) .
               ("jdtls"
                :initializationOptions
                (:bundles ["/PATH/TO/java-debug/com.microsoft.java.debug.plugin/target/com.microsoft.java.debug.plugin-VERSION.jar"]))))

PHP - Xdebug

  1. Install and setup Xdebug see instructions
  2. Install node
  3. Download latest vsix release of DAP adapter for Xdebug php-debug-<version>.vsix
  4. Unpack mkdir -p ~/.emacs.d/debug-adapters && unzip php-debug-<version>.vsix -d ~/.emacs.d/debug-adapters/php-debug

Other untested adapters

If you find a working configuration for any other debug adapter please submit a PR.

See microsofts list for other adapters, your mileage will vary.

Contribute

dape is subject to the same copyright assignment policy as GNU Emacs.

Any legally significant contributions can only be merged after the author has completed their paperwork. See Contributor’s Frequently Asked Questions (FAQ) for more information.

Performance

Some minor gains to performance in the debugger can be achieved in changing Emacs configuration values for process interaction and garbage collection.

gc-cons-threshold

This variable controls the frequency of garbage collection in Emacs. Too high a value will lead to increased system memory pressure and longer stalls, and too low a value will result in extra interruptions and context switches (poor performance).

According to GNU Emacs Maintainer Eli Zaretskii:

My suggestion is to repeatedly multiply gc-cons-threshold by 2 until you stop seeing significant improvements in
responsiveness, and in any case not to increase by a factor larger than 100 or somesuch. If even a 100-fold increase
doesn't help, there's some deeper problem with the Lisp code which produces so much garbage, or maybe GC is not the
reason for slowdown.

Abiding the upper end of that advice, you can try to set gc-cons-threshold to 100x the original value:

(setq gc-cons-threshold 80000000) ;; original value * 100

read-process-output-max

The default read-process-output-max of 4096 bytes may inhibit performance to some degree, also.

Linux

On Linux, you should be able to set it up to about 1mb. To check the max value, check the output of:

cat /proc/sys/fs/pipe-max-size

To set it:

(setq read-process-output-max (* 1024 1024)) ;; 1mb

Mac OS

For Mac OS, there isn’t an easy way to see the operating system pipe-max-size. It’s probably about 64kb.

(setq read-process-output-max (* 64 1024)) ;; 64k

Windows

There doesn’t seem to be a limit for Windows. You can try 1mb.

(setq read-process-output-max (* 1024 1024)) ;; 1mb

Bugs and issues

Before reporting any issues (setq dape-debug t) and take a look at *dape-repl* buffer. Please share your *dape-repl* and *dape-connection events* in the buffer contents with the bug report. The master branch is used as an development branch and releases on elpa should be more stable so in the mean time use elpa if the bug is a breaking you workflow.

Acknowledgements

Big thanks to João Távora for the input and jsonrpc; the project wouldn’t be where it is without João.

dape's People

Contributors

damiencassou avatar danielpetterssonm avatar jeff-phil avatar jellelicht avatar jgarte avatar magielbruntink avatar milanglacier avatar papadakis-k avatar sethidden avatar skittishdev avatar svaante avatar timcharper avatar tromey avatar vermiculus avatar

Stargazers

 avatar  avatar  avatar  avatar  avatar  avatar  avatar  avatar  avatar  avatar  avatar  avatar  avatar  avatar  avatar  avatar  avatar  avatar  avatar  avatar  avatar  avatar  avatar  avatar  avatar  avatar  avatar  avatar  avatar  avatar  avatar  avatar  avatar  avatar  avatar  avatar  avatar  avatar  avatar  avatar  avatar  avatar  avatar  avatar  avatar  avatar  avatar  avatar  avatar  avatar  avatar  avatar  avatar  avatar  avatar  avatar  avatar  avatar  avatar  avatar  avatar  avatar  avatar  avatar  avatar  avatar  avatar  avatar  avatar  avatar  avatar  avatar  avatar  avatar  avatar  avatar  avatar  avatar  avatar  avatar  avatar  avatar  avatar  avatar  avatar  avatar  avatar  avatar  avatar  avatar  avatar  avatar  avatar  avatar  avatar  avatar  avatar  avatar  avatar  avatar

Watchers

 avatar  avatar  avatar  avatar  avatar  avatar

dape's Issues

Make dape installable with `package-install-file`

Currently, package-install-file gives the following error if pointed to install dape.el:

package-buffer-info: Package lacks a file header

It seems that the header is missing a -:

;;; dape.el -- Debug Adapter Protocol for Emacs -*- lexical-binding: t -*-

After editing the heading to use ---, it installs as intended:

;;; dape.el --- Debug Adapter Protocol for Emacs -*- lexical-binding: t -*-
;;          ^this

Bit annoying (although nothing deal-breaking), figured I'd point it out 😄

Feature request: restart with args in REPL

While debugging you often want to restart the current session with different arguments (to the main function/method). Now you can do this by doing dape-quit and then dape and providing :args in the minibuffer. That feels quite disruptive. A nice feature would be to have "restart with args" in the date REPL.

Example for a attach to Python (debugpy) running process

Hi!

I'm trying to use the library to debug a running Python program, and I'm not able to connect properly.

I don't have experience with DAP

Could you add an example to attach a process?

It would help me (and maybe others) a lot

Thanks in advance

Documenting all the configuration keywords

Hi! Thank you for the very interesting package.

I am trying to figure out how to use it, and right now I'm trying to launch a simple C++ project that produces a single executable. I want to pass to that executable some CLI arguments, like ./a.out test123. It's not clear to me how should I do it.

Both the docstrings for dape and dape-configs couldn't help me, as not all the keywords are documented, but I guess this is because some of them are specific not to dape, but to the debugger protocol, which I don't know. But it got me wonder, could it be possible to add in the README a tutorial, or a reference to where to get this information? Like, what's the meaning of :args? Is that the keyword I should use? How can I modify the debug sessions every time, so to test different CLI arguments? If I understood correctly, this is done in VSCode/dap-mode using launch.json configuration files, while in dape this is discouraged and instead I should use dir-locals. But how?

If it can help in some way I could try to write down a tutorial if given the complete information, in case this turned out to be too much work.

Thank you again!

Dape and Ruby's rdbg over docker-compose. Almost there!

Hi there,

I've been playing around with Dape today. I, like many, have been wanting something like Dape to exist for many years.

I am currently working with Ruby code - particularly Ruby 2.7 code which is being upgraded to 3.x. I wanted to try running with a DAP server enabled in my docker container. I think its fair to say I got pretty far!

How to do it

  • Add gem "debug" to your Gemfile and recompile the container
  • Add a binding.break wherever you want a breakpoint
  • When booting the ruby container, ensure port 9876 is exposed to the host
  • From the ruby container, run rdbg --open --nonstop --host=0.0.0.0 --port=9876 -c bundle exec <whatever you want to debug>
  • Run the application until the binding.break breakpoint is triggered

Add a ruby-rdbg config to dape-configs. You can do this with customize:

'(ruby-rdbg
  modes (ruby-ts-mode ruby-mode)
  host "127.0.0.1"
  port 9876)

Run dape with the ruby-rdbg adapter. Stuff happens! I can type c to continue execution. Cool!

Screenshot 2023-12-13 at 15 18 09

What doesn't work

The main issue I seem to have come across initially is that the stacktrace files aren't aligned with the filesystem of the host that they're mounted from. You can see the outcome of this when you try and set a breakpoint using dape: rdbg drops No such file or directory @ rb_check_realpath_internal - <host project path>/<project file path> into the REPL output. The path being sent back to rdbg should be <container project path>/<project file path>, so the error makes sense.

I found dape-cwd-fn, and tried to hardcode its output to /usr/app, like in my container, but that didn't seem to help. If there was a way to map the directory root of the output to a local root on a per-project basis in .dir-locals, it would make the more awkward docker-centric configurations a bit easier to work with.

[FAQ] How to config STL pretty-printing for lldb-vscode

My config:

(setq dape-configs
    '((lldb-vscode modes (c-mode c-ts-mode c++-mode c++-ts-mode rust-mode rust-ts-mode)
                   command "lldb-vscode"
                   compile "make -j10"
                   :type "lldb-vscode" ensure dape-ensure-command
                   :cwd "xxx/build-dbg/xxx/src/"
                   :program "/usr/bin/python3"
                   :args ["EdgeCondTests.py"]
                   :MIMode "lldb" 
                   :setupCommands [
                                   (
                                    :description "Enable pretty-printing for gdb"
                                    :text "-enable-pretty-printing"
                                    :ignoreFailures t
                                    )
                                   ]
                   )))

dape debug output:

[io] Sending:
(:arguments (:type "lldb-vscode" :cwd "/home/gezijian/Yuwei/Libra/LibraPackAutoVersion/build-dbg/LibraTask/src/" :program "/usr/bin/python3" :args ["EdgeCondTests.py"] :MIMode "lldb" :setupCommands [(:description "Enable pretty-printing for gdb" :text "-enable-pretty-printing" :ignoreFailures t)]) :type "request" :command "launch" :seq 2)
[io] Received:
(:command "launch" :request_seq 2 :seq 0 :success t :type "response")

But the std::vector is not displayed as expected, then please tell me how to config it.
image

CodeLLDB for C++ cannot initialize due to timeout

Hi again!

I'm trying to launch the debug session for an even simpler test case:

// file ~/C++/test/main.cpp
#include <cstdlib>
#include <iostream>

int main(int argc, char *argv[])
{
  int a;
  a = atoi(argv[1]);
  std::cout << a << "\n";
  return 0;
}

When I try to run M-x dape with the config codelldb-cc command-cwd "~/C++/test/" :program "main" :args ["1"] compile "g++ -o main main.cpp":

  • the modeline keeps showing [Dape:starting]
  • buffer *dape-repl* shows
* Welcome to Dape REPL! *
Available Dape commands: debug, next, continue, pause, step, out, restart, kill, disconnect, quit
Empty input will rerun last command.

* Adapter server started with "~/.emacs.d/debug-adapters/codelldb/extension/adapter/codelldb --port 34825" *
* Connection to adapter established at localhost:34825 *
>

and after a while it adds

* Command initialize timeout *
Initialize failed due to: timeout
* Command disconnect timeout *
Adapter connection shutdown without successfully initializing
Configuration:
  modes (c-mode c-ts-mode c++-mode c++-ts-mode)
  command-args ("--port" "34825")
  ensure dape-ensure-command
  command-cwd "~/C++/test/"
  command "~/.emacs.d/debug-adapters/codelldb/extension/adapter/codelldb"
  port 34825
  fn dape-config-autoport
  :type "lldb"
  :request "launch"
  :cwd "."
  :args ["1"]
  :program "main"
  compile "g++ -o main main.cpp"
[ERROR codelldb::dap_session] Deserialization error: missing field `seq` at line 1 column 256
[ERROR codelldb::dap_session] Deserialization error: missing field `seq` at line 1 column 65
> 
  • buffer *dape-connection events* shows
[client-reply] (id:1) Tue Jan 16 20:28:41 2024:
(:jsonrpc "2.0" :id 1 :method nil :params
	  (:clientID "dape" :adapterID "lldb" :pathFormat "path" :linesStartAt1 t :columnsStartAt1 t :supportsRunInTerminalRequest t :supportsProgressReporting t :supportsStartDebuggingRequest t))
[client-reply] (id:2) Tue Jan 16 20:28:51 2024:
(:jsonrpc "2.0" :id 2 :method nil :params
	  (:restart :json-false))
[internal] Tue Jan 16 20:29:01 2024:
(:message "Connection state changed" :change "deleted\n")

----------b---y---e---b---y---e----------
  • buffer *dape-server stderr* shows
[ERROR codelldb::dap_session] Deserialization error: missing field `seq` at line 1 column 256
[ERROR codelldb::dap_session] Deserialization error: missing field `seq` at line 1 column 65

Process dape adapter stderr finished

It seems different from #1 .
Thanks again!

`dape--info-stack-update` barfs when stack frame source path is a URL

Experimenting at work with using the java debug adapter with an attached debugger, with the example of this comment, I've gotten to an interesting issue.

Due to the architecture of the framework we use at work, when a breakpoint is hit in our code, the program's control flow goes through classes in the CLASSPATH, which the debug adapter will provide via the custom jdtls URL schema of jdt://. This causes problems in dape--info-stack-update, and in particular in the call to dape--format-file-line, since that assumes that the path will be a filesystem path instead of a URL, which in turn means that the inner call to file-relative-name will fail as a result.

The error in particular is (wrong-type-argument stringp nil) because internally file-relative-name is trying to call string-prefix-p with nil as the prefix, which is of course not allowed.


A proper fix would probably require proper support for URLs, but for the time being a working solution could be that if file provided to dape--format-file-line is a URL, it's used verbatim in the stack trace.

[BUG] Cannot debug a Python application

Hello,

First, I would like to thank you for this amazing package. I was looking for a replacement for dap-mode for a while and your package nails it!

I'm trying to debug a Python script. When I M-x dape, I'm getting the *dape-info* and *dape-repl* buffers. I'm seeing a temporary status in the mode-line [Dape:starting]. However, debug is not working, and when I inspect the *dape-debug* buffer, I see that something goes wrong, but it fails silently! Here is the content of *dape-debug*

[info] Starting new single session
[info] Process started ("python3" "-m" "debugpy.adapter")
[io] Sending:
(:arguments (:clientID "dape" :adapterID nil :pathFormat "path" :linesStartAt1 t :columnsStartAt1 t :supportsRunInTerminalRequest t :supportsProgressReporting t :supportsStartDebuggingRequest t) :type "request" :command "initialize" :seq 1)
[info] 
Process ("python3" "-m" "debugpy.adapter") exited with 1
[error] Timeout for reached for seq 1

Any ideas on how to fix this?

Is codelldb necessary?

I'm trying to understand why codelldb is recommended rather than the LLDB binaries from the LLVM repository directly. As I understand it, editors should be able to run the lldb-vscode binary directly, and that would make it much easier for users to keep up with the latest fixes and features of LLDB. Are there important features provided by codelldb for this?

GDB also supports the DAP, but is not supported by codelldb.

Wrong type argument: stringp, dape-cwd-fn

When attempting to M-x dape I get the error: Wrong type argument: stringp, dape-cwd-fn

This is with the default config (with and without the sample projectile cwd fn) and go-ts-mode on emacs 30.0.50.

Debug

Output with (setq debug-on-error t)

Debugger entered--Lisp error: (wrong-type-argument stringp dape-cwd-fn)
  dape--config-ensure((modes (go-mode go-ts-mode) ensure dape-ensure-command fn (dape-config-autoport dape-config-tramp) command "dlv" command-args ("dap" "--listen" "127.0.0.1::autoport") command-cwd dape-cwd-fn port :autoport :request "launch" :type "debug" :cwd dape-cwd-fn :program dape-cwd-fn))
  dape--read-config()
  byte-code("\300 C\207" [dape--read-config] 1)
  command-execute(dape record)
  #<subr execute-extended-command>(nil "dape" "dape")
  ad-Advice-execute-extended-command(#<subr execute-extended-command> nil "dape" "dape")
  apply(ad-Advice-execute-extended-command #<subr execute-extended-command> (nil "dape" "dape"))
  execute-extended-command(nil "dape" "dape")
  funcall-interactively(execute-extended-command nil "dape" "dape")
  command-execute(execute-extended-command)

Possible to debug frontend JS application?

Hello, I was wondering whether it is possible to debug a frontend JS application (like React) using vscode-js-debug in dape. According to their GH, it

debugs Node.js, Chrome, Edge, WebView2, VS Code extensions, and more.

I started by setting up a test react app with npx create-react-app test and running npm run start afterwards. The app is running fine on localhost:3000. But I'm not quite sure how to connect it to dape/vscode-js-debug.

In vscode you'd need a .vscode/launch.json like this

{
  "version": "0.2.0",
  "configurations": [
    {
      "type": "msedge",
      "request": "launch",
      "name": "Launch Edge against localhost",
      "url": "http://localhost:3000",
      "webRoot": "${workspaceFolder}"
    }
  ]
}

So I tried to configure dape like so (please note I've no clue what I'm doing):

          (with-eval-after-load
            'dape
            (setq vscode-js-debug-dir (file-name-concat user-emacs-directory "dape/vscode-js-debug"))
            (add-to-list 'dape-configs
              `(vscode-js-node
                modes (js-mode js-ts-mode typescript-mode typescript-ts-mode)
                host "localhost"
                port 8123
                command "node"
                command-cwd ,(file-name-concat vscode-js-debug-dir "dist")
                command-args ("src/dapDebugServer.js" "8123")
                
                :type "chrome"
		:url "http://localhost:3000"
		:webRoot "/home/db/test/"
                :request "launch"
                
                ;:cwd dape-cwd-fn
                ;:program dape-find-file-buffer-default
                ;:outputCapture "console"
                ;:sourceMapRenames t
                ;:pauseForSourceMap nil
                ;:enableContentValidation t
                ;:autoAttachChildProcesses t
                ;:console "internalConsole"
                ;:killBehavior "forceful"
              ))

But after opening ~/test/src/index.js in emacs and running dape, I see this in *dape-debug*:

[std-server] Server stdout:
Error: Unknown config: {"type":"chrome","url":"http://localhost:3000","webRoot":"/home/db/test/","request":"launch"}
    at fd (/home/db/.emacs.d/dape/vscode-js-debug/dist/src/dapDebugServer.js:60:13798)
    at xu (/home/db/.emacs.d/dape/vscode-js-debug/dist/src/dapDebugServer.js:84:8682)
    at tb.boot (/home/db/.emacs.d/dape/vscode-js-debug/dist/src/dapDebugServer.js:136:7887)
    at Server.<anonymous> (/home/db/.emacs.d/dape/vscode-js-debug/dist/src/dapDebugServer.js:142:3672)
    at process.processTicksAndRejections (node:internal/process/task_queues:95:5)

[info] 
Process nil exited with 256
[error] Timeout for reached for seq 2

I'd appreciate any help. Thanks.

Getting dape working with JDTLS + Java Debug Server

VS Code has a Java Debug Server extension [1], built on JDTLS, that uses DAP. Would it be feasible to configure dape such that it can be used to debug Java programs using that same Debug Server? It seems dap-mode and nvim-dap have managed to create working configurations. Those are very elaborate and tend to be mixed with all kinds of other functionality.

I'm having trouble getting started with configuring dape for this case however. Are there any pointers?

[1] https://github.com/microsoft/java-debug

hydra menu

It would be nice to include a hydra menu, i found it a litlle bit more user friendly than keybinding or having to issue command in console, I have started a simple one loosely based on https://github.com/emacs-lsp/dap-mode/blob/master/dap-hydra.el

(defhydra dape-hydra (:color pink :hint nil :foreign-keys run)
  "
^Stepping^          ^Breakpoints^         ^Info
^^^^^^^^-----------------------------------------------------------
_n_: Next           _bb_: Toggle          _si_: Info
_i_: Step in        _bd_: Delete          _sm_: Memory
_o_: Step out       _ba_: Add             _ss_: Select Stack
_c_: Continue       _bD_: Delete all       _R_: Repl
_r_: Restart        _bl_: Set log message
_Q_: Disconnect
"
  ("n" dape-next)
  ("i" dape-step-in)
  ("o" dape-step-out)
  ("c" dape-continue)
  ("r" dape-restart)
  ("bb" dape-toggle-breakpoint)
  ("be" dape-expression-breakpoint)
  ("bd" dape-remove-breakpoint-at-point)
  ("bD" dape-remove-all-breakpoints)
  ("bl" dape-log-breakpoint)
  ("si" dape-info)
  ("sm" dape-read-memory)
  ("ss" dape-select-stack)
  ("R"  dape-repl)
  ("q" nil "quit" :color blue)
  ("Q" dape-kill :color red))

;;;###autoload
(defun dape-hydra ()
  "Run `dape-hydra/body'."
  (interactive)
  (dape-hydra/body))

Timeout for reached for seq 1 with js-debug

Hello, thank you so much for your work! The independent package for debugging without lsp is awesome!

I ran into a problem, and I'm not sure if it's a problem in my config or package (I've never configured dap without launch.json)

My previous launch.json configuration (used in vs-code)
{
"version": "1.0.0",
"configurations": [
  {
    "type": "node",
    "request": "launch",
    "name": "DEBUG Jest: link spec",
    "runtimeExecutable": "/opt/homebrew/bin/node",
    "program": "${workspaceFolder}/node_modules/.bin/jest",
    "args": [
      "--config",
      "jest.config.cjs",
      "-i",
      "${workspaceFolder}/src/parser/handlers/table.spec.ts",
      "--no-watch"
    ],
    "cwd": "${workspaceFolder}",
    "console": "integratedTerminal",
    "sourceMaps": true
  }
]
}

My current configuration:

(add-to-list 'dape-configs
             `(jest-table
               modes (js-mode js-ts-mode)
               command "node"
               command-cwd "/users/darkawower/tmp/vscode-js-debug/dist"
               command-args ("src/dapdebugserver.js" "8123")
               :type "node"
               :request "launch"
               :cwd dape-cwd-fn
               :program "/Users/darkawower/projects/pet/org-mode-ast/node_modules/.bin/jest"
               :outputcapture "console"
               :args [ "--config",
                       "/Users/darkawower/projects/pet/org-mode-ast/jest.config.cjs",
                       "-i",
                       "/Users/darkawower/projects/pet/org-mode-ast/src/table.spec.ts"
                       ]
               :sourcemaprenames t
               :pauseforsourcemap nil
               :enablecontentvalidation t
               :autoattachchildprocesses t
               :console "internalconsole"
               :killbehavior "forceful"))

dape-debug:

[info] Starting new single session
[info] Process started ("node" "src/dapdebugserver.js" "8123")
[io] Sending:
(:arguments
 (:clientID "dape" :adapterID "node" :pathFormat "path" :linesStartAt1 t :columnsStartAt1 t :supportsRunInTerminalRequest t :supportsProgressReporting t :supportsStartDebuggingRequest t)
 :type "request" :command "initialize" :seq 1)

[error] Timeout for reached for seq 1

dape-processes:

Debug server listening at 127.0.0.1:8123

Did i miss smth?

:console integratedTerminal option with vscode-js-debug no longer works

After upgrading from dape 0.2.0 to dape 0.5.0, the option :console "integratedTerminal" no longer works. The option internalConsole (which does not cause the error) does not let me see the STDOUT/STDERR of the process I am testing.

When I use :console "integratedTerminal", I get this error from dapDebugServer

TypeError: Cannot read properties of undefined (reading 'processId')
    at new t (/home/tim/.emacs.d/debug-adapters/js-debug/src/dapDebugServer.js:131:38022)
    at El.launchProgram (/home/tim/.emacs.d/debug-adapters/js-debug/src/dapDebugServer.js:136:430)
    at process.processTicksAndRejections (node:internal/process/task_queues:95:5)
    at async n (/home/tim/.emacs.d/debug-adapters/js-debug/src/dapDebugServer.js:133:4088)
    at async _l.launch (/home/tim/.emacs.d/debug-adapters/js-debug/src/dapDebugServer.js:131:30729)
    at async eb.captureLaunch (/home/tim/.emacs.d/debug-adapters/js-debug/src/dapDebugServer.js:136:9297)
    at async eb._launch (/home/tim/.emacs.d/debug-adapters/js-debug/src/dapDebugServer.js:136:9044)
    at async Promise.all (index 3)
    at async eb._boot (/home/tim/.emacs.d/debug-adapters/js-debug/src/dapDebugServer.js:136:8168)
    at async Server.<anonymous> (/home/tim/.emacs.d/debug-adapters/js-debug/src/dapDebugServer.js:142:3662)

Screen recording:

https://asciinema.org/a/truxou1bEXoZSoxMjDvXMkYLN

dape--cppdbg-command missing

It looks like dape--cppdbg-command is missing.

When evaluating this code from the read.me.

(add-to-list 'dape-configs
             `(cppdbg
               modes (c-mode c-ts-mode c++-mode c++-ts-mode)
               command-cwd ,(file-name-directory
                             dape--cppdbg-command)
               command cppdbg-command
               :type "cppdbg"
               :request "launch"
               :cwd dape-cwd-fn
               :program dape-find-file
               :MIMode ,(cond
                         ((executable-find "gdb") "gdb")
                         ((executable-find "lldb") "lldb"))))

Throws this error.

Debugger entered--Lisp error: (void-variable dape--cppdbg-command)
  (file-name-directory dape--cppdbg-command)
  (list 'cppdbg 'modes '(c-mode c-ts-mode c++-mode c++-ts-mode) 'command-cwd (file-name-directory dape--cppdbg-command) 'command 'cppdbg-command ':type "cppdbg" ':request "launch" ':cwd 'dape-cwd-fn ':program 'dape-find-file ':MIMode (cond ((executable-find "gdb") "gdb") ((executable-find "lldb") "lldb")))
  (add-to-list 'dape-configs (list 'cppdbg 'modes '(c-mode c-ts-mode c++-mode c++-ts-mode) 'command-cwd (file-name-directory dape--cppdbg-command) 'command 'cppdbg-command ':type "cppdbg" ':request "launch" ':cwd 'dape-cwd-fn ':program 'dape-find-file ':MIMode (cond ((executable-find "gdb") "gdb") ((executable-find "lldb") "lldb"))))
  (progn (add-to-list 'dape-configs (list 'cppdbg 'modes '(c-mode c-ts-mode c++-mode c++-ts-mode) 'command-cwd (file-name-directory dape--cppdbg-command) 'command 'cppdbg-command ':type "cppdbg" ':request "launch" ':cwd 'dape-cwd-fn ':program 'dape-find-file ':MIMode (cond ((executable-find "gdb") "gdb") ((executable-find "lldb") "lldb")))))
  eval((progn (add-to-list 'dape-configs (list 'cppdbg 'modes '(c-mode c-ts-mode c++-mode c++-ts-mode) 'command-cwd (file-name-directory dape--cppdbg-command) 'command 'cppdbg-command ':type "cppdbg" ':request "launch" ':cwd 'dape-cwd-fn ':program 'dape-find-file ':MIMode (cond ((executable-find "gdb") "gdb") ((executable-find "lldb") "lldb"))))) t)
  elisp--eval-last-sexp(nil)
  eval-last-sexp(nil)
  funcall-interactively(eval-last-sexp nil)
  call-interactively(eval-last-sexp nil nil)
  command-execute(eval-last-sexp)

Timeout when using codelldb

Hi @svaante, thanks for this useful package!
On win 10, emacs version "30.0.50", after I started codelldb, it got "time out " message on mode line, and the output of *dape-debug* is:

[info] Starting new multi session
[info] Server process started ("c:/green/emacs/.emacs.d/.extension/codelldb-x86_64-windows/extension/adapter/codelldb.exe" "--port" "5818")
[info] Connection to server established localhost:5818
[io] Sending:
(:arguments
 (:clientID "dape" :adapterID "lldb" :pathFormat "path" :linesStartAt1
            t :columnsStartAt1 t :supportsRunInTerminalRequest t
            :supportsProgressReporting t
            :supportsStartDebuggingRequest t)
 :type "request" :command "initialize" :seq 1)

[error] Timeout for reached for seq 1
[info] 
Process nil exited with 0
[info] 
Process ("c:/green/emacs/.emacs.d/.extension/codelldb-x86_64-windows/extension/adapter/codelldb.exe" "--port" "5818") exited with 0

And I checked the output of *dape-processes* is:

Content-Length: 983

{"seq":1,"type":"response","request_seq":1,"success":true,"command":"initialize","body":{"exceptionBreakpointFilters":[{"default":true,"filter":"cpp_throw","label":"C++: on throw","supportsCondition":true},{"default":false,"filter":"cpp_catch","label":"C++: on catch","supportsCondition":true}],"supportTerminateDebuggee":true,"supportsCancelRequest":true,"supportsCompletionsRequest":true,"supportsConditionalBreakpoints":true,"supportsConfigurationDoneRequest":true,"supportsDataBreakpoints":true,"supportsDelayedStackTraceLoading":true,"supportsDisassembleRequest":true,"supportsEvaluateForHovers":true,"supportsExceptionFilterOptions":true,"supportsExceptionInfoRequest":true,"supportsFunctionBreakpoints":true,"supportsGotoTargetsRequest":true,"supportsHitConditionalBreakpoints":true,"supportsInstructionBreakpoints":true,"supportsLogPoints":true,"supportsReadMemoryRequest":true,"supportsSetVariable":true,"supportsSteppingGranularity":true,"supportsWriteMemoryRequest":true}}

And I M-x run (search-forward-regexp dape--content-length-re nil t) in *dape-processes*, it won't skip Content-Length: 983, so I think the problem is dape--content-length-re, so I changed it to this:

(defconst dape--content-length-re
  "\\(?:.*: .*\r\n\\)*Content-Length: \
*\\([[:digit:]]+\\)\n\\(?:.*: .*\r\n\\)*\n"
  "Matches debug adapter protocol header.")

And it finally work! I know \r\n only exsit in windows platform, but it's strange not work here. I C-x C-w saved the output of *dape-processes* to the txt file below:
output.txt

share an example for golang to run unit test

  (add-to-list 'dape-configs
               `(delve
                 modes (go-mode go-ts-mode)
                 ensure dape-ensure-command
                 fn dape-config-autoport
                 command "dlv"
                 command-args ("dap" "--listen" "127.0.0.1::autoport")
                 command-cwd dape-cwd-fn
                 port :autoport
                 :type "debug"
                 :request "launch"
                 :mode (lambda() (if (string-suffix-p "_test.go"   (buffer-name)) "test" "debug"))
                 :cwd dape-cwd-fn
                 :program (lambda()(if (string-suffix-p "_test.go"   (buffer-name))
                                       (concat "./" (file-relative-name default-directory (funcall dape-cwd-fn)))
                                     (funcall dape-cwd-fn)))
                 :args (lambda()
                         (require 'which-func)
                         (if (string-suffix-p "_test.go"   (buffer-name))
                             (when-let* ((test-name (which-function))
                                         (test-regexp (concat "^" test-name "$")))
                               (if test-name `["-test.run" ,test-regexp]
                                 (error "No test selected")))
                           []))))

Lots of "event ignored due to request n < last handled seq n"

Overview

image

I've getting a ton of these errors in the dape-debug buffer, and I'm not entirely sure why. The debugger appears to work, mostly, except the process output gets truncated if it dies due to an error.

Are these just expected?

Environment

  • emacs 29.1
  • dapDebugServer.js
  • and have native json serialization enabled... (json-available-p) returns t.
  • have configured gc-cons-threshold and read-process-output-max:
(setq gc-cons-threshold 100000000)
(setq read-process-output-max (* 1024 1024)) ;; 1mb
  • have confirmed read-process-output-max is not greater than my pipe-max-size
$ cat /proc/sys/fs/pipe-max-size
1048576
  • dape 0.3.0 (installed from git, commit 5356093)

How to run streamlit with debugpy?

Hi, do you have an idea on how to run streamlit with debugpy?

Here is my best guess:

(add-to-list 'dape-configs
               `(ui
                 modes (python-ts-mode python-mode)
                 command "/Users/cambiaghiluca/git/aa-api/.direnv/python-3.11/bin/python"
                 command-args ("-m" "debugpy.adapter" "-m" "streamlit" "run" "/Users/cambiaghiluca/git/aa-api/ui/__main__.py" "--logger.level=info")
                 :type "executable"
                 :request "launch"
                 :cwd dape-cwd-fn
                 ))

This fails with

__main__.py: error: unrecognized arguments: -m streamlit run /Users/cambiaghiluca/git/aa-api/ui/__main__.py --logger.level=info

I have also tried:

(add-to-list 'dape-configs
               `(ui
                 modes (python-ts-mode python-mode)
                 command "/Users/cambiaghiluca/git/aa-api/.direnv/python-3.11/bin/python"
                 :type "executable"
                 :request "launch"
                 :cwd dape-cwd-fn
                 :program "/Users/cambiaghiluca/git/aa-api/.direnv/python-3.11/bin/streamlit"
                 :args ["run" "ui/__main__.py" "--logger.level=info"]
                 ))

which just times out.

Thanks!

dape-on-stopped-hooks documentation mismatch

According to the docstring, dape-on-stopped-hooks will be called upon session termination; at least that’s how I understand it. However, it is called upon every "stopped" event, e.g. breakpoint halt.

I tried to use dape-on-start-hooks/dape-on-stopped-hooks to enable/disable repeat-mode for dape. Unfortunately upon the first "stopped" event (breakpoint halt) repeat-mode gets disabled due to the described behaviour.

I think the dape-on-stopped-hooks docstring should be modified to clearly state this behaviour, and/or – even better – a real dape-on-session-terminated-hook should be established, which could be called upon dape-kill, for example.

Debug Python over Tramp

Hello and thanks again for the amazing package.

Given that make-process allows processes over Tramp, I was wondering if one could leverage that to debug over Tramp. I used the following config with no success:

(add-to-list 'dape-configs
               `(debugpy-remote-interpreter
                 modes (python-ts-mode python-mode)
                 command "/ssh:MyServer:~/opt/miniconda3/envs/my-env/bin/python"
                 command-args ("-m" "debugpy.adapter")
                 :type "executable"
                 :request "launch"
                 :cwd dape-cwd-fn
                 :program dape-find-file-buffer-default))

the error is dape: Doing vfork: No such file or directory. Full debug traceback is:

Debugger entered--Lisp error: (file-missing "Doing vfork" "No such file or directory")
  dape--start-single-session(debugpy-remote-interpreter (modes (python-ts-mode python-mode) command "opt/miniconda3/envs/my-env/bin/python" command-args ("-m" "debugpy.adapter") :type "executable" :request "launch" :cwd "/ssh:MyServer:my-program.py" :program "/ssh:MyServer:my-program.py"))
  dape(debugpy-remote-interpreter (modes (python-ts-mode python-mode) command "opt/miniconda3/envs/my-env/bin/python" command-args ("-m" "debugpy.adapter") :type "executable" :request "launch" :cwd "/ssh:MyServer:my-program.py" :program "/ssh:MyServer:my-program.py"))
  funcall-interactively(dape debugpy-remote-interpreter (modes (python-ts-mode python-mode) command "opt/miniconda3/envs/my-env/bin/python" command-args ("-m" "debugpy.adapter") :type "executable" :request "launch" :cwd "/ssh:MyServer:my-program.py" :program "/ssh:MyServer:my-program.py"))
  command-execute(dape)

Any help would be appreciated.

Thanks again

Correct way to pass `:args` for debugpy

Hello and thanks a lot for the awesome package. I am trying to debug a (python) streamlit app with debugpy. The launch.json way is detailed in here https://slashgordon.github.io/post/debug_streamlit_in_vscode/. I do something similar, namely:

  (add-to-list 'dape-configs
               '(streamlit
                 modes (python-ts-mode python-mode)
                 command "python3"
                 command-args ("-m" "debugpy.adapter")
                 :type "executable"
                 :request "launch"
                 :module "streamlit"
                 :cwd dape-cwd-fn
                 :args ("run" "/home/test/streamlit_test.py")
                 ))

But I get the error
Wrong type argument: symbolp, "run". Any idea what I do wrong? Doing :args ("run" "/home/test/streamlit_test.py")` also does not help. Any idea what I do wrong?

Thanks again

`jsonrpc` version detection is not generic enough

Hello,

I'm using straight.el for package management,

Recently, dape is not usable on my installation because of these lines:

dape/dape.el

Lines 58 to 60 in 3cd8d42

(unless (package-installed-p 'jsonrpc '(1 0 24))
(error "dape: Requires jsonrpc version >= 1.0.24, use `list-packages'\
to install latest `jsonrpc' release from elpa"))

The jsonrpc version detection code above supposes that the package has been installed using the builtin package.el. So, if the user uses any other package manager (like straight.el), the package-installed-p returns nil causing dape to fail even if we have the right jsonrpc version.

I've seen that jsonrpc doesn't include a jsonrpc-version variable, but I think you can just require assume that the user have the right jsonrpc version since this is explicitly declared in the package' dependencies:

dape/dape.el

Line 11 in 3cd8d42

;; Package-Requires: ((emacs "29.1") (jsonrpc "1.0.24"))

Trailing garbage when dape is executed the second time

If i use dape with codelldb, the first time it prompts for an adapter and i type codelldb,
the next prompt is for the file.

If used the second time the adapter prompt is prefilled with:
codelldb :cwd "/path/to/project/" :program "path/to/project/file"

pressing enter gives the error message [Trailing garbage following expression],
to use dape i have to manually get rid of that garbage.

CodeLLDB breakpoints don't work

Thank you for your patience 🙂

Apparently, CodeLLDB seems to ignore my breakpoints. What I mean is that, even after having placed a breakpoint with dape-breakpoint-toggle, the debug runs over it.

Environment:

  • example file
// ~/C++/test/main.cpp
#include <cstdlib>
#include <iostream>

int main(int argc, char *argv[])
{
  int a;
  a = atoi(argv[1]);
  std::cout << a << "\n";
  return 0;
}
  • dape b9d0579
  • jsonrpc 1.0.24
  • ~/C++/test/.dir-locals.el file:
;;; Directory Local Variables            -*- no-byte-compile: t -*-
;;; For more information see (info "(emacs) Directory Variables")

((c++-mode . ((dape-command . (codelldb-cc command-cwd "~/C++/test/" :program "main" :args
					   ["1"]
					   compile "g++ -o main main.cpp")))))

Steps to reproduce:

  • open the main.cpp file
  • go on the a = atoi(argv[1]); line
  • C-x C-a b/dape-breakpoint-toggle
  • C-x C-a d/dape
  • enter

Output:

  • bufffer *dape-repl*:
* Welcome to Dape REPL! *
Available Dape commands: debug, next, continue, pause, step, out, restart, kill, disconnect, quit
Empty input will rerun last command.

* Adapter server started with "~/.emacs.d/debug-adapters/codelldb/extension/adapter/codelldb --port 35341" *
* Connection to adapter established at localhost:35341 *
Console is in 'commands' mode, prefix expressions with '?'.
Launching: /home/alessandro/C++/test/main 1
Launched process 8625
Process exited with code 0.
* Exit code: 0 *
* Session terminated *
> 
  • buffer *dape-shell*:
1

Desired output

To have the session stopped at line a = atoi(argv[1]);

Bug appears when using codelldb for Rust

When entering "debug" in dape-repl, I find the bug.
Error message:

funcall: Wrong number of arguments: ((t) (name options &optional skip-compile) "Start debugging session.

Start a debugging session based on NAME in `dape-configs' alist.
Entries in plist OPTIONS override config specified by NAME.
See `dape-configs' for more information on CONFIG.

When called as an interactive command, the first symbol like
string is read as NAME and rest as element in CONFIG.

Use SKIP-COMPILE to skip compilation option.

Interactive example:
  launch :program \"bin\"

Executes launch `dape-configs' with :program as \"bin\"." (interactive (dape--read-config)) (if (plist-get options 'start-debugging) nil (dape-kill)) (let ((config (dape--config-eval name options))) (if (plist-get options 'start-debugging) nil (let* ((buffer (and t (get-buffer "*dape-debug*")))) (if buffer (save-current-buffer (set-buffer buffer) (let ((inhibit-read-only t)) (erase-buffer))) nil))) (cond ((and (not skip-compile) (plist-get config 'compile)) (dape--compile name config)) ((and (plist-get config 'host) (plist-get config 'port)) (dape--start-multi-session name config)) (t (dape--start-single-session name config))))), 0

I guess the problem is caused by function dape--repl-input-sender, which involves (funcall cmd).

Customizable API for setting debug target

Hi there,

Thanks for this wonderful package. I've been wanting a DAP client in Emacs that isn't lsp-mode dependent 😎.

One other thing I've been wanting for a while is a way to debug individual build targets easily. For example in a C++ project using CMake you can setup multiple test binaries as possible targets and run them through CMake directly. I'm the maintainer of an Emacs package called projection and because projection interfaces with CMake I can expose something to read available test targets from it.

Currently it looks like dap just asks you which executable you want to debug with find-file. What are your thoughts about a more customizable interface for this that can plug in build system related metadata my projection package can provide.

Originally I was thinking a hook and I can just prefix a projection-executable-target command to it and you keep calling functions in the hook until it returns a non-nil variable. But I'm not sure how flexible that would be with the different requirements of each debugger. go-delve for example seems to accept a package argument instead of an executable. Maybe the hooks should be tailored based on the kind of target the dap client requires so it should be an alist 🤔. What are youur thoughts?

codelldb error

I open a cpp project in dired.
dape -> codelldb -> program a.out.

Throw this error.

dape--config-eval: Symbol’s value as variable is void: rust-mode

Config.

(add-to-list 'dape-configs
             '(codelldb
               modes (c-mode c-ts-mode
                             c++-mode c++-ts-mode
                             rust-ts-mode rust-mode)
               ;; Replace vadimcn.vscode-lldb with the vsix directory you just extracted
               command "~/.config/emacs/dape/codelldb/extension/adapter/codelldb"
               host "localhost"
               port 5818
               command-args ("--port" "5818")
               :type "lldb"
               :request "launch"
               :cwd dape-cwd-fn
               :program dape-find-file))

There is a typo in the read.me. A missing ")".

 (setq dape--debug-on '(io info error std-server)

discussion: would it be worth adding warnings for suboptimal configuration?

I personally noticed dape performed worse before changing GC and read-process-output-max, wondering if it'd make sense to add warnings if:

  • read-process-output-max is at the default (4096)
  • If gc-cons-threshold is at the default (800000).
  • If (json-available-p) returns non-true (--with-json flag during build, should be turned on for most distros).

I also think the default debug logging settings substantially slow down Emacs for dape and should probably be tuned. dape should probably emit a warning if logging is aggressive, that it will impact the performance of dape.

Improve documentation for setting up nodejs debugger processes

A few things weren't clear to me:

  • That all keyword args (:keyword) were forwarded to the launch command.
  • When I looked at https://github.com/microsoft/vscode-js-debug/blob/main/OPTIONS.md, I needed to look for the launch command, and that program mapped to it.
  • That any symbol as a value to a keyword argument would be run and resolved at dape start (I think the sentence "Instead, functions and variables are resolved before starting a new session." tries to communicate that, but as a new user, it was not clear)
  • How to run a program with multiple arguments.

After an hour or two of debugging and hacking, I arrived at the following. I usually learn best from examples, maybe we could share this as one of the examples?

(defun dape-jest/find-file-buffer-default ()
  "Read filename at project root, defaulting to current buffer. Return vector of jest args to run said file"
  (let ((file (dape-find-file (buffer-file-name))))
    (if file
        `["--runInBand" "--no-coverage" ,file]
      (user-error "No file found"))))

(defun dape-jest/ensure (config)
  "Ensure node is available, jest is installed, that the dapDebugServer is installed"

  (dape-ensure-command config)
  (let ((js-debug-file (file-name-concat
                        (dape--config-eval-value (plist-get config 'command-cwd))
                        (dape--config-eval-value (car (plist-get config 'command-args)))))
        (node-jest-file (file-name-concat
                         (dape--config-eval-value (plist-get config :cwd))
                         (dape--config-eval-value (plist-get config :program)))))
    (unless (file-exists-p js-debug-file)
      (user-error "Debug server file %S does not exist" js-debug-file))
    (unless (file-exists-p node-jest-file)
      (user-error "Jest executable not found at %S" node-jest-file))))

;; setup jest configuration
(setq dape-configs 
      `((jest
         modes
         (js-mode js-ts-mode typescript-mode)
         ensure dape-jest/ensure
         command "node"
         command-cwd ,(file-name-concat dape-adapter-dir
                                        "js-debug")
         command-args (,(file-name-concat "src" "dapDebugServer.js")
                       :autoport)
         port :autoport
         fn dape-config-autoport
         :type "pwa-node"
         :cwd dape-cwd-fn
         :program "node_modules/.bin/jest"
         :args dape-jest/find-file-buffer-default
         :outputCapture "console"
         :sourceMapRenames t
         :pauseForSourceMap nil
         :autoAttachChildProcesses t
         :console "internalConsole"
         :killBehavior "forceful")))

Explanation:

  • The first element is the configuration name, jest
  • Args 2.. onward are plist key-values pairs.
  • symbol arguments (like port or command are used to configure how to launch the adapter).
  • keyword argument (:program or :cwd) are used to configure the launch command to actually launch the process. Launch command arguments are specific to the dap debug adapter. You can see the ones for the js-debug in OPTIONS.md, under the launch command
  • If a value resolves to a symbol, or an inline function cons structure, that is function is called/evaluated and the return value is substituted. So, for :args, dape will invoke the function dape-jest/find-file-buffer-default, and use the return value (a vector or arguments, which ultimately gets turned in to a JSON array).

The resulting launch command will look something like this:

{
  "type": "request",
  "command": "launch",
  "arguments": {
    "type": "pwa-node",
    "cwd": "/path/to/project",
    "program": "node_modules/.bin/jest",
    "args": ["--runInBand", "--no-coverage", "path/to/my-module-test.ts"],
    "outputCapture": "console",
    "sourceMapRenames": true,
    "pauseForSourceMap": null,
    "autoAttachChildProcesses": true,
    "console": "internalConsole",
    "killBehavior": "forceful"
  }
}

(notice that only keyword args, or those starting with a :, are passed as arguments to the launch command)

...

I want to add, I can open up a PR for this. I just wanted to get a discussion going on it first and your thoughts.

`error in process filter: Invalid format operation %|` with Python tqdm

Hello and thanks for the awesome package which has made my development life much easier. I use dape almost every day.
I recently observed two issues with dape-repl buffer when having tqdm in the Python code I am debugging.

  • I get a carriage-return char ^M on every progressbar update. This was not fixed by set-buffer-file-coding-system to either dos or unix
    Screenshot from 2024-01-20 19-05-25
  • If I close the dape-repl window or navigate to other tabs in Emacs, it'll go completely unresponsive until the debugger has quit or stopped. After that, if I check the minibuffer, I have the following error:
error in process filter: Invalid format operation %| [144 times]
* Exit code: 0 *
* Program terminated *

If I enable debug-on-error, the (Emacs) debugger shows the following:

Debugger entered--Lisp error: (error "Invalid format operation %|")
  dape--repl-message("\15Tesing tqdm:   5%|▌         | 5/100 [00:02<00:47,..." error)
  #f(compiled-function (process event body) "Handle output events." #<bytecode 0x3b8118b8a9e4280>)(#<process Dape adapter> output (:category "stderr" :output "\15Tesing tqdm:   5%|▌         | 5/100 [00:02<00:47,..."))
  apply(#f(compiled-function (process event body) "Handle output events." #<bytecode 0x3b8118b8a9e4280>) #<process Dape adapter> output (:category "stderr" :output "\15Tesing tqdm:   5%|▌         | 5/100 [00:02<00:47,..."))
  dape-handle-event(#<process Dape adapter> output (:category "stderr" :output "\15Tesing tqdm:   5%|▌         | 5/100 [00:02<00:47,..."))
  dape--handle-object(#<process Dape adapter> (:seq 16 :type "event" :event "output" :body (:category "stderr" :output "\15Tesing tqdm:   5%|▌         | 5/100 [00:02<00:47,...")))
  dape--process-filter(#<process Dape adapter> "Content-Length: 160\15\n\15\n{\"seq\": 16, \"type\": \"event\"...")

I could remove the first issue by:

(add-hook 'dape-repl-mode-hook (lambda () (setq buffer-display-table (make-display-table)) (aset buffer-display-table ?\^M [])))

But had no success fixing the second one. Even doing the following changed nothing

(add-hook 'dape-repl-mode-hook (lambda () (remove-hook 'window-buffer-change-functions 'dape--info-buffer-change-fn)))

To reproduce, create the following Python script and run dape using debugpy:

from tqdm.auto import tqdm
import time

for item in tqdm(range(100), "Tesing tqdm"):
    time.sleep(.5)

This is not a very important issue as I can always keep one instance of Emacs open for debugging and one for development and switch between the two instead of switching tabs when the debugger is running. But I thought it may be a good idea to inform you of the issue.
FYI I am on commit #5356093.

Thanks again

Mismatched defcustom type for `dape-key-prefix`

The custom type for dape-key-prefix is set to key which requires that the value has the prefix key-valid-p return true. the point of the key type is

 The value is a valid key according to ‘key-valid-p’, and suitable
for use with, for example ‘keymap-set’.

What I think you meant to use was key-sequence so the change would simply be

(defcustom dape-key-prefix "\C-x\C-a"
  "Prefix of all dape commands."
  :type 'key-sequence)

dape and golang delve - debug errors on startup

I did read https://github.com/svaante/dape#go---dlv

dlv is in my path

I am within a golang project, M-x compile set to go build works. eglot gopls is successfully attached (and providing eg. completions through capfs)

I did inspect *dape-debug*:

[info] Starting new multi session
[info] Server process started ("dlv" "dap" "--listen" "127.0.0.1:0")
[std-server] Server stdout:
DAP server listening at: 127.0.0.1:57588

and *dape-processes* which is empty.

I start dape using M-x dape and I am prompted with

dlv command-cwd "c:/Users/UNAME/code/PROJ/" :cwd "c:/Users/UNAME/code/PROJ/" :program "c:/Users/UNAME/code/PROJ/"

I leave it as such. After maybe 10 seconds I am prompted with the error message "unable to connect to server localhost:0"

a simple dlv dap successfully starts up. What am I doing wrong or where can I find more debug information about the underlying issue?

`debugpy` will not terminate politely.

There is a docker image which can reproduce the problem:

https://hub.docker.com/repository/docker/northyear/dape-repro/general

steps to reproduce:

  1. launch that docker image docker run -it —rm dape-repro
  2. cd ~/.emacs.d
  3. emacs -nw hello.py
  4. add a break point at the second line: sum = 0
  5. C-x C-a d debugpy RET, that is, execute dape
  6. C-x C-a c, that is, execute dape-continue.
  7. C-x C-cto quit emacs.
  8. ps -a, see that debugpy process does not quit and keep consuming high CPU usage (100% in my computer)

This is the config file used for the docker image:

(require 'package)
(setq package-user-dir "~/.emacs.d/emacs-package-dir")

(setq debug-on-error t)

(setq package-list '())
(add-to-list 'package-archives '("melpa" . "https://melpa.org/packages/"))
(package-initialize)

(unless package-archive-contents
  (package-refresh-contents))

(dolist (package package-list)
  (unless (package-installed-p package)
    (package-install package)))

(setq warning-minimum-level :error)

(menu-bar-mode -1)
;;(tool-bar-mode -1)
;;(scroll-bar-mode -1)
(xterm-mouse-mode 1)

(setq scroll-step 1)
(setq scroll-conservatively 10000)
(setq auto-window-vscroll nil)

(add-to-list 'load-path "~/.emacs.d/emacs-package-dir/dape")

(defun plistp (object)
  "Non-nil if and only if OBJECT is a valid plist."
  (let ((len (proper-list-p object)))
    (and len (zerop (% len 2)))))

(require 'dape)

(add-to-list 'dape-configs
                 '(debugpy
                   modes (python-ts-mode python-mode)
                   command "~/.emacs.d/venv/bin/python3"
                   command-args ("-m" "debugpy.adapter")
                   :type "executable"
                   :request "launch"
                   :cwd dape-cwd-fn
                   :program dape-find-file-buffer-default))

Enhancing dape REPL to Display Object Properties

Hi! Thank you for this package. It has significantly improved my workflow, which led me to use Emacs almost exclusively, transitioning from VS Code.

Background:

In both VS Code and Neovim (using DAP), the debugger's REPL provides an interactive way to inspect objects. It displays the properties of objects when they are printed, as shown in the screenshot below from VS Code:
image

Issue:

In contrast, when working with dape, the REPL only outputs either the string representation of objects or the object is not printed at all, hence inspection is not possible. Here is an example of how it currently looks in dape:
image

As a workaround, I've been using the watch window for object inspection. While this workaround is functional, having the capability directly in the REPL would help reduce the need for additional windows beyond the source code and REPL itself in many cases.

Question:

Is there a possibility to enhance the dape REPL to mirror the object inspection feature found in VS Code/Neovim DAP? If so, could you provide guidance on how one might contribute to or implement this feature?

Feature request: tbreak

Hi!

Oftentimes I need to continue running until certain point in code.
In order to do that, right now I can go to repl R, put a temporary breakpoint by manually typing tbreak $line and then continue c.
Instead it would be awesome if I could for example C-x C-a j, or jump to the current line, which would do what I described earlier - put a temporary breakpoint on the current line and continue.

And probably it would also be useful to expose dape-breakpoint-temporary so one could bind it directly and use together with dape-continue.

Personally I would bind dape-breakpoint-toggle to b, dape-breakpoint-temporary to say C-b and dape-breakpoint-expression to M-b, and then use e for dape-evaluate-expression. Which I can surely do in my config, and I'm sharing this just because it may be a useful addition for the README, to show how to configure dape to better fit one's needs.

Thank you for this project, it looks very promising!

`flutter` DAP: Timeout reached for seq 1

Hello,

Thank you so much for the so needed awesome package!! :-)

Description

When I try dape with flutter debug adapter, I get the below error in *dape-debug* buffer:

[info] Starting new single session
[info] Process started ("flutter" "debug_adapter")
[io] Sending:
(:arguments
 (:clientID "dape" :adapterID "flutter" :pathFormat "path"
		:linesStartAt1 t :columnsStartAt1 t
		:supportsRunInTerminalRequest t :supportsProgressReporting
		t :supportsStartDebuggingRequest t)
 :type "request" :command "initialize" :seq 1)

[error] Timeout for reached for seq 1

Although, in the debug adapter logs (buffer *dape-processes*) It looks like the response for seq 1 request was sent from the adapter:

Content-Length: 556
Content-Type: application/vscode-jsonrpc; charset=utf-8

{"seq":1,"type":"response","body":{"exceptionBreakpointFilters":[{"default":false,"filter":"All","label":"All Exceptions"},{"default":true,"filter":"Unhandled","label":"Uncaught Exceptions"}],"supportsClipboardContext":true,"supportsConditionalBreakpoints":true,"supportsConfigurationDoneRequest":true,"supportsDelayedStackTraceLoading":true,"supportsEvaluateForHovers":true,"supportsLogPoints":true,"supportsRestartRequest":false,"supportsTerminateRequest":true,"supportsValueFormattingOptions":true},"command":"initialize","request_seq":1,"success":true}Content-Length: 56
Content-Type: application/vscode-jsonrpc; charset=utf-8

{"seq":2,"type":"event","body":{},"event":"initialized"}

How to reproduce

  1. Install flutter SDK as described in the manual SDK installation.

  2. Install the dart-mode package.

  3. Add flutter dape config:

    (add-to-list 'dape-configs
     		 '(flutter
     		   modes (dart-mode)
     		   command "flutter"
     		   command-args ("debug_adapter")
     		   command-cwd dape-cwd-fn
     		   :type "flutter"
     		   :request "launch"
     		   :cwd dape-cwd-fn
     		   :dartSdkPath "<path-where-flutter-archive-was-unzipped>/flutter/bin/cache/dart-sdk"
     		   :flutterSdkPath "<path-where-flutter-archive-was-unzipped>/flutter/"
     		   :program dape-cwd-fn
     		   :sendLogsToClient t
     		   :noDebug t))

    I used https://github.com/flutter/flutter/blob/master/packages/flutter_tools/lib/src/debug_adapters/README.md as a reference for the configuration.

  4. Create a flutter app from the CLI using the command:

    flutter create testapp

  5. Open the testapp/lib/main.dart file, and start dape.

Put indicators in the left-fringe area

Hej Hej,

Thanks for that package! I waited for something like this.

One thing that I noticed is that the indicators are before the first symbol in the line. This makes the line jump a little bit to the right.
For something like python this is kinda bad because the indentations have meaning...

I think it would be better looking if it the indicators would be in the fringe area.

I did some quick hacking to create a screenshot. That is now the current breakpoint symbol and the one I created.

gscreenshot_2023-10-19-143729

If you think this is a good idea, it is of course possible to let the user decide and make both solution possible.

What do you think?

Cheers,
OlMon

Recommend Projects

  • React photo React

    A declarative, efficient, and flexible JavaScript library for building user interfaces.

  • Vue.js photo Vue.js

    🖖 Vue.js is a progressive, incrementally-adoptable JavaScript framework for building UI on the web.

  • Typescript photo Typescript

    TypeScript is a superset of JavaScript that compiles to clean JavaScript output.

  • TensorFlow photo TensorFlow

    An Open Source Machine Learning Framework for Everyone

  • Django photo Django

    The Web framework for perfectionists with deadlines.

  • D3 photo D3

    Bring data to life with SVG, Canvas and HTML. 📊📈🎉

Recommend Topics

  • javascript

    JavaScript (JS) is a lightweight interpreted programming language with first-class functions.

  • web

    Some thing interesting about web. New door for the world.

  • server

    A server is a program made to process requests and deliver data to clients.

  • Machine learning

    Machine learning is a way of modeling and interpreting data that allows a piece of software to respond intelligently.

  • Game

    Some thing interesting about game, make everyone happy.

Recommend Org

  • Facebook photo Facebook

    We are working to build community through open source technology. NB: members must have two-factor auth.

  • Microsoft photo Microsoft

    Open source projects and samples from Microsoft.

  • Google photo Google

    Google ❤️ Open Source for everyone.

  • D3 photo D3

    Data-Driven Documents codes.